A dairy processing facility in Minnesota shipped 18,000 bottles over a four-day period with fill levels ranging from 12% under to 6% over specification. The root cause traced to a capacitive level sensor that had drifted gradually out of calibration, reporting containers as full when they were actually underfilled. Quality sampling had not caught the problem because affected bottles were distributed randomly through production runs. The recall cost exceeded $340,000 in direct expenses, but the damage to retailer relationships required 18 months to fully repair. Post-incident analysis revealed the sensor had been drifting for three weeks before failure, generating subtle changes in signal patterns that went undetected. Facilities implementing predictive maintenance filling line monitoring with AI-driven sensor health analysis identify drift patterns weeks before they cause quality escapes, protecting both product integrity and brand reputation.
Sign up to implement AI-driven sensor health monitoring or book a demo to see how predictive analytics catches sensor drift before it affects product quality.
Predictive AI
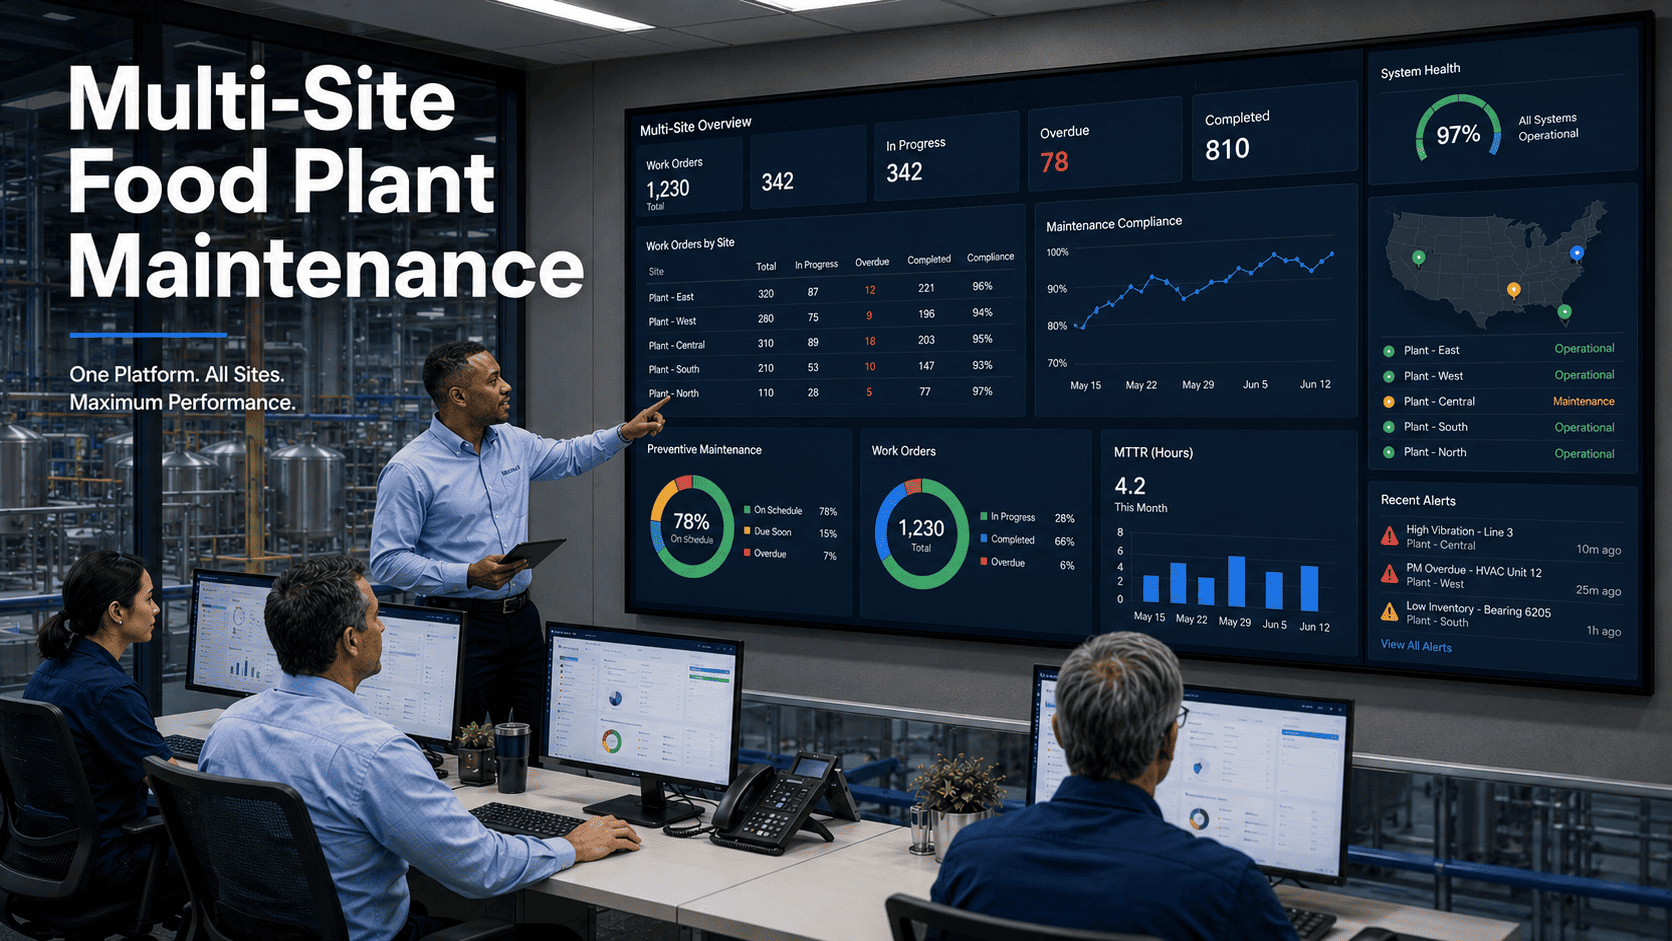
Predictive Maintenance for Filling Line Sensor Misread Detection Using AI
AI-powered sensor health monitoring detects calibration drift and degradation weeks before sensors cause quality escapes.
Detection Rate for Sensor Drift Before Quality Impact
Of Fill Level Issues Trace to Sensor Problems
Of Sensors Drift Beyond Tolerance Within 90 Days
2-5 wk
typical
Advance Warning Before Sensor Drift Affects Quality
Why Sensor Misreads Are Predictable
Sensors rarely fail instantly. Level sensors drift gradually as transducers age and contamination accumulates. Presence sensors lose sensitivity progressively as optical surfaces degrade. Temperature sensors develop offset errors that increase over time. These changes happen continuously, creating patterns in the data that AI algorithms can detect long before the sensor fails specification requirements.
Traditional calibration schedules check sensors at fixed intervals, but degradation doesn't follow fixed schedules. A sensor might hold calibration perfectly for six months, then drift rapidly due to process changes, environmental shifts, or component aging. AI monitoring tracks sensor behavior continuously, detecting the onset of drift regardless of when it occurs relative to the calibration schedule.
67%
of fill level quality issues trace directly to sensor problems rather than filling equipment malfunctions. The filling system performs correctly, but degraded sensors report incorrect information that causes the control system to make wrong decisions. Predicting sensor health addresses the majority of fill-related quality problems at their source.
Effective sensor health prediction requires understanding how different sensor types degrade, capturing the data signatures that indicate developing problems, and applying AI algorithms that distinguish normal variation from genuine drift. The monitoring approaches and predictive capabilities described in this guide provide the framework for implementing proactive sensor health management on food and beverage filling lines.
Sign up for Oxmaint to access AI-powered sensor health algorithms designed for filling line applications.
Critical Monitoring Points for Sensor Health Prediction
Effective sensor health prediction requires monitoring specific parameters that indicate degradation. These monitoring points capture the data AI algorithms need to identify sensor problems before they affect production quality.
Tracking raw signal strength from sensors reveals degradation patterns that precede detection failures or false readings.
Sensor Types Monitored
Photoelectric presence sensors
Ultrasonic level sensors
Capacitive fill sensors
Optical inspection sensors
Detects
Gradual signal degradation from contamination
LED/transducer aging reducing output
Cable degradation causing signal loss
Measuring sensor response latency identifies developing problems that will eventually cause timing errors and missed detections.
Sensor Types Monitored
Container presence sensors
Position verification sensors
Cap detection sensors
Reject confirmation sensors
Detects
Increasing response latency from degradation
Intermittent delays indicating connection issues
Processing delays from aging electronics
Continuous comparison of sensor readings against known references reveals calibration drift before it exceeds tolerance.
Sensor Types Monitored
Fill level sensors (all types)
Temperature sensors
Pressure transducers
Flow meters
Detects
Gradual offset drift from component aging
Span drift affecting measurement range
Non-linear errors developing over time
Analyzing noise patterns in sensor signals identifies electrical issues and environmental interference affecting measurement quality.
Sensor Types Monitored
Analog level sensors
Load cells and strain gauges
Temperature transmitters
Pressure sensors
Detects
EMI interference from nearby equipment
Grounding issues causing erratic readings
Cable shielding degradation
Monitoring how sensors respond to temperature and humidity changes reveals compensation circuit degradation.
Sensor Types Monitored
Ultrasonic sensors with temperature compensation
Capacitive sensors sensitive to humidity
Optical sensors affected by ambient light
Pressure sensors with temperature effects
Detects
Temperature compensation circuit failures
Humidity sensitivity increasing over time
Environmental correlation changes indicating degradation
Tracking false positive and false negative patterns reveals developing sensor problems before they affect production.
Sensor Types Monitored
Presence detection sensors
Inspection and reject sensors
Cap/closure detection sensors
Label verification sensors
Detects
Increasing false reject rate from sensitivity drift
Missed detection patterns from degradation
Intermittent failure patterns from connection issues
AI-Powered Sensor Health Prediction for Your Filling Lines
Oxmaint's predictive algorithms analyze sensor behavior continuously, identifying drift and degradation weeks before quality impact.
Sensor Failure Predictions
AI analysis identifies specific sensor degradation modes developing on your filling line. Each prediction includes the affected sensor type, estimated time to tolerance exceedance, and recommended corrective action.
Predictive Signatures
Progressive offset between measured and reference values
Fill weight variance increasing over time
Consistent bias direction (always high or low)
Drift rate accelerating from initial detection
Failure Impact
Containers filled to incorrect levels, causing regulatory compliance issues with net contents, customer complaints, or product giveaway from overfilling. Quality escapes continue until manual detection.
Predictive Signatures
Signal strength declining progressively
Response time increasing from baseline
Intermittent missed detections under borderline conditions
Environmental correlation changes (worse after CIP/washdown)
Failure Impact
Missed container detections cause fill valves to cycle without product, timing errors at transfers, and reject system failures. Production interruptions increase as contamination worsens.
Predictive Signatures
Consistent offset from redundant sensors or references
Fill volume calculations showing systematic bias
Product density corrections becoming inaccurate
Offset magnitude increasing over time
Failure Impact
Incorrect temperature compensation causes fill volume errors. Products with temperature-sensitive viscosity fill incorrectly. Hot-fill operations may have inadequate sterilization temperatures.
Predictive Signatures
Image quality metrics declining progressively
False reject rate increasing without recipe change
Inspection score variance widening
Focus quality degrading over time
Failure Impact
Good product rejected unnecessarily increasing waste, or defective product passes inspection and reaches customers. Label verification, fill level inspection, and code reading become unreliable.
Predictive Signatures
Echo amplitude decreasing over time
Measurement repeatability degrading
Dead band distance increasing
Response to foam or turbulence becoming erratic
Failure Impact
Fill level measurements become increasingly unreliable, with higher variance and eventual failure to detect product surface. Gradual degradation may not trigger immediate alarms but steadily worsens accuracy.
Predictive Signatures
Intermittent signal dropouts or spikes
Noise patterns correlating with vibration or temperature
Signal quality varying with connector movement
Increasing frequency of communication errors
Failure Impact
Unpredictable sensor behavior causes sporadic quality issues and production interruptions. Problems may appear and disappear, making troubleshooting difficult until complete failure occurs.
Implementation Roadmap
Deploying predictive sensor health monitoring follows a structured approach that builds capability progressively. Each phase establishes the foundation for subsequent capabilities.
Sensor Inventory and Assessment
Week 1-2
Document all sensors on filling lines by type, location, and criticality
Review calibration history and failure records
Identify sensors with history of drift or reliability issues
Assess data availability from existing control systems
Define priority sensors for initial monitoring deployment
Data Integration and Capture
Week 3-5
Configure PLC/SCADA integration for sensor raw values
Enable signal quality and diagnostic data capture
Establish reference points for calibration comparison
Verify data quality and transmission reliability
Configure environmental data capture (temperature, humidity)
Baseline Establishment
Week 6-9
Collect baseline data from sensors in known good calibration
Capture behavior across different products and operating conditions
Document normal variation ranges for each sensor type
Train AI models on normal sensor behavior patterns
Validate baseline accuracy with manual calibration checks
Predictive Model Activation
Week 10-12
Activate drift detection algorithms on live sensor data
Configure alert thresholds based on quality impact levels
Train maintenance and quality teams on prediction interpretation
Establish response procedures for different alert types
Run parallel with existing calibration program to validate
Optimization and Expansion
Ongoing
Refine detection thresholds based on actual outcomes
Expand monitoring to additional sensor types and locations
Transition from scheduled to condition-based calibration
Integrate predictions with calibration management systems
Track and report quality escape prevention metrics
Catch Sensor Drift Before It Affects Quality
Oxmaint's implementation team guides you through every phase of predictive sensor health monitoring deployment.
ROI and Business Impact
Predictive sensor health monitoring delivers measurable financial returns through quality escape prevention, reduced calibration costs, optimized sensor replacement, and regulatory compliance protection.
94%
Detection Before Quality Impact
Catching sensor drift before it affects product quality eliminates costly recalls, customer complaints, and regulatory issues.
Example Calculation
Average recall cost: $250,000
Annual sensor-related escapes: 2-3
94% prevention saves: $470,000+/year
42%
Reduction in Calibration Events
Condition-based calibration eliminates unnecessary calibration of sensors holding specification while ensuring critical sensors are calibrated when needed.
Example Calculation
Annual calibration cost: $85,000
Production downtime for cal: $35,000
42% reduction saves: $50,400/year
28%
Longer Sensor Service Life
Replacing sensors based on actual condition rather than fixed schedules optimizes capital expenditure while maintaining measurement quality.
Example Calculation
Annual sensor replacement: $45,000
28% life extension saves: $12,600/year
Avoids premature replacement of good sensors
100%
Audit Documentation Coverage
Continuous monitoring provides complete documentation of sensor health status, demonstrating the proactive control auditors expect.
Example Calculation
FDA warning letter response: $150,000+
Customer audit findings: Contract risk
Prevention value: Substantial
Typical First-Year ROI Summary
$470K+
Quality Escape Prevention
$63K
Calibration & Sensor Savings
Integration Capabilities
Oxmaint predictive sensor monitoring integrates with your existing systems to maximize value from AI-driven health insights.
PLC
PLC/SCADA Integration
Direct connection to control systems captures sensor raw values, diagnostic data, and quality measurements without additional instrumentation.
Raw sensor value capture at high resolution
Diagnostic register access for sensor health data
Quality measurement integration
Historical trend data import
CAL
Calibration Management Integration
Bi-directional integration with calibration management systems synchronizes predictions with calibration scheduling and results documentation.
Automatic calibration work order generation
As-found/as-left data correlation
Calibration schedule optimization
Certificate and traceability linking
QMS
Quality System Integration
Connect sensor health data with quality management systems for complete traceability from sensor condition to product quality outcomes.
Quality deviation correlation
Product lot traceability
CAPA integration for sensor issues
Audit trail documentation
IOT
Smart Sensor Platforms
Connect with IO-Link and other smart sensor protocols to access built-in diagnostics and self-monitoring capabilities for enhanced prediction.
IO-Link diagnostic data access
Built-in sensor self-test integration
Asset identification and tracking
Automatic parameter backup
Best Practices for Predictive Sensor Monitoring
Maximize the effectiveness of AI-driven sensor health prediction with these operational practices.
1
Maintain Reference Points
Drift detection requires comparison against known good references. Maintain certified reference standards for periodic verification. When AI flags drift, confirm with manual check against traceable standards.
2
Document Calibration Outcomes
When sensors are calibrated based on predictions, document as-found conditions. Was the prediction accurate? What was the actual drift? This feedback improves prediction accuracy and validates the monitoring system.
3
Clean Before Concluding Failure
Many sensor degradation signatures result from contamination rather than sensor failure. Before replacing sensors, clean thoroughly and recheck. AI can distinguish contamination patterns from genuine failure, guiding appropriate response.
4
Coordinate with Production Planning
Share sensor health predictions with production planning so calibration can be scheduled during natural breaks. Advance warning from AI enables optimized timing rather than emergency calibration during production.
5
Track Quality Correlation
Monitor quality metrics alongside sensor health predictions. When quality issues occur, check if corresponding sensors showed degradation warnings. This validates prediction value and identifies monitoring gaps.
6
Gradual Transition to Condition-Based
Don't immediately abandon scheduled calibration. Run prediction system parallel to existing schedules initially. As confidence builds through validated predictions, gradually extend intervals for sensors showing stable health.
Frequently Asked Questions: Predictive Sensor Monitoring
How does AI detect sensor drift without external references?
AI uses multiple approaches: trending sensor readings against historical baselines, comparing correlated sensors that should agree, analyzing statistical properties of the signal, and monitoring diagnostic parameters. Together these methods detect drift even without continuous external reference comparison.
What happens when AI predicts sensor drift but calibration shows it's fine?
This feedback is valuable for model improvement. Document the prediction and actual finding. The AI learns from these outcomes and adjusts thresholds. Some initial false positives are normal as the system learns your specific sensors and environment.
Can this replace our scheduled calibration program?
Predictive monitoring can significantly reduce calibration frequency for stable sensors while ensuring at-risk sensors are calibrated when needed.
Sign up for Oxmaint to transition toward condition-based calibration gradually, maintaining scheduled calibration as a backup until prediction accuracy is validated.
What data resolution is needed for effective prediction?
For most filling line sensors, capturing data every 1-5 seconds provides sufficient resolution for drift detection. Higher frequency capture (milliseconds) may be useful for analyzing signal noise and response time. The system adapts to available data resolution.
How do we validate that predictions are preventing quality escapes?
Track quality escape incidents before and after implementation. Correlate predictions with actual sensor conditions found during calibration. Monitor quality metrics (fill variance, reject rates) for improvement. The system provides dashboards showing detection rates and quality correlation.
Prevent Sensor-Related Quality Issues Before They Happen
Oxmaint AI-powered sensor health prediction identifies drift weeks before it affects product quality, protecting your brand and customer relationships.