Maintenance cost per unit produced is the KPI that connects your maintenance budget directly to the P&L — and in food manufacturing, where the industry average sits at 60–65% OEE against a world-class 85%, the gap between those two numbers is almost entirely a maintenance execution story. When a packaging line running at 72% OEE instead of 85% means $1.2M in lost production annually, maintenance cost per unit isn't an accounting exercise — it's the clearest signal of whether your program is creating or destroying value. Teams that start tracking it start a free trial with Oxmaint to get automated KPI tracking from day one, or book a demo and we'll show you your current maintenance cost per unit from your existing work order data.
Maintenance Cost Per Unit Produced: The KPI Food Plants Must Track
How to calculate, benchmark, and systematically reduce the metric that links every maintenance decision to production profitability.
What Is Maintenance Cost Per Unit Produced?
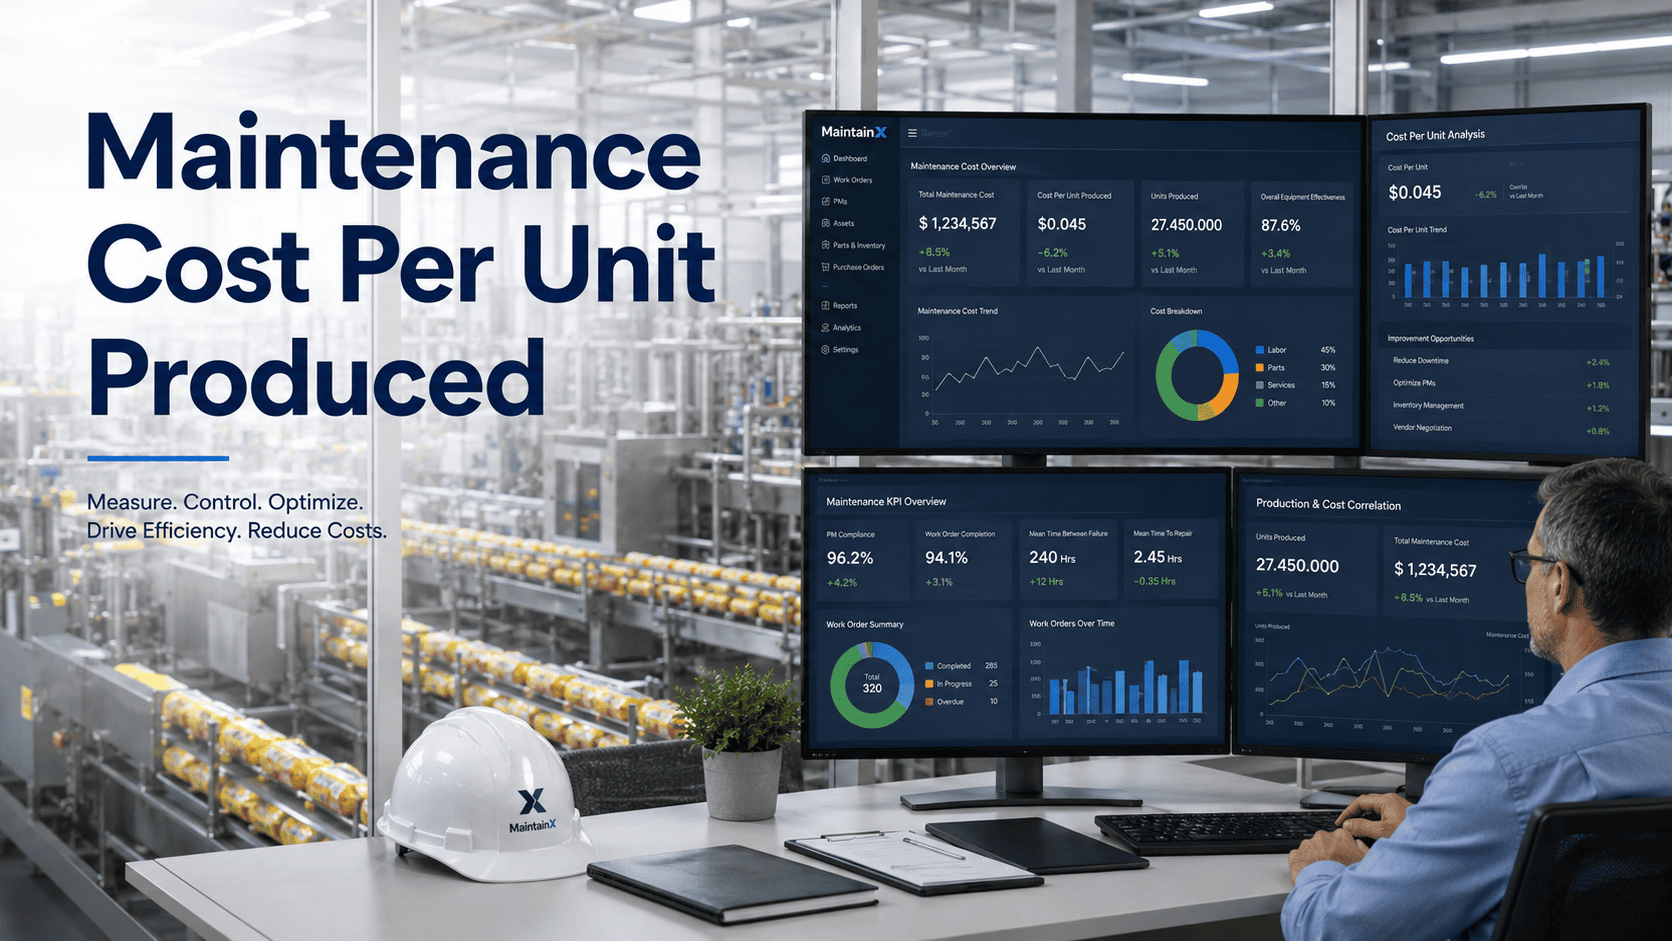
Maintenance cost per unit produced is a KPI that divides total maintenance expenditure (labor, parts, contractors, and indirect costs) by the number of units produced during the same period. It normalizes maintenance spend against output volume, making costs comparable across production periods, sites, and product lines regardless of how much the plant produced.
The formula is straightforward: Maintenance Cost Per Unit = Total Maintenance Costs / Total Units Produced. But the power of this KPI comes from its sensitivity — a rising cost per unit when production is flat signals deteriorating equipment performance or reactive maintenance creep. A falling cost per unit during volume growth confirms your maintenance program is gaining efficiency at scale.
For food manufacturers, this metric integrates naturally with OEE analytics — because the same failures driving low OEE drive high maintenance cost per unit. Fix the reliability program, and both numbers improve simultaneously. Oxmaint tracks both in the same platform, giving food plant managers a unified picture of maintenance financial performance.
6 Key Concepts Every Food Plant Manager Should Know
The Calculation Method
Total maintenance costs include all labor (direct and overtime), spare parts consumed, contractor invoices, and indirect costs like equipment rental. Divide by total units produced in the same reporting period. Calculate weekly for trending, monthly for management reporting.
Planned vs Unplanned Cost Split
The composition of cost per unit matters as much as the number. A target is 70–80% planned maintenance and under 20% reactive. Plants where reactive work exceeds 30–40% consistently have 2–3x higher cost per unit than those running disciplined PM programs.
Benchmarking by Asset Intensity
Maintenance cost per unit benchmarks vary widely by product category and asset intensity. Beverage operations average $0.06–$0.12/unit; protein processing $0.10–$0.20/unit; confectionery $0.04–$0.09/unit. Compare against your own historical trend before external benchmarks.
The OEE Connection
Every 1% improvement in OEE typically reduces maintenance cost per unit by 0.8–1.2% at stable production volume. This is because most OEE losses originate from the same reliability failures driving reactive maintenance spend. Tracking both together reveals the true ROI of each maintenance investment.
Volume Sensitivity — The Denominator Effect
During low-volume periods, cost per unit rises even if maintenance expenditure is flat — because fixed maintenance costs are spread over fewer units. Understand this seasonal effect before drawing conclusions. Trend analysis over 12+ months smooths this distortion.
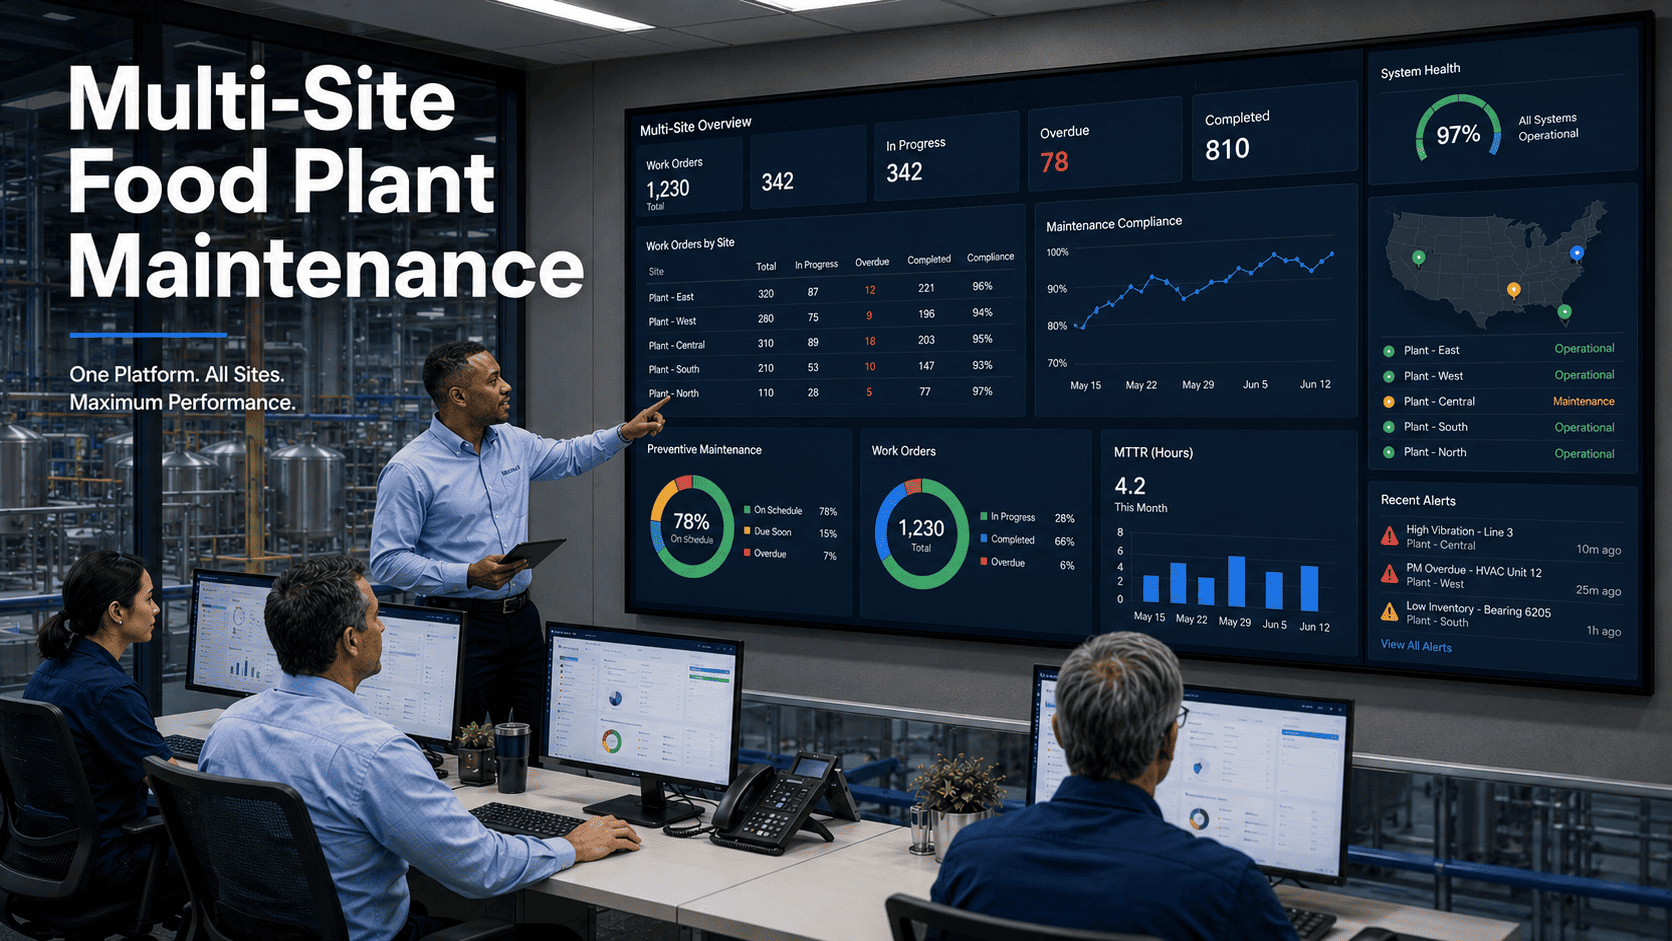
Multi-Site Benchmarking
For food manufacturers with multiple plants, internal benchmarking of cost per unit across sites is more actionable than external data. Underperforming sites become visible; best practices from the leading site can be replicated. Oxmaint's multi-site dashboard makes this comparison automatic.
4 Pain Points That Drive Maintenance Cost Per Unit Higher
Reactive Maintenance Dominance
Emergency repairs cost 3–5x more than the same work scheduled as planned PM. When reactive work exceeds 30% of total spend, cost per unit escalates significantly — and the premium is pure waste that preventive programs eliminate.
No Visibility Into What's Driving Cost
Without asset-level cost tracking in a CMMS, it's impossible to know whether rising maintenance spend comes from one chronically failing asset, excessive parts waste, or rising contractor rates. Blind budgeting means no targeted action — costs stay high or keep rising.
Parts Inventory Inefficiency
Holding excess spare parts ties up capital; insufficient inventory extends MTTR and drives overtime. Both inflate maintenance cost per unit. CMMS-managed inventory with auto-reorder points optimizes the balance — cutting dead stock and stockout delays simultaneously.
Deferred Maintenance Compounding
Deferred PM doesn't disappear — it accumulates as degraded equipment that fails more frequently and requires more expensive repairs. A $300 PM interval skipped becomes a $2,400 repair 6 months later. CMMS compliance tracking closes this loop before it compounds.
Understanding your cost drivers is the first step — book a demo and we'll show you how Oxmaint maps maintenance spend to individual assets in your food plant.
How Oxmaint Reduces Maintenance Cost Per Unit
Asset-Level Cost Tracking
Every work order in Oxmaint logs labor hours, parts consumed, and contractor costs — assigned to the specific asset. This creates per-asset maintenance cost history that identifies chronic failure contributors and drives targeted investment decisions. See Oxmaint asset management.
PM Compliance That Prevents Cost Spikes
Oxmaint's preventive maintenance engine schedules and auto-assigns PM tasks — with escalation alerts when compliance slips. Maintaining 85%+ PM compliance is the single highest-impact action for reducing maintenance cost per unit in food plants.
Predictive Failure Prevention
IoT sensor feeds analyzed by Oxmaint predictive maintenance catch developing failures weeks before they occur — eliminating the 3–5x cost premium of reactive repairs. Prediction accuracy: 94%.
Inventory Optimization
Auto-reorder points in Oxmaint's parts inventory module eliminate both stockout delays (which extend MTTR and drive overtime) and excess holding costs. Right-sized inventory reduces the total maintenance cost numerator without reducing repair capability.
OEE Integration for Unified Visibility
Oxmaint's OEE analytics track availability, performance, and quality in real time — connecting maintenance activity directly to production output so cost per unit trends are visible as they develop, not at month end.
KPI Dashboards for Every Level
From technician work order completion to CFO-level maintenance cost trending, Oxmaint's analytics and reporting dashboards give every stakeholder the maintenance cost data they need — updated continuously from live work order activity.
Before vs After: CMMS Impact on Maintenance Cost Per Unit
| KPI Dimension | Before CMMS (Reactive) | After Oxmaint Implementation |
|---|---|---|
| PM compliance rate | 40–60% — tasks missed or delayed | 85–95% — auto-assigned and tracked |
| Reactive vs planned split | 40–60% reactive spend | Under 20% reactive; 80%+ planned |
| Cost per unit trending | Unknown — no per-asset tracking | Tracked weekly; anomalies flagged immediately |
| Parts cost | Emergency buys at 2–3x catalog price | Stocked proactively; auto-reorder at optimal levels |
| Unplanned downtime | High — failures drive production stoppages | 62% reduction — failures caught before impact |
| Multi-site benchmarking | Not possible without manual compilation | Automatic cross-site KPI comparison in dashboard |
ROI Results: What Plants Actually Achieve
Calculate your potential cost per unit reduction — use the Oxmaint ROI calculator or start a free trial and get your first asset-level cost report running today.
Frequently Asked Questions
How do I calculate maintenance cost per unit produced in a food plant?
Divide your total maintenance costs for the period — including direct labor, overtime, spare parts consumed, contractor invoices, and allocated indirect costs — by the total units of product produced in the same period. Track weekly for trend visibility and monthly for management reporting. Oxmaint calculates this automatically from work order cost data linked to your production records.
What is a good benchmark for maintenance cost per unit in food manufacturing?
Benchmarks vary significantly by product type and asset intensity. CMMS-managed food plants typically achieve $0.04–$0.08 per unit; reactive-heavy operations commonly run $0.18–$0.28 per unit. More useful than external benchmarks is your own trend over time — a consistently declining cost per unit at stable quality confirms program improvement regardless of where the absolute number sits. As a percentage of asset replacement value, a maintenance cost under 5% annually is considered world-class.
Why does my maintenance cost per unit keep rising even when production is stable?
Rising cost per unit at stable production typically points to one of three causes: reactive maintenance creep (PM compliance dropping, more emergency repairs at 3–5x planned cost), aging assets approaching end-of-economic-life (increasing failure frequency), or parts inventory issues (emergency procurement at premium prices). CMMS asset-level cost tracking isolates which driver is responsible so targeted action replaces guesswork.
How does Oxmaint track maintenance cost per unit automatically for food plants?
Oxmaint logs labor time, parts usage, and contractor costs on every work order — assigned to the specific asset. When integrated with production data, the platform calculates and trends maintenance cost per unit across assets, production lines, sites, and time periods automatically. Oxmaint's analytics dashboard surfaces this alongside OEE, MTBF, and PM compliance — giving food plant managers a complete performance picture without manual reporting.
Stop Guessing What Maintenance Is Costing You Per Unit
Oxmaint tracks every work order cost against the assets that drive it — giving food plant managers the asset-level data to identify what's raising cost per unit and the PM engine to reduce it systematically.
- Automated maintenance cost per unit tracking from live work order data
- PM compliance engine that prevents the reactive cost premium
- OEE-linked analytics connecting maintenance to production profitability
Trusted by 1000+ clients across food manufacturing and industrial operations · 2.4x ROI in 18 months · Live in days