The average food and beverage plant spends $0.07–$0.12 per pound of product on energy. For a mid-size facility running 500,000 lbs per day, that is $12–22 million annually in energy costs — and most plant managers cannot tell you within 15% how that number breaks down by system, line, or shift. ENERGY STAR certified food plants have demonstrated that structured energy management reduces consumption by 10–25% without capital investment. The difference is not equipment — it is measurement, accountability, and an asset management system that connects energy consumption to specific assets and work orders. If your facility cannot track energy intensity by production unit, you are not managing energy — you are just paying the bill. Start a free trial to connect your utility data to asset-level energy tracking in Oxmaint, or book a demo and we will show you how food plants benchmark EPI scores and build ISO 50001 action plans inside the platform.
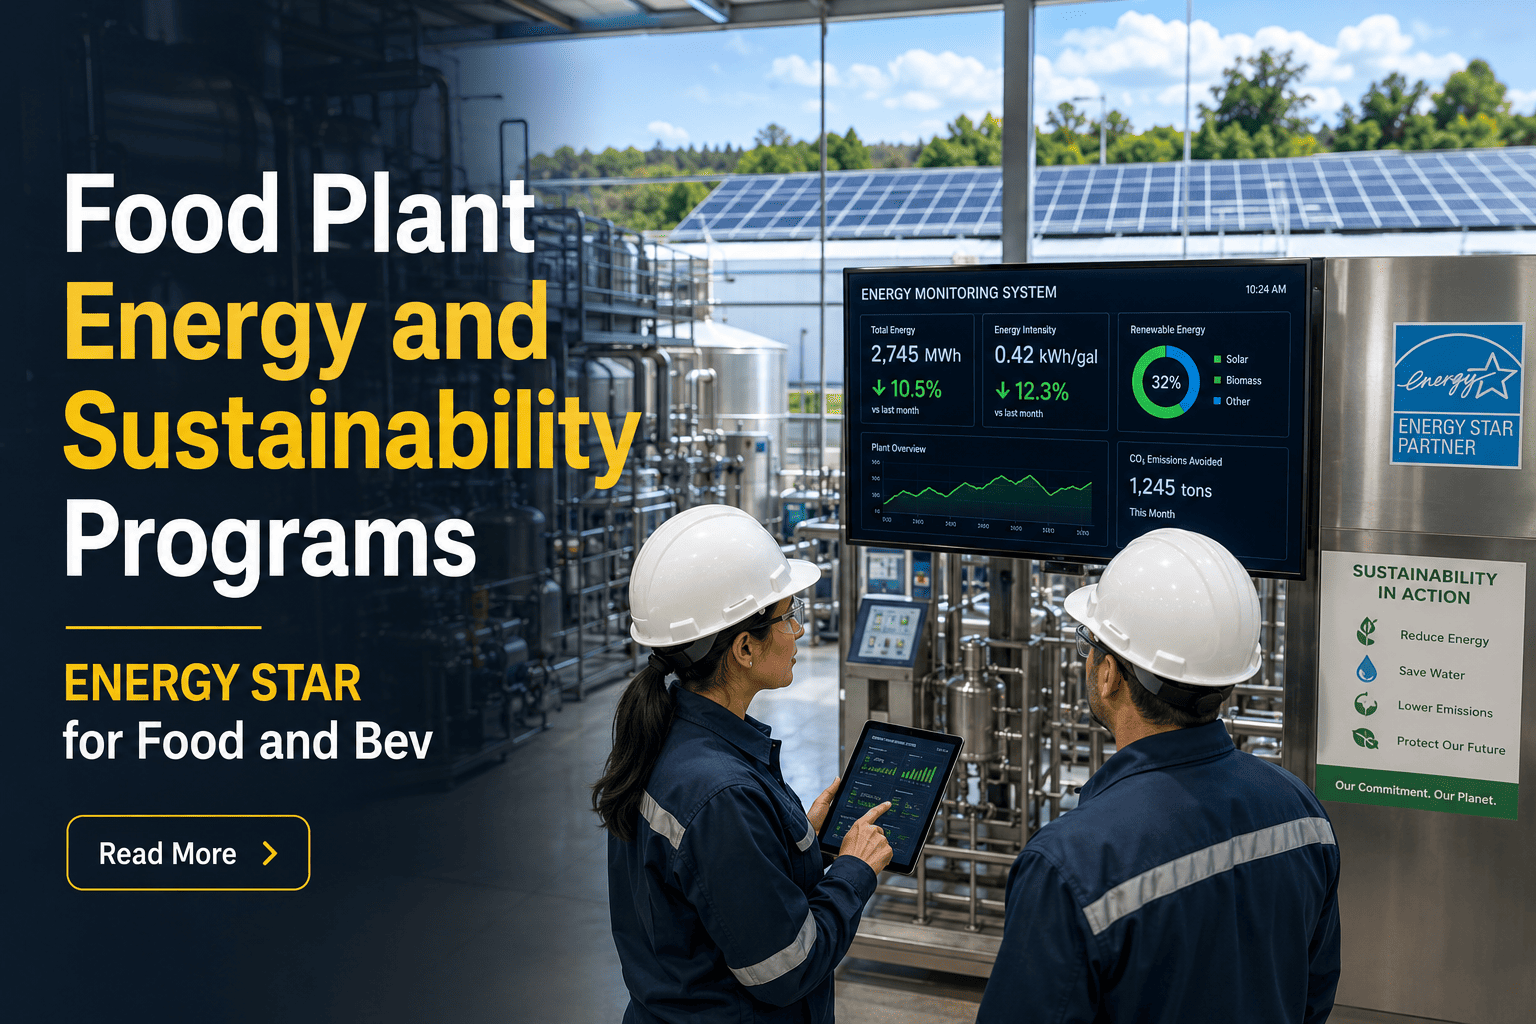
OxMaint — Energy and Sustainability for Food Manufacturing
ENERGY STAR certified food plants reduce energy costs by 10–25% without new capital equipment.
- Asset-level energy consumption tracking and benchmarking
- Automated PM scheduling tied to energy performance targets
- Scope 1, 2, and 3 emissions data linked to asset records
25%
Energy Reduction in ENERGY STAR Plants
vs industry average, EPA ENERGY STAR data
$2.1T
Global Food Industry Energy Spend
Annual direct and indirect energy costs, IEA 2024
38%
of Scope 1 Emissions Are Maintenance-Related
Degraded equipment, steam leaks, compressed air losses
ISO 50001
Energy Management Standard
Adopted by 7,000+ facilities globally for structured energy programs
What Is the ENERGY STAR Program for Food and Beverage Manufacturing
ENERGY STAR for Food and Beverage is the EPA's voluntary energy performance benchmarking and certification program for food manufacturing facilities. The program uses the Energy Performance Indicator (EPI) — a score from 1 to 100 that measures how your facility's energy intensity compares to similar plants in the national database. A score of 75 or above qualifies for ENERGY STAR certification, indicating your facility performs better than 75% of similar operations nationwide.
The EPI normalizes energy consumption for production volume, weather, and facility characteristics — giving a meaningful comparison across plants of different sizes and climates. Food manufacturing sub-sectors with established EPI tools include wet corn milling, fruit and vegetable processing, meat processing, poultry processing, dairy product manufacturing, and beverage plants. For sectors without a sub-sector-specific EPI, EPA provides a portfolio benchmarking approach through ENERGY STAR Portfolio Manager.
Beyond certification, ENERGY STAR participation requires a documented energy management program aligned with ISO 50001 principles: establishing a baseline, setting targets, implementing improvement projects, measuring results, and reporting progress. The accountability structure is what delivers the 10–25% savings — not the certification itself. Start a free trial to see how Oxmaint supports your ENERGY STAR program with asset-level energy tracking, or book a demo and we will walk through EPI scoring for your facility type.
Most facilities lose 15–30% of compressed air, steam, and refrigeration energy to untracked equipment degradation that a PM program would catch and correct.
8 Pillars of a High-Performance Food Plant Energy Program
01
Energy Performance Indicator (EPI)
The EPA's sector-specific score normalizing your kBtu per unit of production vs national peers. Your baseline score drives certification eligibility and identifies gap to industry best practice — typically 20–40% improvement opportunity.
02
ISO 50001 Energy Management
The Plan-Do-Check-Act framework for systematic energy management. Requires an energy policy, baseline, significant energy uses (SEUs), action plans, and management review. Accepted globally as the gold standard for food plant energy governance.
03
Scope 1, 2, and 3 Emissions
Scope 1: direct combustion in your plant. Scope 2: purchased electricity and steam. Scope 3: upstream ingredients and packaging, downstream distribution and use. Food manufacturers face increasing investor and retailer pressure to quantify and reduce all three.
04
Significant Energy Use (SEU) Tracking
ISO 50001 requires identifying the systems and equipment responsible for the majority of your energy consumption — refrigeration, compressed air, steam, HVAC, processing lines. Each SEU gets a performance baseline, target, and monitoring plan.
05
Utility Benchmarking and Sub-Metering
Plant-level utility bills tell you total cost — not where it goes. Sub-metering by system or production line reveals which assets consume disproportionately. Industry benchmarks for kWh/unit, BTU/lb, and gallons/unit give targets to pursue.
06
Water Intensity Benchmarking
Water is the second largest variable utility cost in food manufacturing after energy. Gallons per unit of production benchmarks vary significantly by sector — dairy averages 1.6 gal/lb, meat processing 2.0–4.5 gal/lb. Reduction targets require asset-level tracking.
07
Carbon Disclosure and CDP Reporting
Major food retailers and CPG companies now require suppliers to disclose scope 1 and 2 emissions via CDP. Manufacturing facilities must produce facility-level carbon inventories supported by energy consumption data — increasingly linked to supplier qualification decisions.
08
Net Zero and Decarbonization Roadmaps
Science-Based Targets (SBTi) for food manufacturers require demonstrating a credible pathway to net zero by 2050 aligned with 1.5°C scenarios. Facility-level decarbonization plans must show CapEx investment timelines — driven by asset condition and lifecycle data.
Why Energy Programs Stall in Food Plants — The 4 Operational Barriers
!
Energy Data Is Disconnected from Asset Records
Utility bills and sub-meter readings live in spreadsheets or energy management software that has no connection to the maintenance system. When a refrigeration compressor degrades and draws 18% more current than its design spec, the energy team sees the kWh number — but no maintenance work order is generated, and the condition never triggers a PM response.
!
PM Programs Do Not Target Energy Losses
Standard PM schedules are time-based — monthly, quarterly, annual — without reference to energy performance thresholds. Compressed air leaks, heat exchanger fouling, insulation failures, and refrigeration charge losses accumulate between PM intervals, each degrading energy efficiency invisibly until the next scheduled inspection.
!
Scope 3 Emissions Cannot Be Traced to Facility Operations
CDP and SBTi reporting require facility-level emissions data separated by scope. Most food plant EHS teams cannot produce a Scope 3 calculation from operational data because supplier inputs, packaging consumption, and transportation are tracked in procurement systems with no operational linkage to the plant floor.
!
CapEx for Energy Projects Has No Condition Baseline
Energy upgrade proposals — LED lighting, VFD installations, boiler replacement — compete with safety and compliance capital without condition-based justification. Without asset condition scores and lifecycle data, energy CapEx requests are approved or denied based on who presents most compellingly, not which investment delivers the highest return.
Facilities that connect energy data to their CMMS asset records identify 20–35% more efficiency opportunities per year — start a free trial to integrate your utility data with Oxmaint's asset management platform, or book a demo and see energy-linked PM scheduling on your own facility layout.
Facilities managing 10,000+ assets see measurable energy cost reductions within the first 30 days of structured CMMS-linked energy tracking.
How Oxmaint Powers Food Plant Energy and Sustainability Programs
Asset-Level Energy Performance Tracking
Every significant energy use — refrigeration compressors, air handlers, boilers, compressed air systems — registered in the asset registry with energy baselines, performance thresholds, and condition scores. Deviations trigger maintenance work orders.
PM Scheduling Linked to Energy KPIs
Preventive maintenance intervals configured to address energy-related degradation modes: heat exchanger cleaning, refrigerant leak checks, compressed air leak surveys, insulation inspection. PM completion rates tracked against energy performance outcomes.
ISO 50001 Action Plan Management
Energy improvement actions created as work orders with owners, due dates, and budget tracking. SEU performance dashboards show progress against baseline by system. Management review reports generated on demand for ISO certification audits.
Scope 1 and 2 Emissions Linked to Assets
Direct combustion equipment — boilers, generators, process heaters — registered with fuel type and consumption records. Purchased electricity linked to production output for scope 2 intensity calculations. CDP-ready emissions reports exportable by facility.
CapEx Forecasting for Energy Upgrades
Rolling 5–10yr capital models that prioritize energy upgrade investments by asset condition score, energy intensity, and remaining useful life. Investor-grade CapEx reports that show the ROI of boiler replacement, VFD upgrades, or LED conversions against current energy cost baseline.
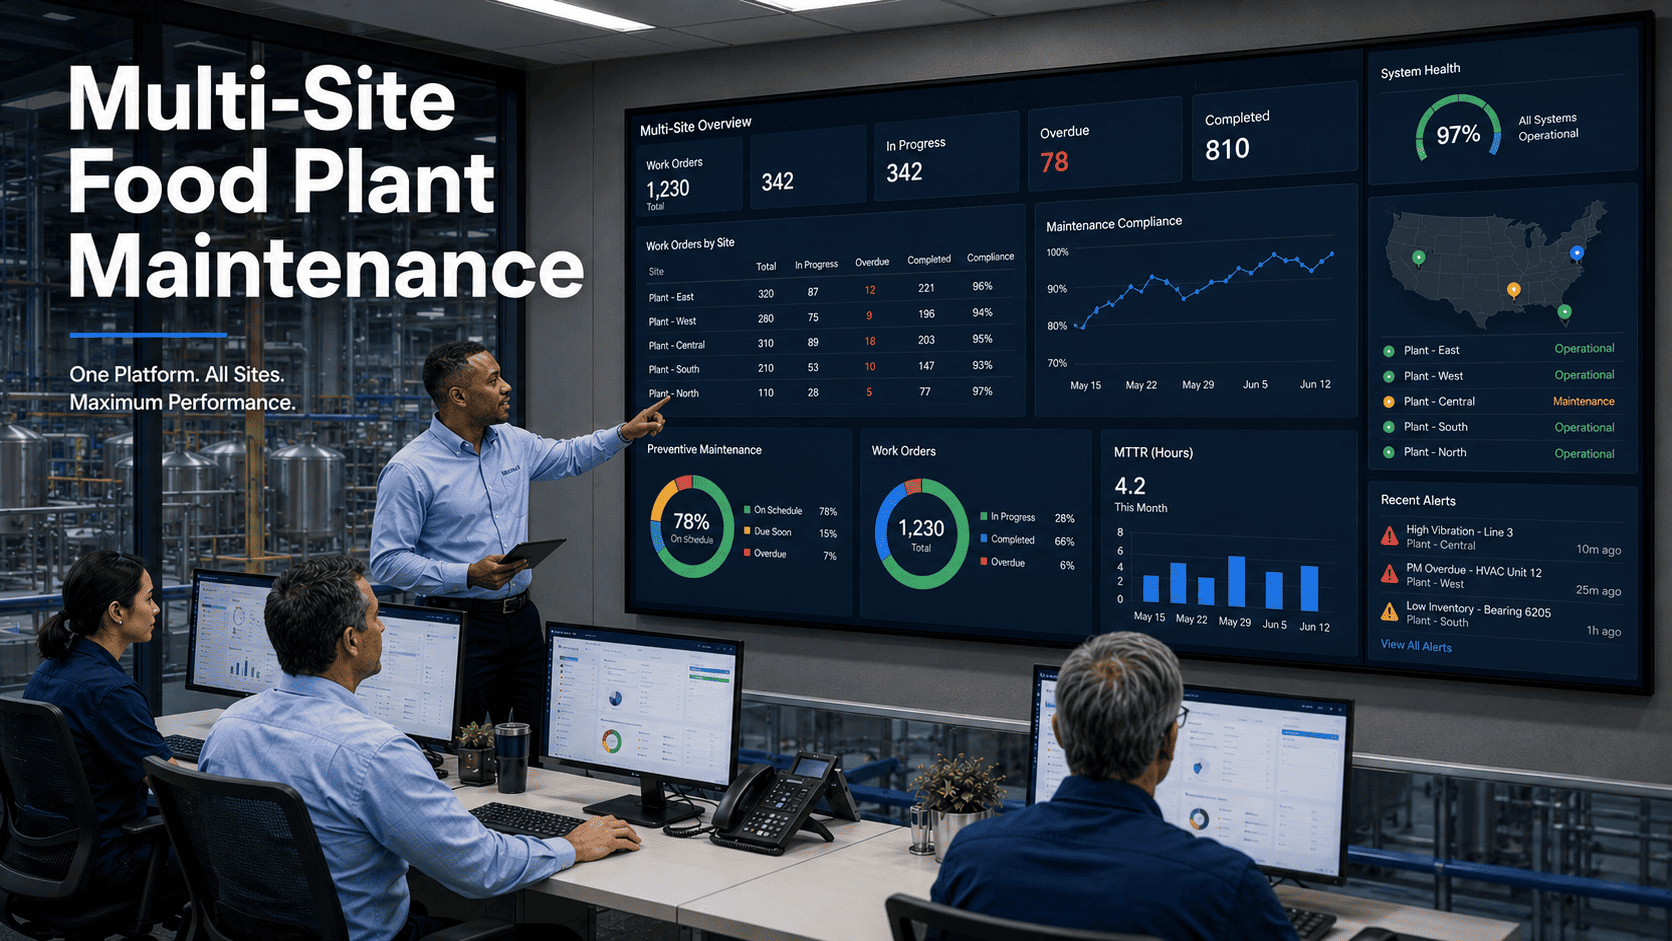
Multi-Site Energy Portfolio Reporting
Portfolio-level energy intensity benchmarking across all facilities — kWh per unit, BTU per lb, gallons per unit — normalized for production volume. Identify highest-opportunity sites for corporate sustainability investment prioritization.
Before vs After: Reactive Energy Tracking vs Oxmaint-Connected Energy Management
Energy Program ROI — Results From Structured CMMS-Linked Energy Management
25%
Energy Cost Reduction
ENERGY STAR certified plants vs industry average, EPA verified
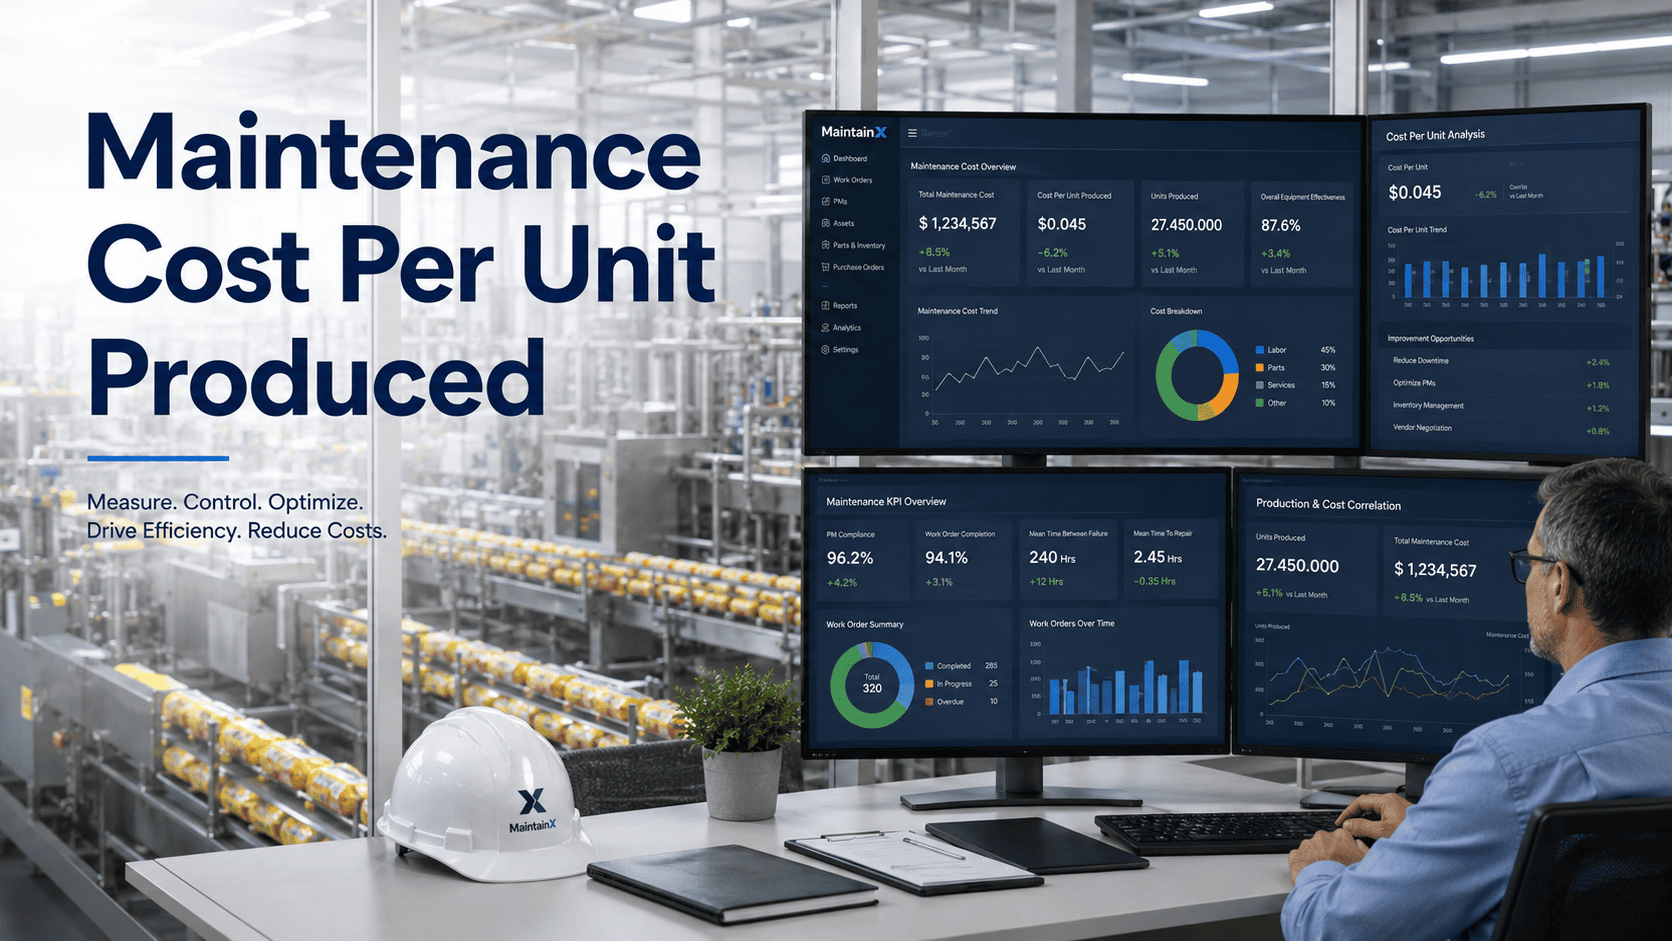
$0.85/unit
Average Energy Savings Per Unit Produced
Food processing facilities implementing structured SEU programs
18 months
Average ROI Payback Period
For PM-driven energy loss elimination programs, no capital equipment required
40%
Reduction in Compressed Air Energy Waste
From structured leak detection and repair PM programs vs reactive maintenance
Plant managers connecting energy data to CMMS asset records identify the highest-impact improvement opportunities within the first month — start a free trial to map your significant energy uses to Oxmaint asset records today, or book a demo and see energy intensity benchmarking on your production data.
Frequently Asked Questions — Food Plant Energy Programs and CMMS
Which food manufacturing sectors have ENERGY STAR EPI tools available from EPA?
EPA has published Energy Performance Indicator tools for wet corn milling, fruit and vegetable processing, meat and poultry processing, dairy product manufacturing, grain and oilseed milling, beverage manufacturing, and bakery product manufacturing. Each tool uses sector-specific production variables to normalize energy consumption for meaningful peer comparison. For sectors without a specific EPI tool, EPA's ENERGY STAR Portfolio Manager provides facility-level benchmarking using a general manufacturing approach. Oxmaint tracks energy consumption data in formats compatible with EPI tool inputs for streamlined annual score submission.
What is the relationship between ISO 50001 and ENERGY STAR certification for food plants?
ISO 50001 is the international standard for energy management systems — it defines the program structure, documentation requirements, and management system elements. ENERGY STAR certification for facilities is an EPA performance recognition awarded to plants scoring 75 or above on the sector EPI. The two are complementary: ISO 50001 provides the management framework to systematically improve energy performance, while ENERGY STAR certification validates the outcome of that program relative to industry peers. Many food plants pursue ISO 50001 as the internal management discipline and use ENERGY STAR EPI scoring as the external benchmark target.
How does maintenance management affect a food plant's scope 1 and 2 emissions profile?
Maintenance directly drives a significant portion of both scope 1 and scope 2 emissions in food manufacturing. On the scope 1 side: refrigerant leaks from ammonia or HFC systems are high-global-warming-potential direct emissions that a proactive PM program detects and eliminates. Boiler inefficiency from scale buildup, air-fuel ratio drift, and heat loss increases natural gas combustion per unit of steam output. On the scope 2 side: compressed air leaks, heat exchanger fouling, motor degradation, and VFD failures all increase purchased electricity consumption per unit produced. A CMMS that tracks these degradation modes and schedules corrective PM systematically reduces both emission categories without capital investment.
How does Oxmaint support multi-site energy and sustainability portfolio reporting?
Oxmaint's portfolio hierarchy — Portfolio, Property, System, Asset — allows sustainability teams to aggregate energy and emissions data across all facilities in a single view. Each site maintains its own asset-level energy records, PM completion data, and utility consumption entries. The portfolio dashboard normalizes by production volume to show energy intensity by facility, enabling direct comparison and identification of highest-opportunity sites. For corporate CDP or ESG reporting, Oxmaint exports facility-level scope 1 and 2 data in standard formats. Multi-site capital planning for energy upgrades is supported through the rolling CapEx forecasting module, allowing sustainability investment to be prioritized by condition-score and energy intensity across the entire portfolio.
OxMaint — Food Plant Energy and Sustainability Platform
Stop Paying for Energy Your Equipment Is Wasting
Connect your utility data to your asset records in Oxmaint and turn energy degradation into scheduled maintenance — before it becomes wasted cost on next month's bill.
- Asset-level energy performance tracking linked to PM scheduling
- Live EPI and sustainability KPI dashboards for ENERGY STAR programs
- 5–10 year CapEx roadmap for energy upgrade prioritization
No heavy implementation required. Live in days, not months. Works across multi-site portfolios.