Predictive Quality Analytics in Food and Beverage Production
By Drake Dsouza on February 25, 2026
Food and beverage production operates under zero-defect tolerance. A single contaminated batch can trigger recalls affecting millions of units. Manual quality inspection—still the standard at most facilities—creates systematic vulnerabilities. Human inspectors fatigue after 90 minutes of continuous visual inspection. Accuracy drops 15-20% during second and third shifts. Subtle defects like hairline cracks, color variations within acceptable ranges, and microscopic contamination go undetected. The average food manufacturer catches defects too late: after packaging, sometimes after distribution. Book a demo to see how Oxmaint's integrated quality analytics detect anomalies in real-time throughout production.
30%
Defect reduction with AI visual inspection
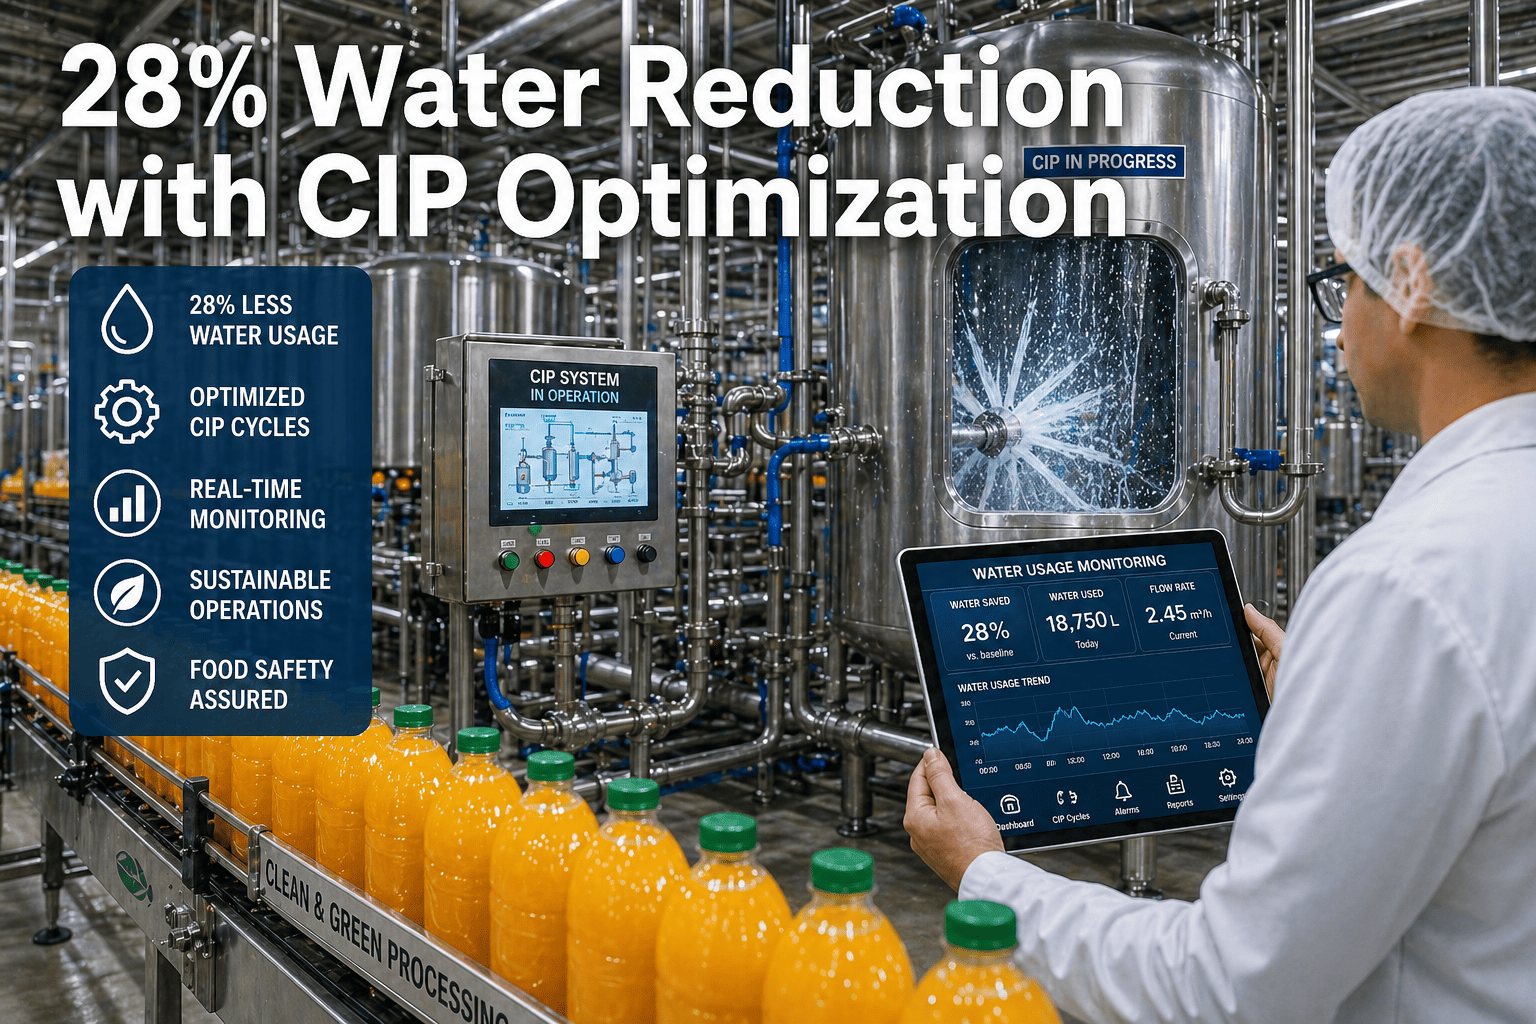
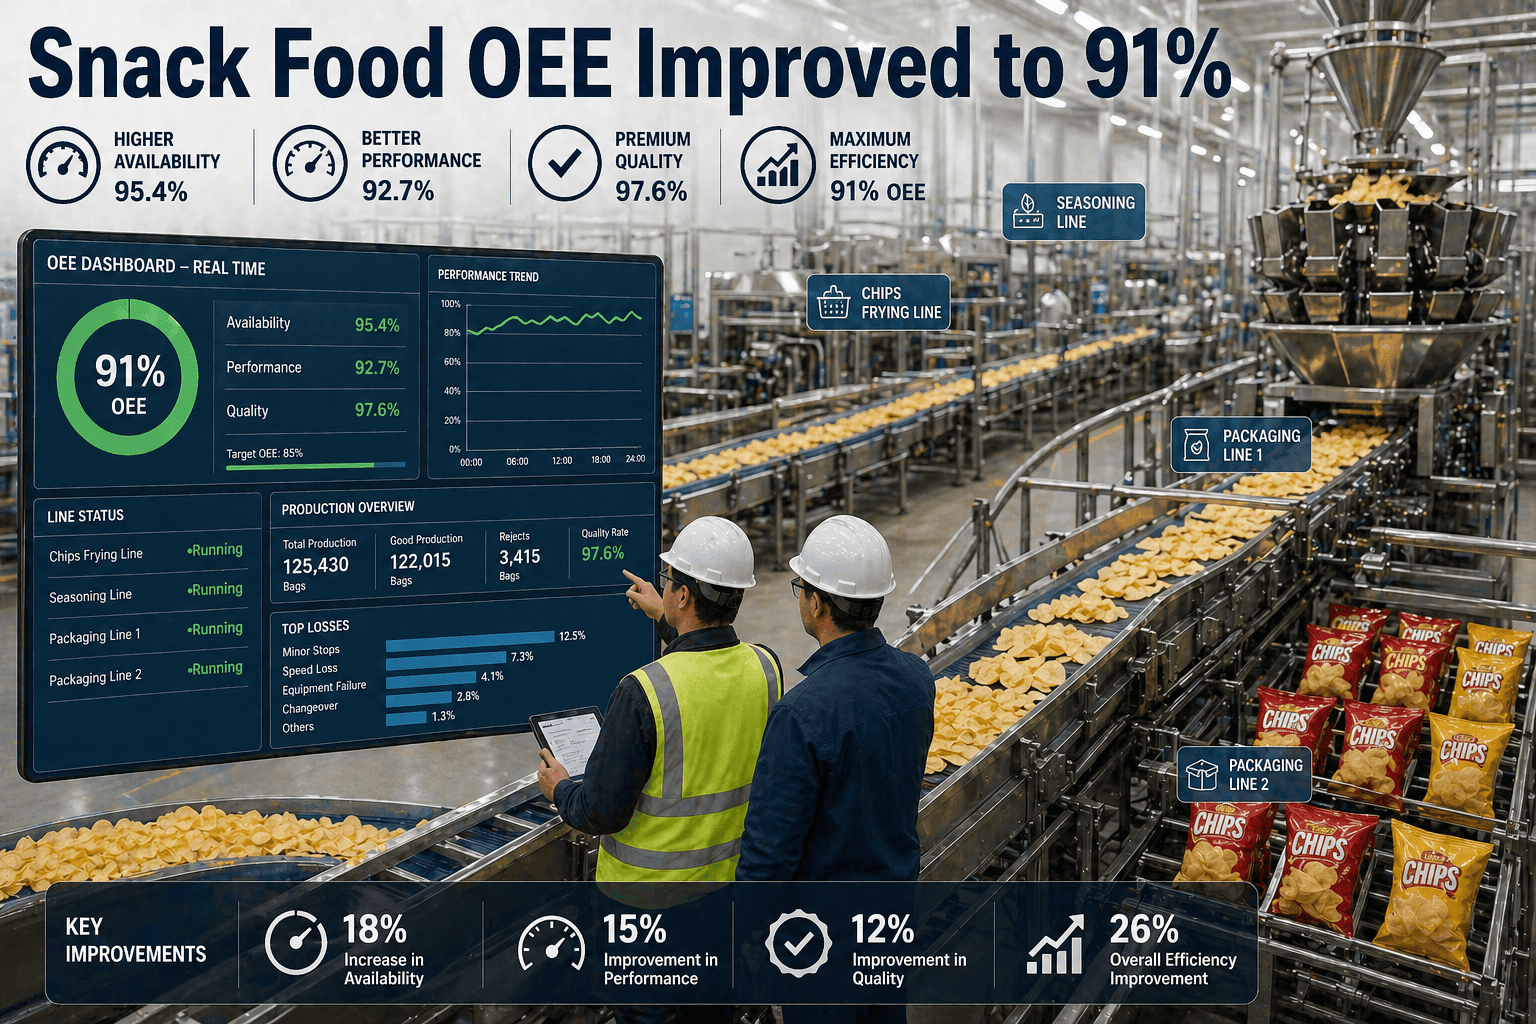
Beverage producers report 30% fewer defects reaching consumers after implementing computer vision systems. First-pass yield improves from 94% to 98% within six months.
$2.8M
Average cost per product recall
Direct recall costs include product retrieval, disposal, and replacement. Indirect costs—brand damage, customer loss, regulatory scrutiny—multiply total impact by 3-5x.
50%
Waste reduction through predictive analytics
AI systems predict quality issues before they occur, enabling process adjustments that prevent entire batches from becoming scrap. Rework costs drop 40-50%.
6-12 mo
Typical ROI timeframe for quality analytics
Food manufacturers recoup quality analytics investment within 6-12 months through reduced waste, fewer recalls, and higher production yield. 89% achieve full payback within first year.
How Predictive Quality Analytics Actually Works
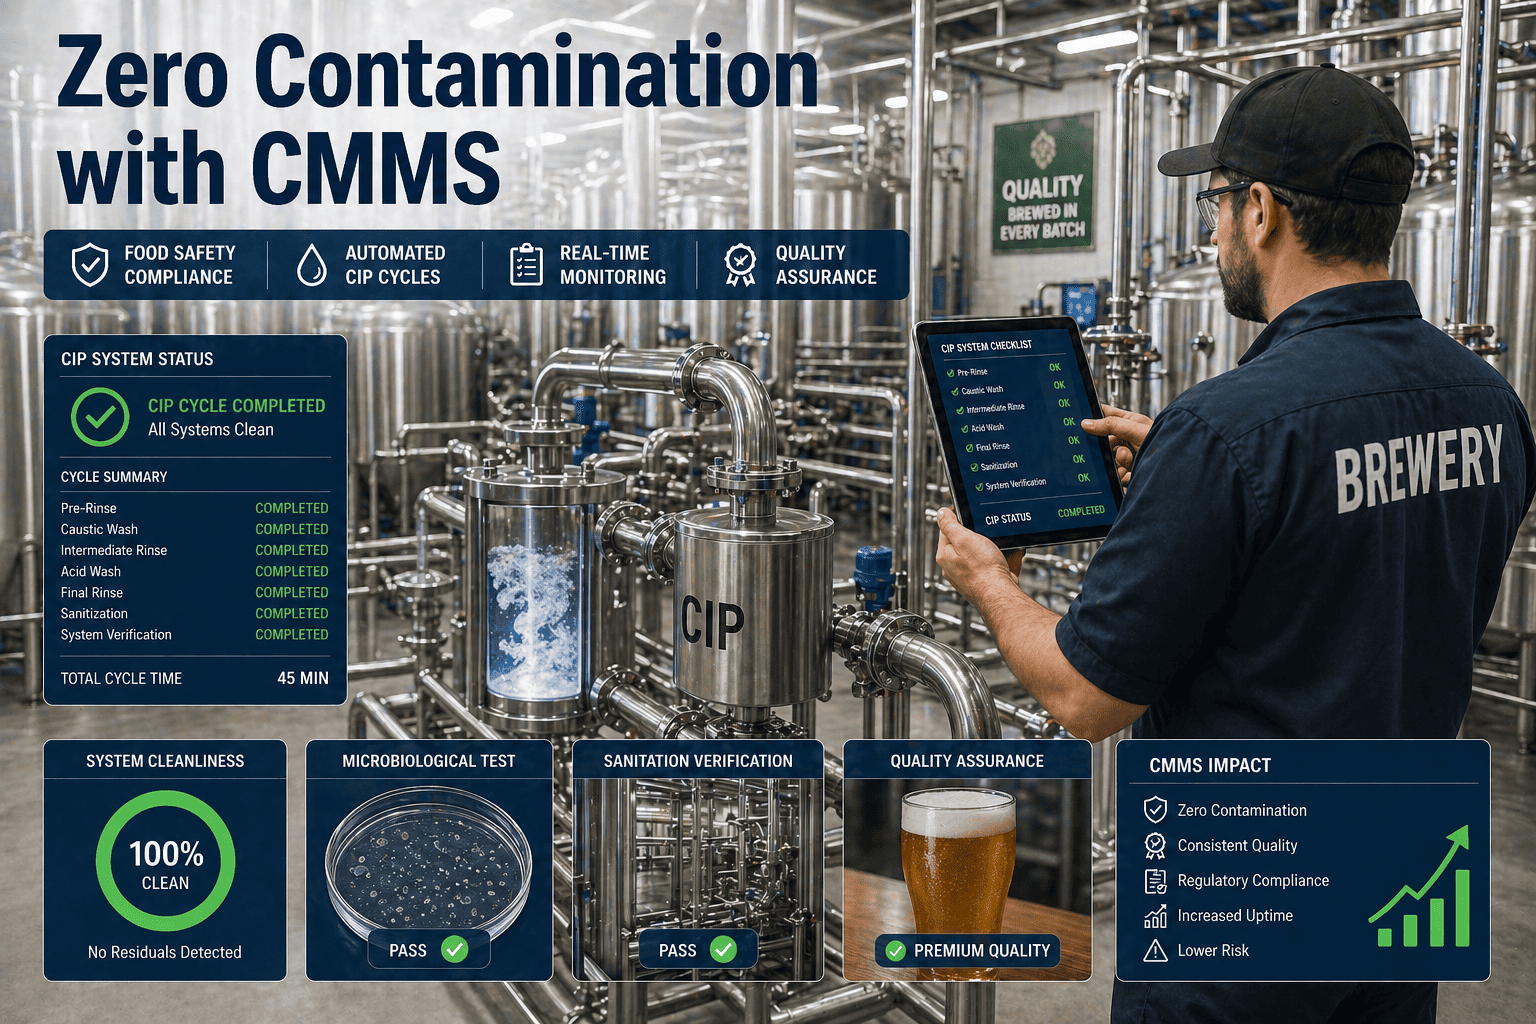
Traditional quality control operates on inspection and rejection: check finished products, discard defects. Predictive quality analytics operates on early detection and prevention: monitor process variables in real-time, predict quality outcomes before defects form, adjust parameters automatically. The system combines computer vision for visual defects, sensor data for process variables, and machine learning models that recognize patterns invisible to human observation. A brewery using predictive analytics can detect fermentation temperature drift 0.2 degrees before it affects flavor consistency. A bakery can identify oven temperature variation patterns that will produce uneven browning four batches ahead.
1
Data Collection
High-resolution cameras (10-50 megapixels)
Temperature sensors (±0.1°C accuracy)
Pressure monitors on processing lines
Flow rate measurements
Viscosity and pH sensors
Weight scales (±0.01g precision)
→
2
Pattern Recognition
Neural networks analyze 1000+ images/minute
Machine learning identifies correlations
Baseline models for normal operation
Anomaly detection algorithms
Historical comparison (6-12 months data)
Real-time statistical process control
→
3
Predictive Action
Defect alerts before batch completion
Automatic parameter adjustments
Quality trend forecasting
Equipment maintenance triggers
Supplier quality warnings
Production schedule optimization
Detection Capabilities by Product Category
Meat & Poultry
95% accuracy
Foreign objects, bone fragments, fat distribution, color consistency
Baked Goods
97% accuracy
Shape irregularities, burn patterns, air pockets, texture variations
Beverages
98% accuracy
Fill levels, cap defects, label placement, liquid clarity
Seal integrity, weight verification, label accuracy, contamination
Confectionery
92% accuracy
Shape defects, coating thickness, color matching, size consistency
Real Production Impact: Data from Implementing Facilities
The AI in food and beverage market will reach $67.73 billion by 2030, driven primarily by quality control applications. Manufacturers implementing predictive quality analytics report measurable improvements across multiple operational dimensions. These aren't projections—they're documented results from facilities that deployed AI visual inspection and predictive monitoring systems.
■
Defect Reduction
First-pass yield increase
94% → 98%
Within 6 months
Defect escape rate
2.7% → 0.4%
Electronics display manufacturer
Product recalls avoided
78% reduction
Prepared foods company, first year
■
Cost Savings
Production cost reduction
25% decrease
Through waste reduction
Food waste reduction
30-40% drop
AI demand forecasting
Rework costs
40-50% lower
Early defect detection
■
Operational Efficiency
Inspection speed increase
30% faster
1000+ items per minute
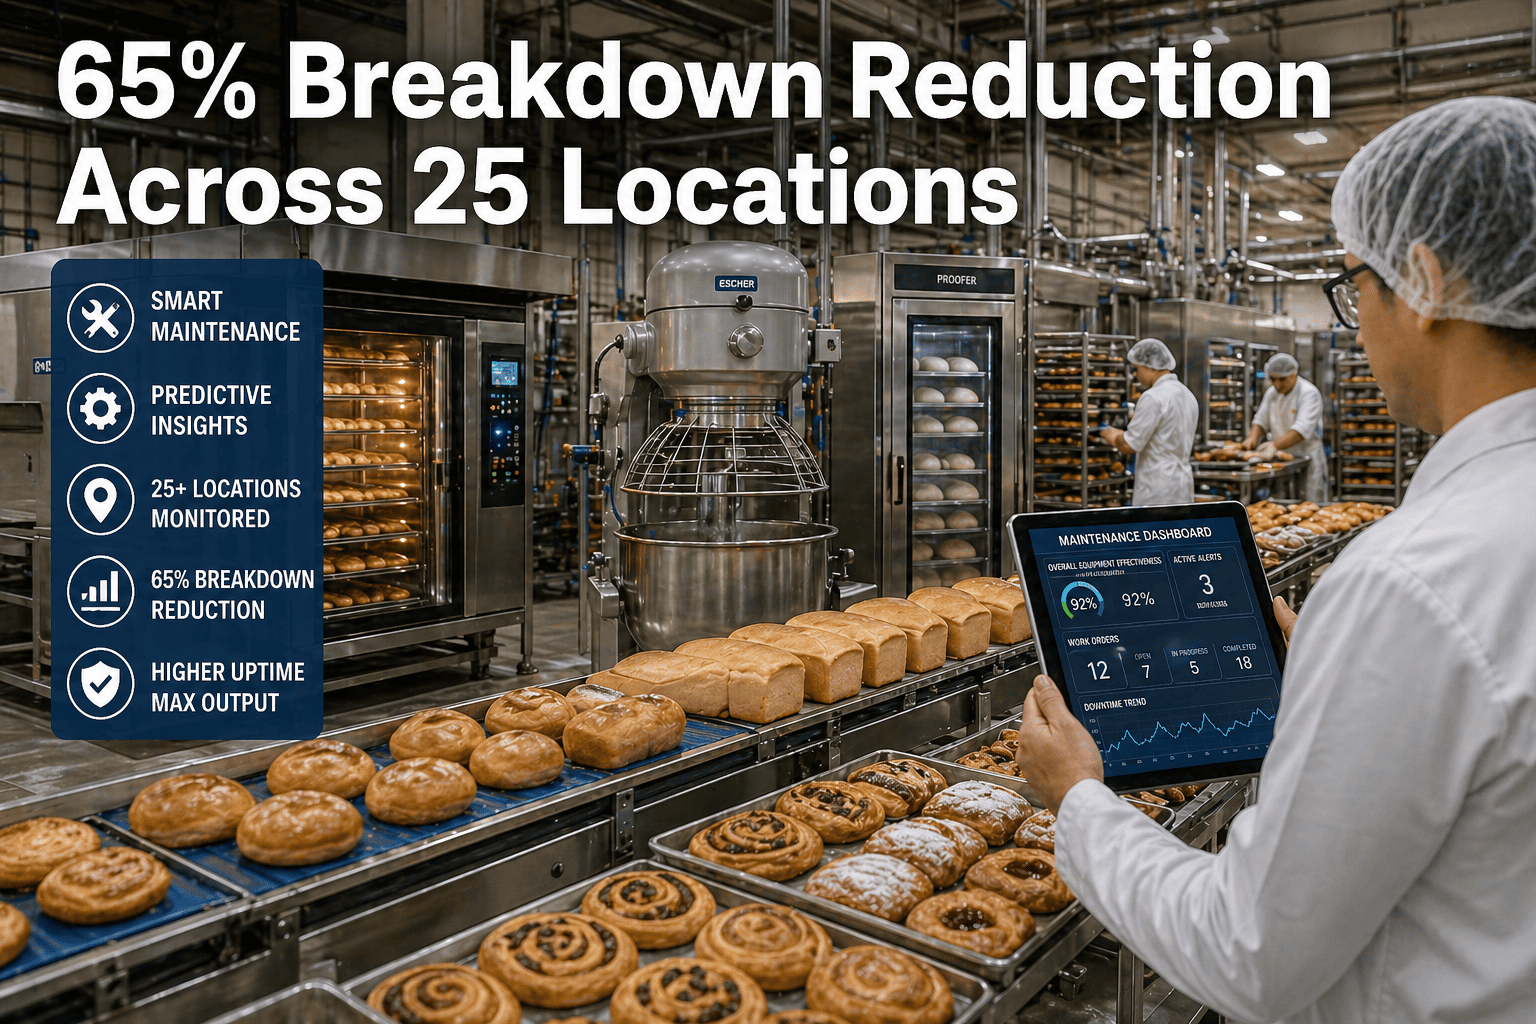
Equipment effectiveness (OEE)
8-12% improvement
Predictive maintenance
Labor reallocation
15-20% capacity
From inspection to value-add tasks
6-12 months
Average time to full ROI on quality analytics investment
89% of food manufacturers recoup their entire analytics investment within the first year through reduced waste, fewer recalls, and improved yield. A mid-size facility saving $50,000 monthly in waste reduction alone achieves payback in 8-10 months on a $400,000 system.
Beyond Defect Detection: Predictive Prevention
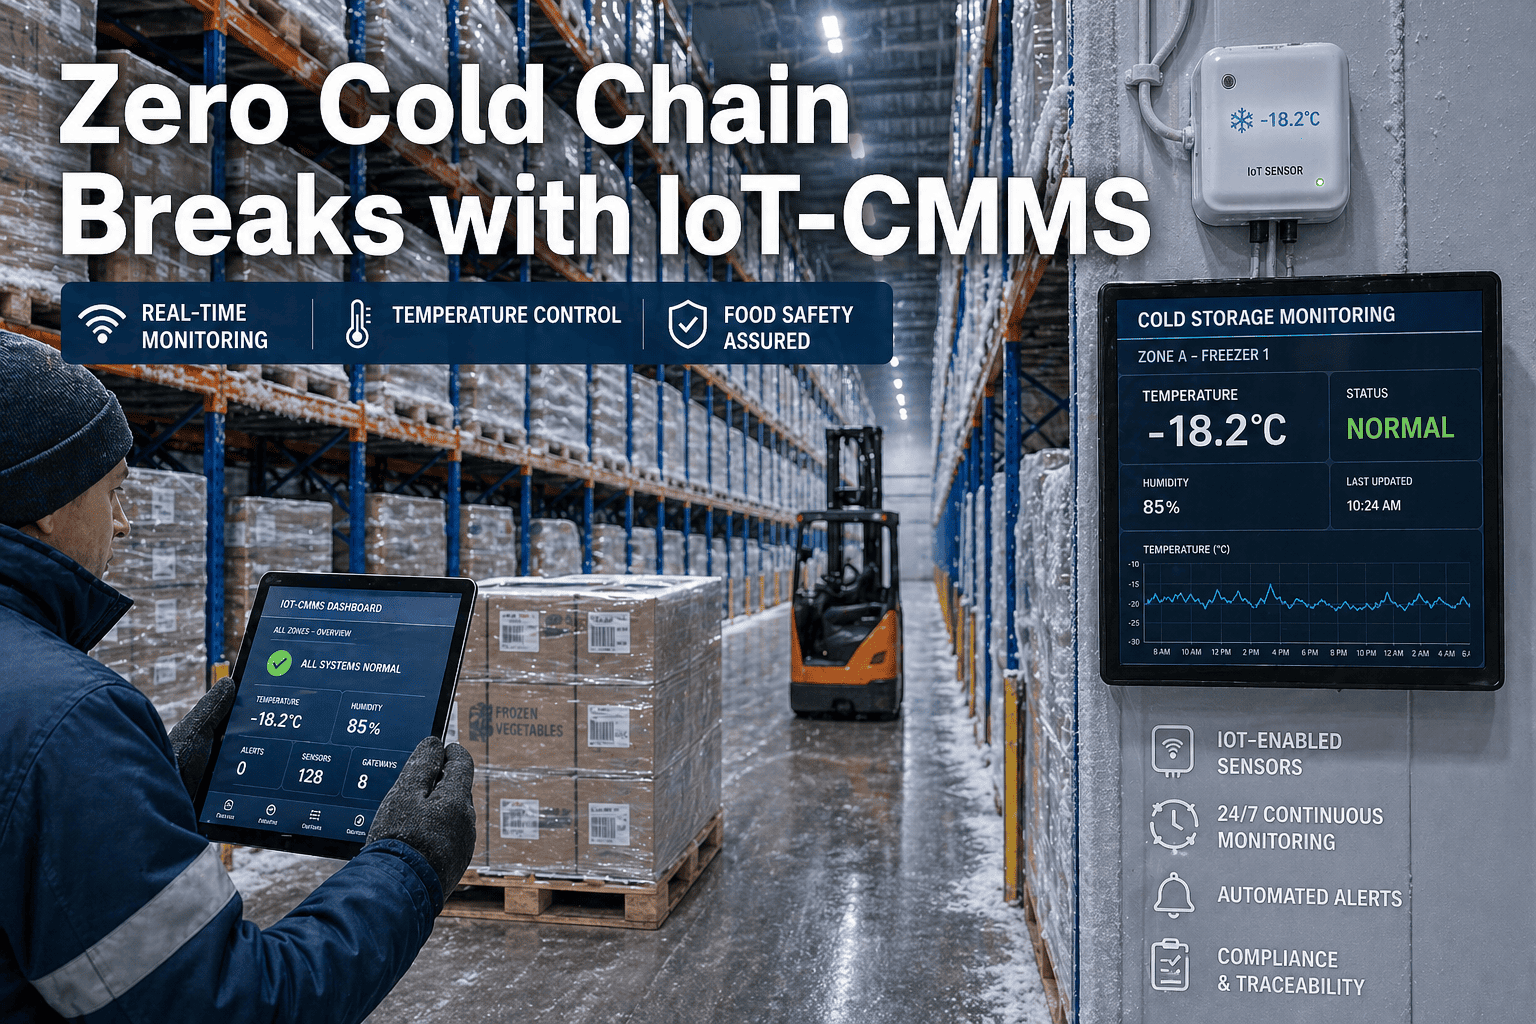
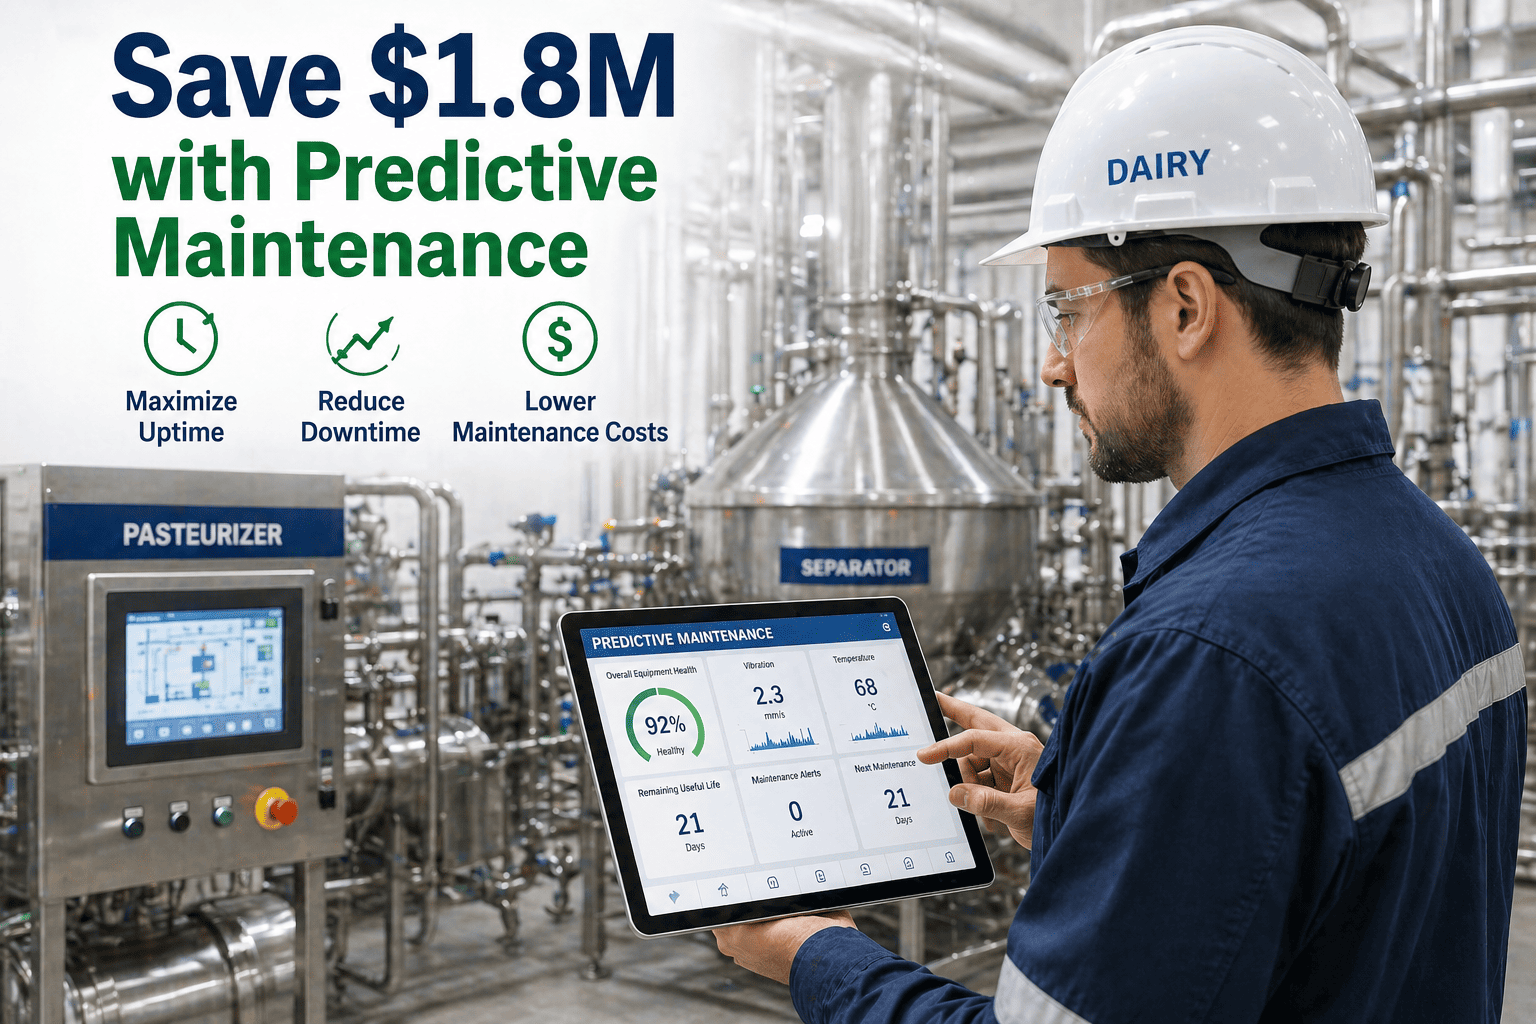
The most advanced quality analytics systems don't just find defects—they prevent them. By analyzing patterns in process variables, environmental conditions, and ingredient characteristics, AI models predict quality outcomes hours before production. A dairy processor knows at 6 AM that afternoon batches will have consistency issues if current milk temperature trajectories continue. Process adjustments happen before problems form, not after discovering them in finished product.
Process Drift Detection
Temperature Variance Pattern
Hour 1: Normal
Hour 2: Slight drift
Hour 3: Alert threshold
Hour 4: Auto-adjustment
AI detects gradual parameter drift 3-4 hours before quality impact. Oven temperature varying +/- 0.5°C triggers predictive alerts. Automated correction prevents 40-60 defective batches per month.
Sensor data identifies equipment degradation patterns. Conveyor motor bearing wear detected 8-10 days before failure. Preventive replacement during scheduled downtime prevents emergency stoppage and contamination risk.
Implementation: From Manual to AI-Powered Quality
Deploying predictive quality analytics doesn't require replacing entire production lines. Modern systems integrate with existing equipment through retrofitted sensors and cameras. A typical bakery implementation takes 4-6 weeks from assessment to full operation. The process follows a structured approach: baseline current quality metrics, install monitoring hardware at critical points, train AI models on facility-specific products and defects, validate accuracy against manual inspection, then transition to full automation with human oversight.
▶
Phase 1: Assessment
Week 1-2
Document current quality control processes and pain points
Identify critical inspection points on production lines
Collect baseline defect rates and types across shifts
Evaluate existing sensor infrastructure and data systems
Calculate current quality costs (waste, rework, recalls)
▶
Phase 2: Installation
Week 3-4
Install high-resolution cameras at inspection stations
Deploy process sensors (temperature, pressure, flow)
Integrate with existing SCADA or control systems
Configure data collection and storage infrastructure
Set up operator interfaces and alert systems
▶
Phase 3: Training
Week 5-6
Capture thousands of images of good and defective products
Label defect types and quality characteristics
Train neural networks on facility-specific products
Validate model accuracy against manual inspection
Fine-tune detection thresholds to minimize false positives
▶
Phase 4: Optimization
Week 7-12
Run parallel operations (AI + manual verification)
Collect performance data on detection accuracy
Adjust models based on production variations
Train operators on AI system oversight and intervention
Transition to fully automated inspection with spot checks
AI QUALITY MONITORING
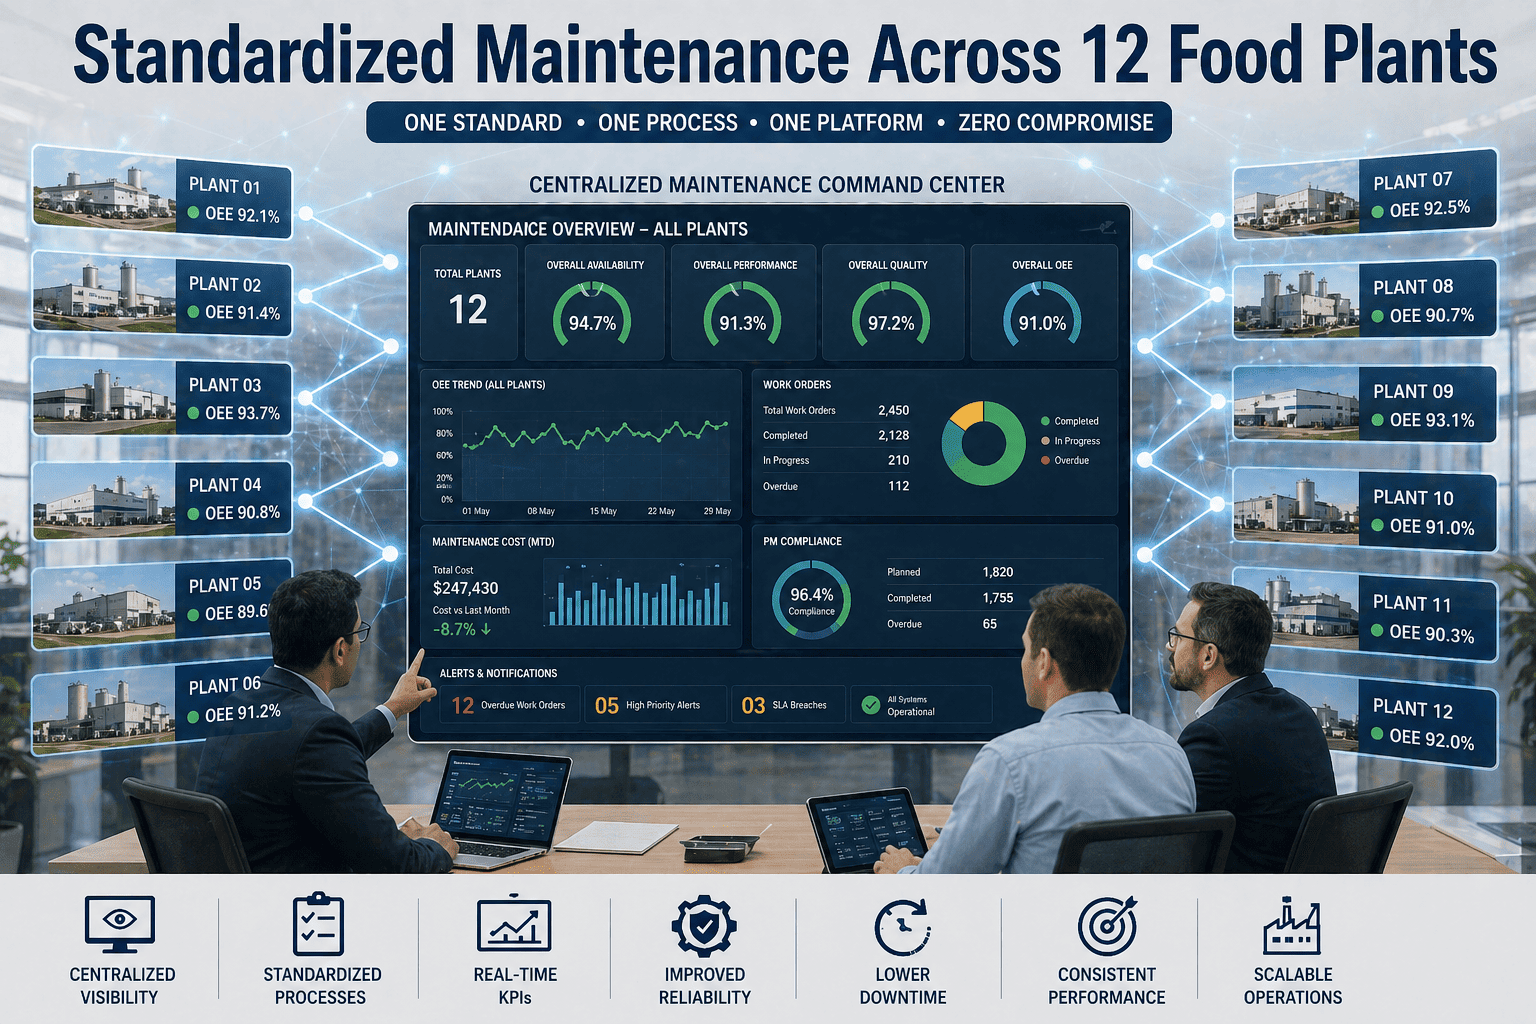
Integrate Predictive Quality Into Your CMMS
Oxmaint connects AI quality analytics with your maintenance workflows. When vision systems detect recurring defects, the platform automatically creates work orders, tracks equipment performance correlations, and schedules preventive maintenance. Quality data flows directly into production dashboards, giving managers real-time visibility into defect trends, yield performance, and process health.
The Market Reality: AI Quality Control Becoming Standard
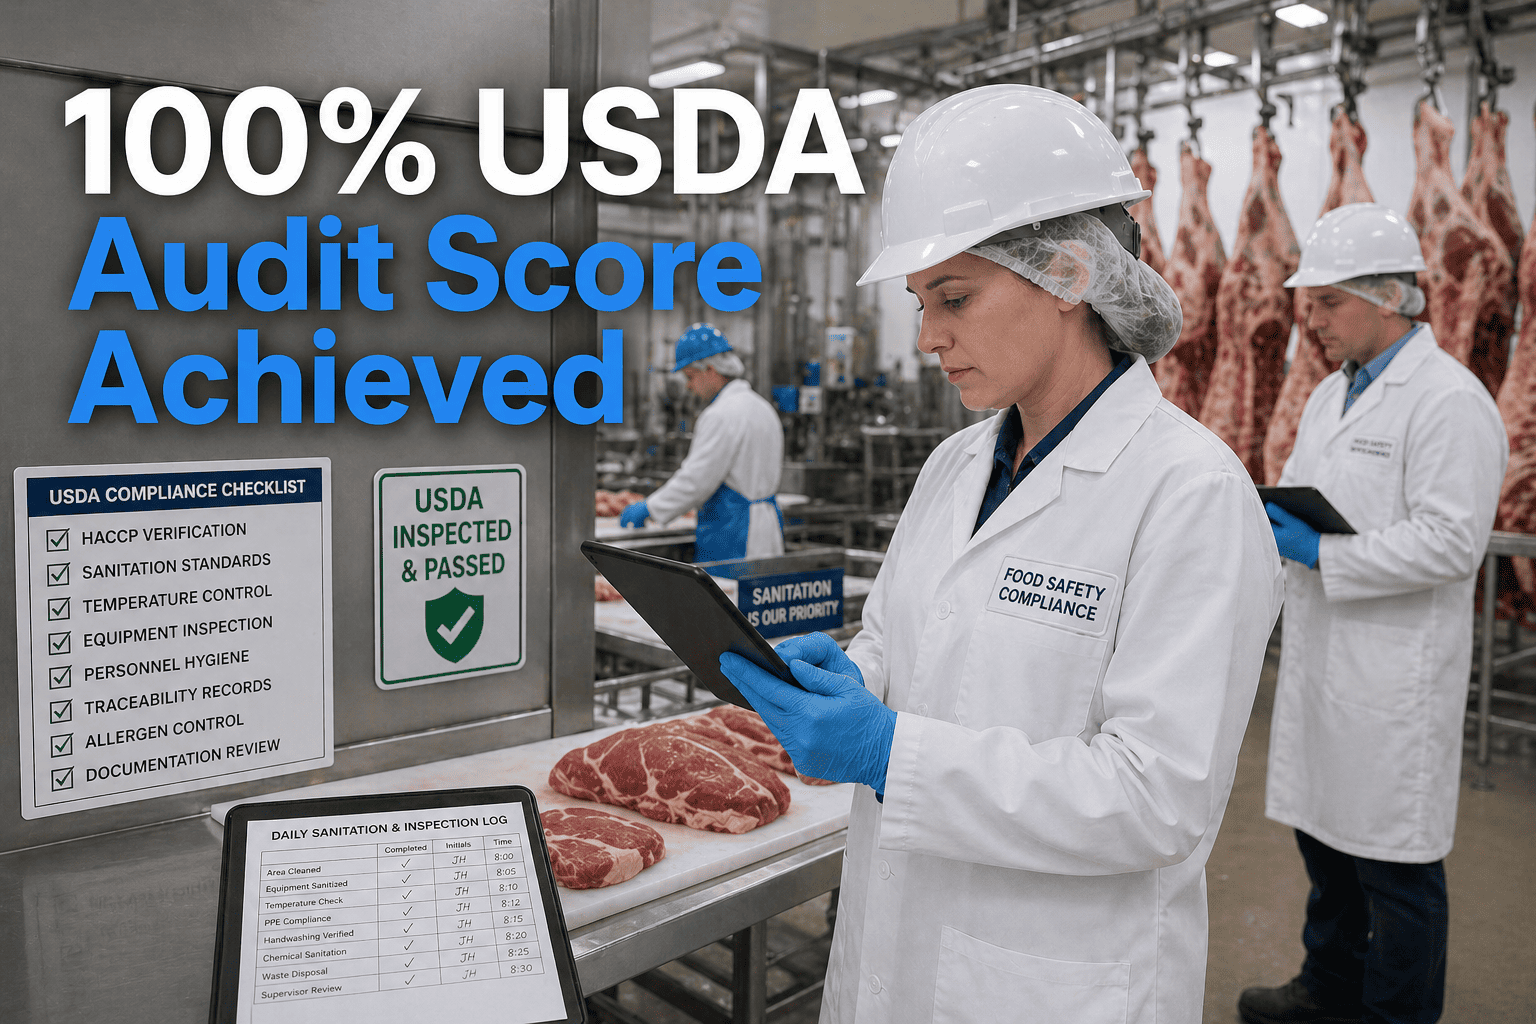
The AI in food and beverages market was valued at $13.39 billion in 2025 and will reach $67.73 billion by 2030—a 38.3% annual growth rate. This isn't speculative technology adoption. Major manufacturers including Nestlé, PepsiCo, and Kraft Heinz have deployed AI quality systems at scale. Quality control and safety applications account for 46% of AI implementation in food production. Retailers increasingly require supplier quality certifications that manual inspection cannot reliably provide. FDA traceability regulations extending to 2028 push manufacturers toward digital quality documentation that AI systems generate automatically.
Regulatory Compliance
85% importance
FDA FSMA 204 traceability requirements demand detailed quality documentation that AI systems generate automatically
Labor Shortage
78% importance
Difficulty finding and retaining skilled quality inspectors accelerates automation adoption
Cost Pressure
92% importance
Waste reduction and recall prevention deliver immediate ROI that justifies AI investment
Consumer Expectations
88% importance
Zero-defect tolerance from retailers and consumers requires precision beyond manual capability
Competitive Advantage
81% importance
Early AI adopters gain market share through superior quality consistency and faster innovation cycles
PREDICTIVE QUALITY ANALYTICS
Detect Defects Before They Become Recalls
Oxmaint's AI quality monitoring integrates seamlessly with your production systems. Computer vision analyzes products in real-time, detecting microscopic defects invisible to manual inspection. Predictive analytics forecast quality issues before they occur, enabling process adjustments that prevent entire batches from failing. Automated work orders trigger when equipment patterns indicate degradation. All quality data centralizes in your CMMS for complete traceability and compliance documentation.