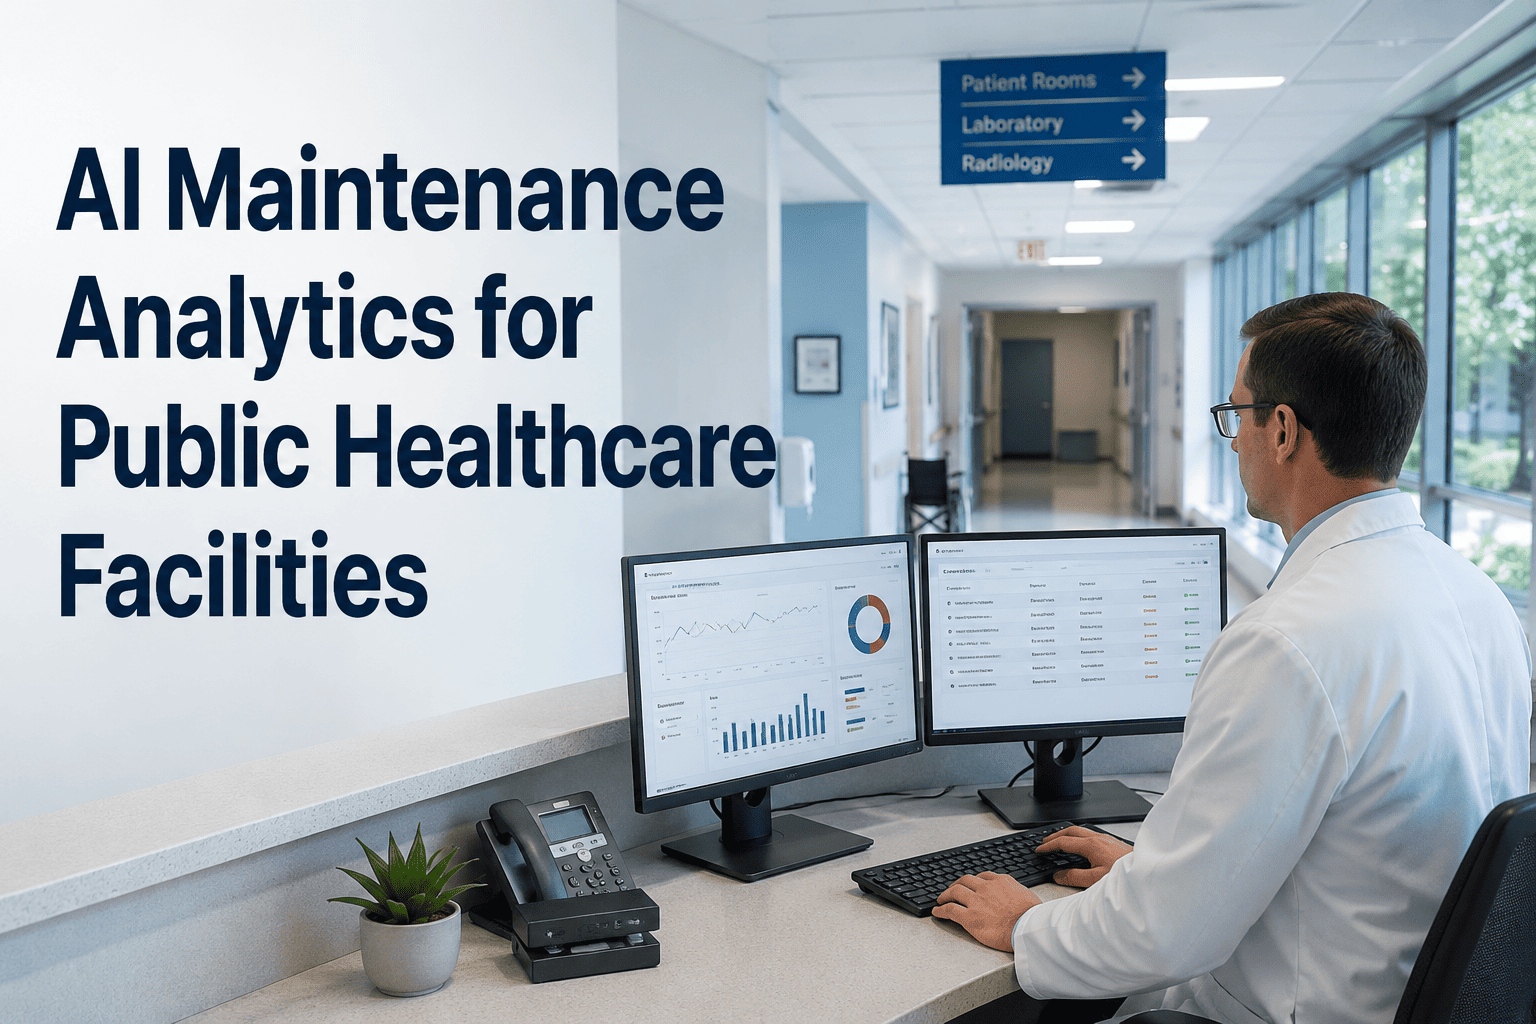
The average public hospital manages 35,000 medical devices across 500+ categories — each requiring specific maintenance schedules, documentation standards, and compliance tracking under Joint Commission, CMS, and state regulatory requirements. Healthcare facilities implementing modern CMMS achieved 98%+ regulatory compliance, 45% reduction in equipment downtime, and 30% cut in maintenance costs through AI-powered workflows in 2025. AI predictive maintenance identifies 90–95% of HVAC system issues 45–90 days before failure affects patient care and prevents 85% of medical equipment failures that could compromise treatments and emergency response. In a public healthcare facility — a VA hospital, a county health system, a public mental health facility — these numbers are not operational metrics. They are patient safety outcomes. A surgical suite HVAC failure is not a facility management inconvenience; it is a potential cancellation cascade affecting scheduled procedures. An untracked sterilisation equipment PM gap is not a documentation lapse; it is a Joint Commission citation risk and a patient infection control exposure. Book a demo to see OxMaint's AI Analytics and Reporting for public healthcare facility management — or start free today.
Article · AI Analytics & Reporting · Public Healthcare Facilities · P1 Critical
AI Maintenance Analytics for Public Healthcare Facilities
How OxMaint Analytics transforms work order data, asset condition trends, compliance status, and predictive signals into the operational intelligence that public healthcare facility managers need to protect patient safety, pass accreditation surveys, and defend capital budgets.
90–95%
Of HVAC system issues detected by AI 45–90 days before failure
85%
Of medical equipment failures prevented with real-time predictive monitoring
45%
Downtime reduction — healthcare facilities with CMMS vs reactive maintenance
60%
Reduction in unplanned MRI downtime with AI condition monitoring
The 6 Analytics That Public Healthcare Facility Managers Need
Most healthcare CMMS platforms track work orders. OxMaint Analytics converts work order data into the six decision-support outputs that facility managers in public healthcare actually need to manage operations, pass accreditation surveys, and make defensible capital decisions.
PM Compliance Rate by Asset Class
Real-time percentage of preventive maintenance completed on schedule, broken down by asset class — medical gas systems, surgical HVAC, sterilisation equipment, electrical systems, and biomedical devices. The Joint Commission and CMS review PM compliance rates by asset class during surveys. A rate below 95% in any critical asset category is an immediate finding risk. OxMaint Analytics surfaces the current rate and the specific work orders creating the gap — in real time, not at survey.
Used for: Joint Commission survey preparation · CMS certification maintenance documentation · Monthly operations reporting
Mean Time to Repair by Priority Level
MTTR broken down by P1 (patient safety critical), P2 (patient care impact), P3 (operational), and P4 (routine). In a public hospital, P1 MTTR is a patient safety KPI. A P1 HVAC failure in a surgical suite with an 8-hour MTTR is an adverse event risk. OxMaint Analytics tracks MTTR trend per priority level per department — identifying whether response performance is improving, stable, or degrading before a real-time event makes the gap visible.
Used for: Patient safety committee reporting · Staffing and contractor capacity planning · Board-level facility risk reporting
Regulatory Compliance Status Dashboard
A real-time compliance status view per regulatory standard — Joint Commission EC.02.05 (utilities), EC.02.06 (equipment), EC.04.01 (environment of care), CMS Conditions of Participation. Each standard shows: compliant / at-risk / non-compliant, the specific work orders creating any gap, and the number of days until the next survey or audit window. This is the report that replaces weeks of manual evidence assembly before a Joint Commission survey.
Used for: Pre-survey preparation · Continuous compliance monitoring · Risk management and legal exposure reporting
Equipment Failure Prediction Score
AI-generated failure probability score per critical asset, updated continuously from work order history, age, condition scores, sensor data, and PM compliance rate. Assets with a rising failure probability score are surfaced to the planner before they become unplanned breakdowns. In a public hospital managing budget constraints, predictive intervention is the mechanism that converts emergency repair spend into planned repair spend — typically at 25–40% lower cost.
Used for: Daily planner queue prioritisation · Monthly capital planning reviews · Contractor dispatch optimisation
Maintenance Cost per Department per Asset Class
Total maintenance spend broken down by department, floor, building, and asset class — with trend comparison against the prior 12 months. For public healthcare facilities under budget pressure, this is the analysis that identifies which assets are consuming disproportionate maintenance resources, which departments have the highest cost-per-sq-ft maintenance burden, and where replacement investment would reduce ongoing spend below the current repair cost trajectory.
Used for: Annual capital budget preparation · Department cost allocation · Equipment replacement ROI calculation
Reactive vs Planned Work Ratio Trend
The reactive-to-planned work ratio is the single most diagnostic metric in healthcare facility maintenance. World-class: <10% reactive. The public sector average is typically 30–40% reactive, meaning nearly a third of all maintenance effort is unscheduled emergency work consuming resources at 3–5× the cost of planned work. OxMaint Analytics tracks this ratio monthly and shows whether the PM programme is reducing or increasing the reactive burden — the trend that determines whether maintenance spend is under control.
Used for: Management reporting · PM programme effectiveness measurement · Workforce planning and overtime tracking
Every Metric Above Is Available in OxMaint Analytics — Without Custom Reports or Manual Data Assembly.
OxMaint Analytics generates all six of these outputs from your work order and asset data, updated in real time, accessible on mobile, and exportable for Joint Commission, CMS, and board-level reporting — so your facility team spends time on maintenance, not on building reports about maintenance.
AI Prediction in Public Healthcare — What the Models Actually Detect
Surgical Suite HVAC
AI monitors: supply air temperature deviation, differential pressure across HEPA filters, air change rate measurement, supply fan amperage draw
Detection window: 45–90 days before failure affecting pressure cascade or air change compliance
Patient impact: A surgical suite HVAC failure requires immediate procedure cancellation and cannot be restored without verified air change rate compliance — typically 4–8 hours minimum downtime with emergency service; 24–48 hours if filter replacement is required
Critical
Medical Gas Systems
AI monitors: pressure trend per zone, compressor run time and cycle frequency, alarm activation frequency, dew point in supply lines
Detection window: 2–4 weeks before zone pressure loss or compressor failure
Patient impact: Medical gas failure in an ICU, OR, or recovery unit is an immediate patient safety event — NFPA 99 Chapter 5 mandates fail-safe systems, but compressor degradation precedes safety system activation and is detectable earlier with trend monitoring
Critical
Emergency Generators
AI monitors: load test trending over time, battery charger current, coolant temperature during monthly runs, fuel consumption per test cycle
Detection window: 30–60 days before load test failure or starting system degradation
Patient impact: An emergency generator that fails to start during a utility power outage is the highest-consequence single-point failure in a hospital — NFPA 110 requires generator PM and monthly load testing specifically to prevent this, but PM that is scheduled but not executed creates the gap AI trend monitoring closes
Critical
Sterilisation Equipment
AI monitors: cycle time deviation, temperature overshoot/undershoot frequency, door seal leak tests, biological indicator trend
Detection window: 2–6 weeks before cycle failure or sterilisation breach event
Patient impact: A sterilisation equipment failure after instrument processing triggers a surgical instrument recall investigation — potentially affecting all procedures performed since the last confirmed successful cycle, with mandatory patient notification and infection surveillance follow-up per CDC and AAMI ST79
High
MRI and Imaging Equipment
AI monitors: helium level trend in superconducting magnets, chiller performance, RF shielding integrity, cryogen boil-off rate
Detection window: Up to 60 days before helium quench or chiller failure causing magnet warming
Financial impact: An unplanned MRI downtime event costs a public hospital $15,000–$45,000 per day in lost revenue and patient rescheduling; a helium quench requires $50,000–$150,000 in refill costs plus OEM service. AI prediction reduces unplanned MRI downtime by up to 60%.
High
Expert Review
"The distinctive challenge of public healthcare facility management is that the analytics you need are simultaneously operational and regulatory — and the audience consuming those analytics spans multiple stakeholder groups, each with different information requirements. A facility director needs PM compliance rates and reactive work ratios for operational management. A risk manager needs equipment failure probability scores and compliance gap reports for liability management. A board member or budget committee needs maintenance cost per department and capital replacement forecasting for governance. In a private health system, these stakeholders often have separate reporting structures and separate data systems. In a public hospital — a VA facility, a county health system, a public psychiatric hospital — they often share the same constrained resources and the same CMMS data. AI analytics that can serve all three audiences from a single data source are not a luxury in public healthcare; they are the mechanism by which a single facility director can fulfil multiple accountability obligations simultaneously, in real time, without building a reporting infrastructure that consumes the staff time that should be going into maintenance execution. I have worked with public hospitals where the facility director was spending two days per month assembling compliance reports for Joint Commission preparation. With OxMaint analytics, that becomes a two-minute export."
Dr. Maria Santos, PE, CEM, LEED AP
Licensed Professional Engineer · Certified Energy Manager · LEED Accredited Professional · 21 years public sector infrastructure and healthcare facility asset management · Specialist in AI analytics implementation for government and public healthcare maintenance programmes
Frequently Asked Questions
What Joint Commission standards does OxMaint Analytics support for healthcare facilities?
OxMaint Analytics directly supports documentation and compliance tracking for Joint Commission Environment of Care standards:
EC.02.05.01–09 (utility systems management) — tracking PM compliance for electrical, HVAC, plumbing, medical gas, and emergency power systems;
EC.02.06.01 (maintenance and inspection of medical equipment) — PM completion rates, life safety equipment testing records, and corrective maintenance response times; and
EC.04.01.01 (safety evaluation of the environment of care) — inspection records, deficiency tracking, and corrective action documentation. The Joint Commission's data-driven survey approach increasingly requests historical PM compliance data by asset category. OxMaint Analytics generates the PM compliance rate by asset class, the deficiency and corrective action record, and the utility system test history that surveyors request — in a single exportable report format.
Book a demo to see OxMaint's Joint Commission compliance reporting.
How does OxMaint Analytics help public hospitals manage the reactive-to-planned maintenance ratio?
OxMaint tracks every work order as either planned/preventive (scheduled PM) or reactive/corrective (unplanned breakdown or complaint-driven), and calculates the reactive work percentage per department, per asset class, and overall — updated in real time. The target for a well-managed healthcare facility is
below 20% reactive work; world-class is below 10%. The analytics view shows whether the ratio is improving (PM programme is reducing reactive burden) or worsening (deferred PMs are increasing breakdown frequency). For public hospitals under budget pressure, this ratio is the leading indicator of future emergency spend — a rising reactive ratio predicts rising overtime, rising contractor emergency rates, and rising equipment replacement costs 6–12 months before the budget impact is visible. Early trend detection is the basis for the PM investment justification that public hospital finance committees require.
Start free to begin tracking your reactive vs planned ratio in OxMaint.
How does AI predict equipment failures in a public hospital rather than just scheduling fixed-interval PMs?
AI prediction models supplement fixed-interval PMs by learning from multiple data streams that fixed-interval schedules cannot incorporate: failure pattern history — the work order history for similar assets in similar environments, revealing which failure modes precede breakdown by weeks or months; condition score trends — the rate of condition decline per asset, modelling when the asset will reach the failure threshold; sensor and IoT data — real-time performance deviations from baseline that indicate developing faults before they cause visible symptoms; and environmental correlation — linking building environmental data (humidity spikes, temperature excursions) to failure events on sensitive equipment. Fixed-interval PM schedules are designed around average equipment behaviour. AI prediction adapts to the specific behaviour of each individual asset in its specific operating environment — which is why AI-monitored HVAC systems detect 90–95% of issues 45–90 days before failure, compared to the reactive detection that occurs when the failure affects patient care.
Can OxMaint Analytics generate the capital budget justification reports that public hospital boards require?
OxMaint Analytics generates capital budget justification from four data inputs that public hospital boards typically require: current condition score per asset — showing which assets are approaching end-of-life and justifying replacement before emergency failure; cumulative maintenance cost trend — showing when annual repair spend exceeds the replacement cost threshold (typically 25–30% of replacement value annually) at which replacement is more economical than continued repair; failure probability score — quantifying the risk of continued operation beyond the replacement window; and downtime cost estimate — projecting the operational cost of the unplanned failure that replacement avoids. For public healthcare facilities where capital budget requests must survive governance scrutiny, the OxMaint capital report converts "we need to replace this equipment" from a maintenance manager's opinion into a data-backed submission with cost, condition, risk, and downtime projections per asset line.
AI ANALYTICS · PUBLIC HEALTHCARE · OXMAINT
35,000 Devices. Multiple Regulatory Standards. Budget Pressure. One Analytics Platform.
OxMaint Analytics gives public healthcare facility managers real-time PM compliance rates, MTTR by priority, regulatory compliance status, AI failure predictions, cost-per-department trends, and reactive-to-planned ratios — all generated from your work order data, updated continuously, and exportable for Joint Commission, CMS, board, and budget committee reporting in under two minutes.