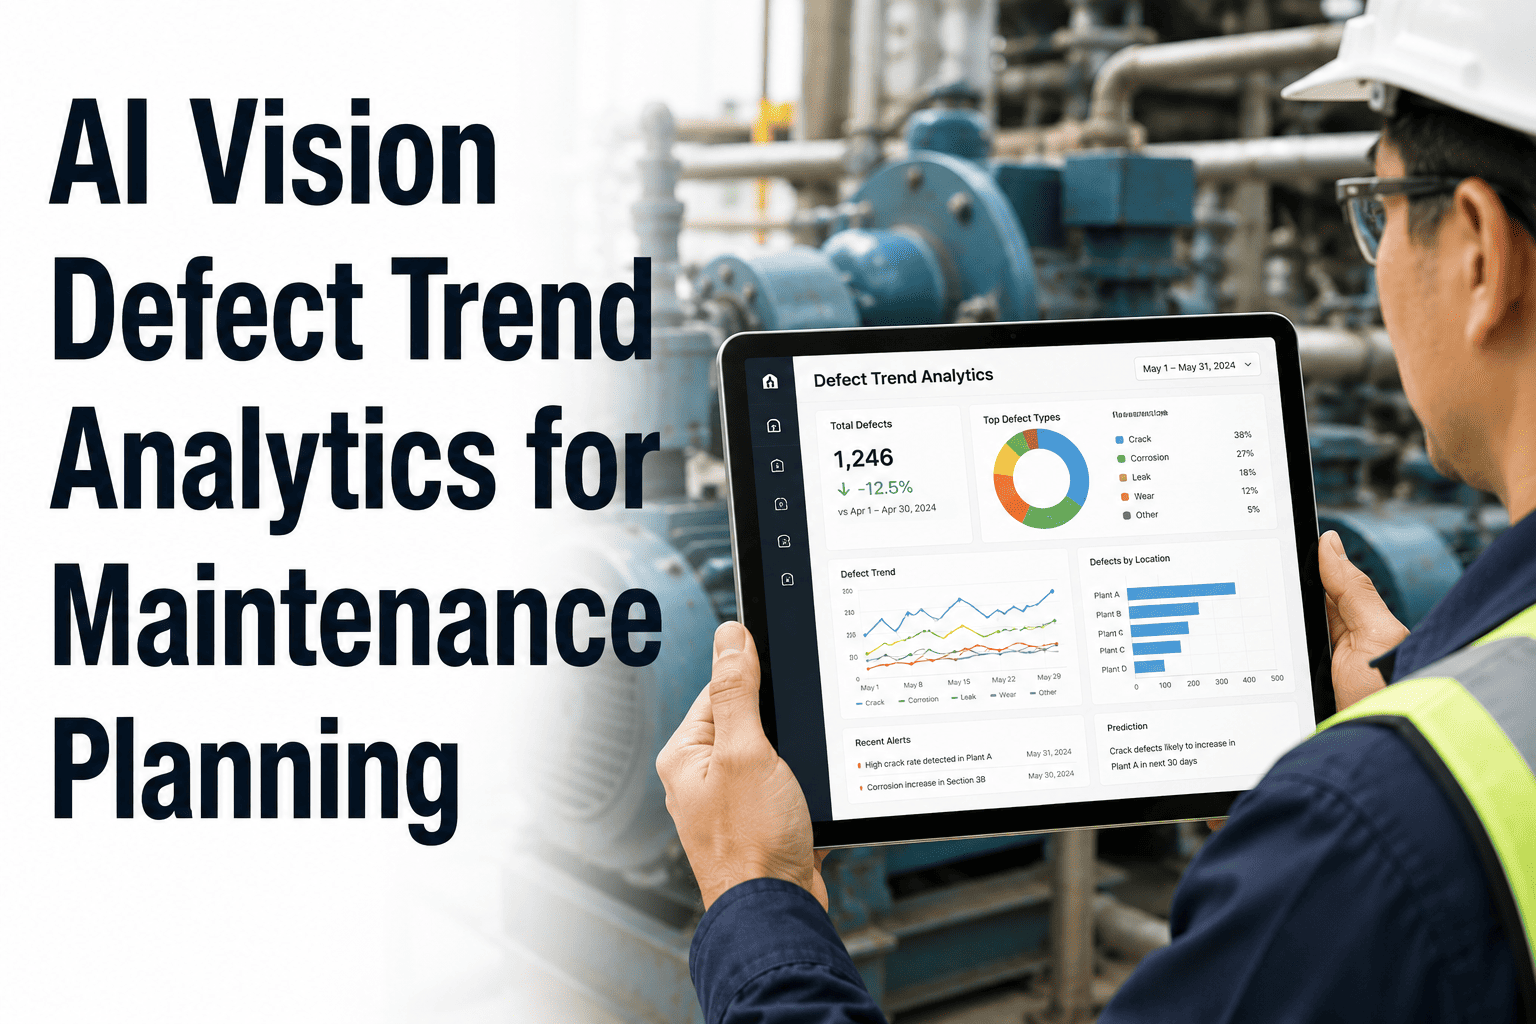
A single inspection tells you what is wrong today. A defect trend tells you what will break next quarter and which assets are deteriorating faster than the maintenance budget can keep up with. Government maintenance planners who rely only on individual inspection reports react to failures rather than preventing them — which is how emergency repairs consume budgets planned for preventive maintenance. OxMaint AI Vision Defect Trend Analytics gives public-sector maintenance teams the data layer they have been missing: defect frequency, severity progression, and asset condition trajectories analyzed automatically from continuous AI inspection data, without requiring a data analyst or custom BI tool. Planners use this intelligence to allocate budget to the right assets, schedule preventive interventions before failures, and defend maintenance spending decisions to departmental leadership with real data. Start a free trial and see your first defect trend report within 30 days of deployment.
Know Which Assets Are Deteriorating Before They Fail
OxMaint AI Vision tracks defect frequency, severity progression, and condition trend across every monitored government asset — giving maintenance planners the predictive intelligence to allocate budgets and schedule interventions before emergency failures occur.
Four Defect Trend Dimensions OxMaint Tracks Automatically
How often is a specific defect type detected on a specific asset or asset class? Rising frequency on structural assets is an early warning of accelerating deterioration that a single inspection would miss.
Is the same defect getting worse, stabilizing, or improving after interventions? Severity progression over time reveals whether maintenance actions are working or whether the underlying condition is worsening.
A rolling condition score per asset based on cumulative defect history — updated automatically from AI inspection data. Planners use this to prioritize capital replacement vs continued maintenance for aging infrastructure.
Which assets in the same class are accumulating defects faster than peers? Cross-asset comparison identifies outliers that need accelerated inspection schedules or pre-emptive budget allocation before the current cycle ends.
How Government Maintenance Planners Use Defect Trend Data
| Department / Asset Type | Trend Signal OxMaint Detects | Planning Action Triggered | Outcome |
|---|---|---|---|
| Roads — Pothole frequency | Defect count up 3× in 60 days on 4 road segments | Pre-monsoon resurfacing budget allocated to those segments | Emergency closures avoided |
| Bridges — Crack progression | Crack width increasing 0.2mm per month on 2 spans | Structural engineer inspection scheduled 6 months ahead of plan | Early structural intervention |
| Pump Stations — Seal wear | Seal weep detected on 3 of 8 pumps in one zone | Zone-wide seal replacement added to next PM window | Batch maintenance saves cost |
| EOC Generators — Corrosion | Surface corrosion severity rising on 2 units | Protective treatment scheduled before rainy season | Critical asset protected |
| Street Lighting — Fixture wear | Corrosion at mounting point across 12 poles in one corridor | Corridor-wide bracket replacement vs reactive single-pole fixes | 40% lower cost per fix |
See Your Asset Condition Trends in a Live Demo
A 30-minute demo covers defect frequency tracking, severity progression visualization, condition scoring, and how planners use OxMaint trend data to make defensible budget allocation decisions.
Before vs After: Maintenance Planning With AI Trend Analytics
Government maintenance planners are constantly asked to justify their budget requests with data they do not have — because most inspection programs produce individual reports, not trend intelligence. AI vision defect analytics changes that equation completely. When you can show leadership a graph of crack propagation over 90 days on a specific bridge section, a budget request for structural intervention is no longer a guess — it is evidence-based. That shift in how planners communicate with budget holders is as valuable as the defect detection itself.
AI Vision Defect Trend Analytics — Questions from Planners
Plan Maintenance With Data, Not Instinct
OxMaint AI Vision Defect Trend Analytics gives government maintenance planners the condition trajectory data they need to allocate budgets correctly, prevent emergency failures, and defend maintenance decisions with evidence — not estimates.