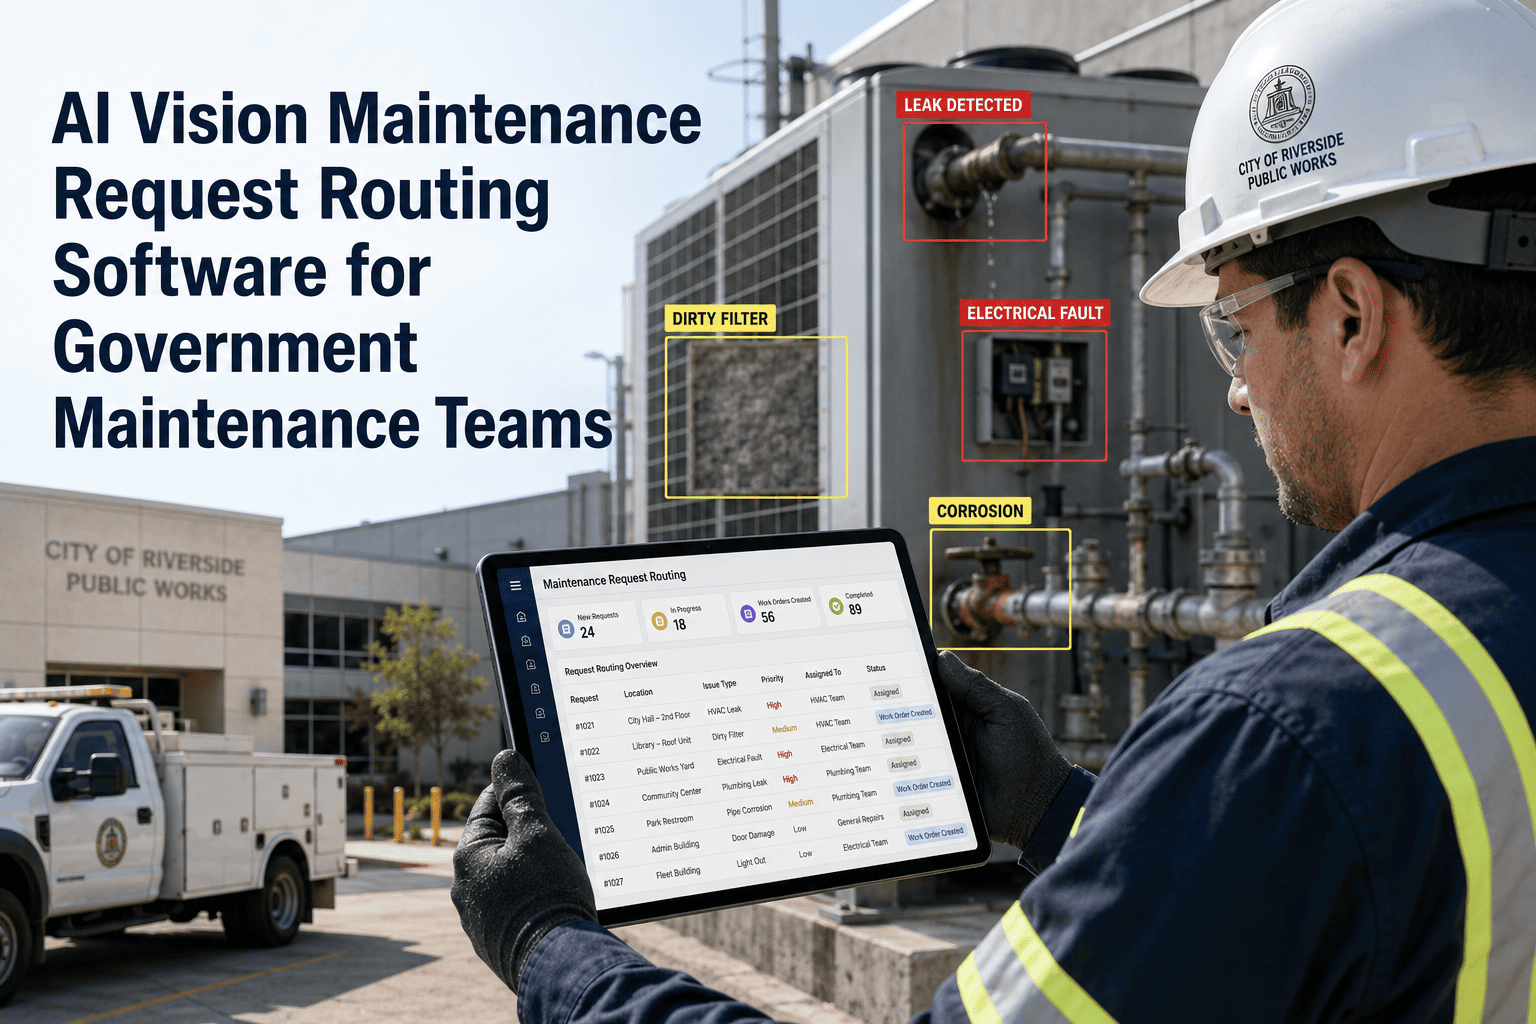
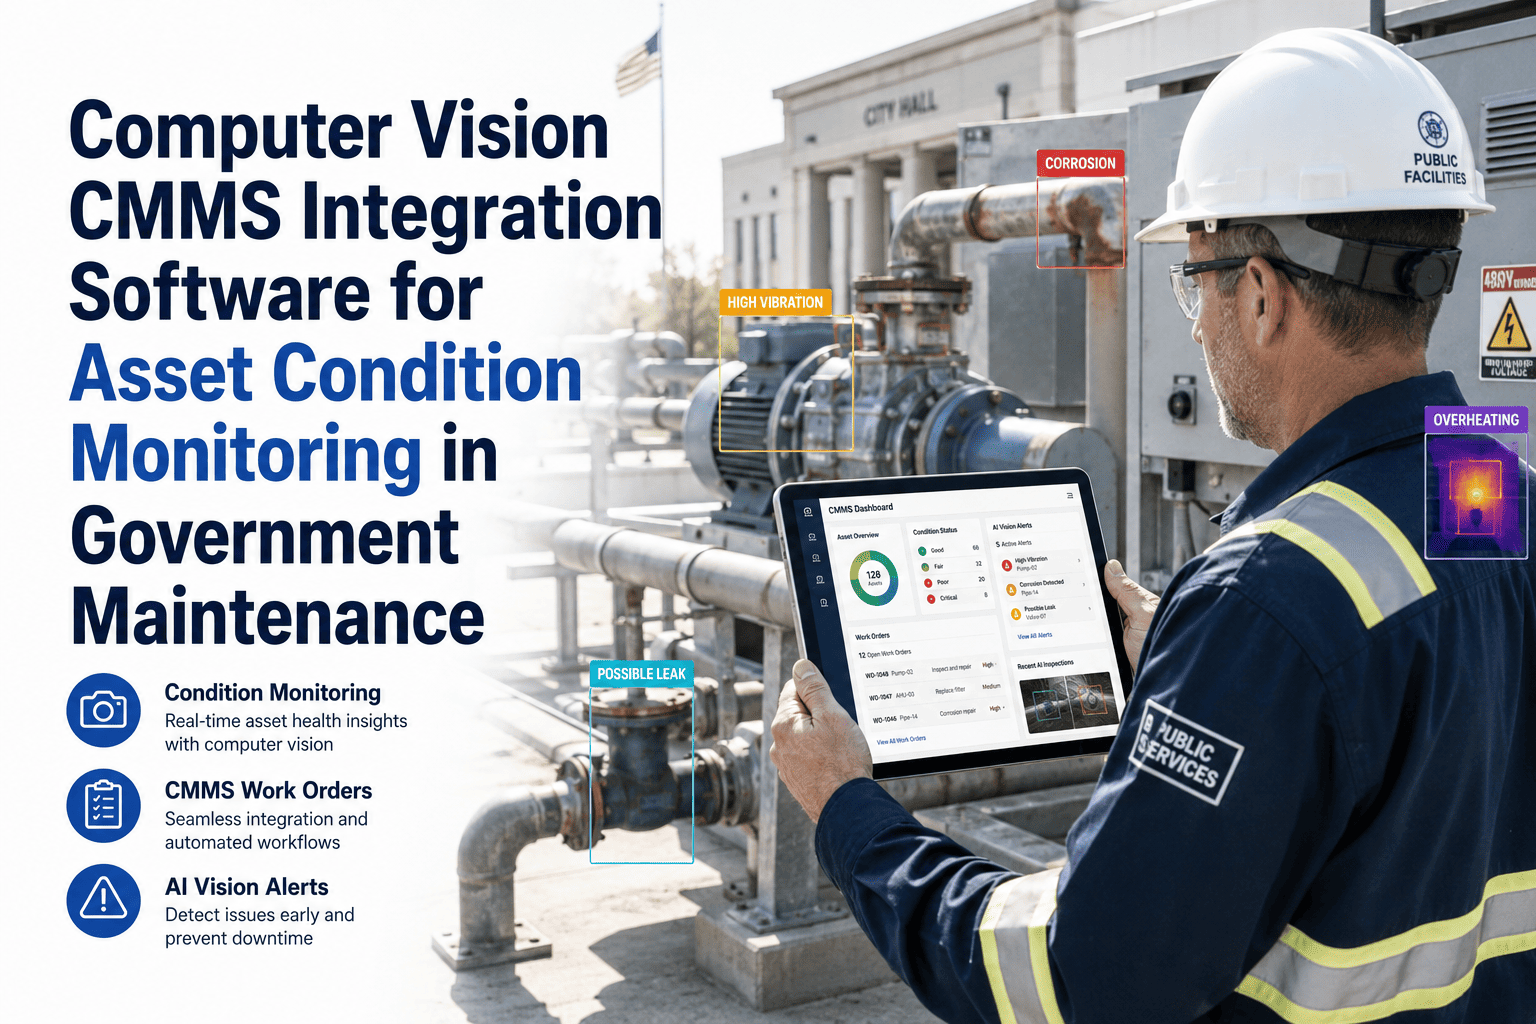
Government maintenance directors are increasingly expected to present operational performance data to leadership, treasury, and oversight committees — not just to manage it internally. Power BI has become the reporting standard across many public-sector agencies, but the data feeding those dashboards still comes from manual entry, spreadsheet exports, and disconnected systems that do not reflect what is actually happening on the ground in real time. Book a demo with OxMaint to see how AI vision inspection data flows directly into your Power BI maintenance dashboards — giving leadership accurate, real-time asset condition intelligence without manual data assembly. When AI vision is integrated with Power BI, every inspection image that enters the CMMS becomes a structured data point — asset ID, condition score, severity, timestamp, location — that feeds live into your reporting layer and makes your dashboards reflect reality rather than last week's export.
Government / Public Works · Power BI · AI Vision Reporting
AI Vision Integration with Power BI Maintenance Dashboards for Government Maintenance Teams
Transform inspection image data into live Power BI intelligence — asset condition trends, severity distributions, work order performance, and compliance status — all updated in real time.
The Reporting Problem
Why Government Maintenance Dashboards Lag Behind Reality
01
Manual Data Assembly
Maintenance KPI reports are assembled weekly or monthly by analysts pulling data from multiple disconnected systems — CMMS, inspection tools, spreadsheets. By the time the dashboard updates, the data is already outdated.
02
No Asset Condition Data
Power BI dashboards typically show work order counts and costs — not asset condition. Leadership sees how much maintenance was done, but not the actual health state of the asset portfolio driving those costs.
03
Severity Is Not Quantified
Without AI classification, there is no consistent severity score across inspections. Dashboards cannot show trending severity, deterioration rates, or priority distribution — because the underlying data does not exist in structured form.
04
Visual Evidence Excluded
Power BI dashboards show numbers. The inspection images that explain those numbers — why severity is increasing on the eastern water treatment site, which assets are deteriorating fastest — are stored elsewhere and never surface in reporting.
Data Flow Architecture
How OxMaint AI Vision Data Flows into Power BI
Layer 1 — Capture
Field Inspection Camera
AI Image Classification
Severity Score Assignment
Layer 2 — CMMS (OxMaint)
Asset Record Update
Work Order Generation
Structured Data Store
Layer 3 — Integration
OxMaint API / Data Connector
Scheduled or Real-Time Sync
Power BI Dataset Refresh
Layer 4 — Dashboard
Live Asset Condition Visuals
Severity Trend Charts
Compliance & WO Performance
Dashboard Metrics
What Government Teams See in Power BI with OxMaint Data
Asset Condition Distribution
Key Performance Metrics Available
Mean Time to Detect (MTTD)Days from defect onset to AI detection
Work Order Response Rate% of severity 3+ findings actioned within SLA
Asset Deterioration VelocitySeverity trend per asset class over time
Inspection Checkpoint Compliance% of scheduled checkpoints completed on time
Corrective Work Order BacklogOpen corrective actions by severity and age
| Reporting Dimension |
Standard Power BI (No AI Vision) |
Power BI + OxMaint AI Vision |
| Data Freshness |
Weekly or monthly — manual export required |
Real-time or scheduled — automatic via API |
| Asset Condition Visibility |
Not available — work order counts only |
Severity distribution, trends, and per-asset scores |
| Inspection Coverage |
Checkbox completions only |
AI-classified findings with photographic evidence count |
| Predictive Capability |
None — historical only |
Deterioration trend modelling per asset class |
| Audit Evidence in Report |
No — numbers only |
Drill-through to inspection image and AI classification |
See OxMaint Data Live in Power BI
Government maintenance directors use OxMaint + Power BI to present accurate, real-time asset condition intelligence to treasury and oversight committees. Book a demo to see the integration in action.
"
The most valuable change we made was connecting our AI inspection data to Power BI. Before, our dashboards told us how many work orders we closed. Now they tell us the actual condition state of every asset class across the estate, which assets are deteriorating, and which we need to prioritise for capital replacement in the next budget cycle. That is the intelligence a maintenance director needs to manage a government asset portfolio — and it only exists when inspection data is structured, classified, and fed into the reporting layer automatically.
Director of Public Works Infrastructure, Municipal Authority
17 Years Government Asset Management · Power BI Implementation Lead · Specialises in Maintenance Performance Reporting for Public Sector
Frequently Asked Questions
How does OxMaint connect to Power BI?
Can we access the inspection images directly from Power BI dashboard drill-throughs?
Yes — OxMaint's data export includes image URLs that Power BI can render in report drill-throughs. A leadership user can review a high-severity asset in the dashboard, drill through to the specific inspection event, and see the AI-classified image and finding details without leaving the Power BI environment. This capability is particularly valuable when presenting asset condition reports to oversight committees who need to understand the basis for maintenance budget requests.
Start a free trial to see how inspection images surface in reporting drill-throughs.
What government-specific Power BI report templates does OxMaint support?
OxMaint provides pre-built report templates covering the most common government maintenance reporting requirements — asset condition by site, work order performance against SLA, inspection checkpoint compliance, corrective action backlog by severity, and procurement spend by asset class. These templates are configured to the government team's asset hierarchy and adjusted to match agency-specific reporting standards during onboarding. Government teams typically have their first live Power BI report running within two to three weeks of OxMaint deployment.
Book a demo to see the government reporting templates in detail.
Can AI vision data improve our capital maintenance budget submissions?
This is one of the most significant financial benefits government teams report. When Power BI dashboards show actual AI-classified asset condition trends — deterioration velocity, severity distribution by asset class, projected time to critical state — capital maintenance budget submissions are supported by objective data rather than engineering estimates. Treasury and finance teams respond significantly better to data-backed submissions, and government agencies using OxMaint report improved capital allocation outcomes and fewer budget challenges when they can demonstrate the condition evidence behind their requests.
OxMaint · Power BI Integration · Government CMMS
Make Your Power BI Maintenance Dashboards Reflect Reality
OxMaint feeds AI-classified inspection data directly into your Power BI environment — giving government leadership real-time asset condition intelligence, severity trends, and compliance performance without a single manual export.