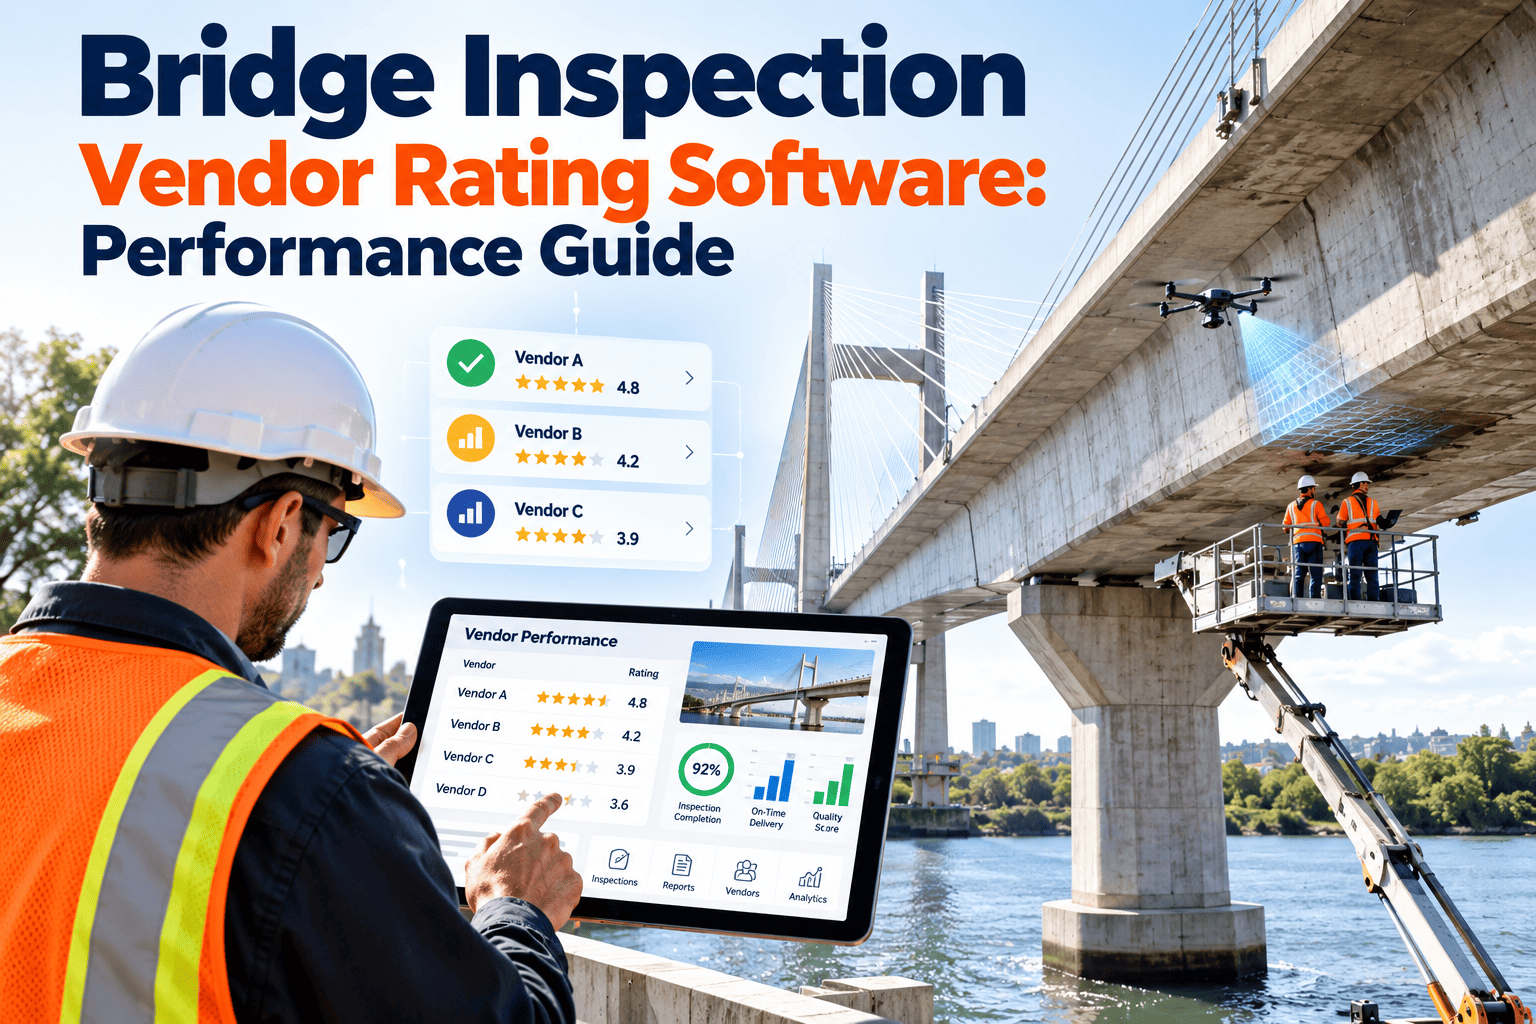
State DOTs, counties, and toll authorities depend on consultant firms to perform a large share of routine, fracture critical, underwater, and special bridge inspections. Yet vendor selection and renewal often rest on low bid, familiarity, and institutional memory instead of measured results. Late reports, failed QC reviews, and inconsistent condition ratings then ripple into load rating updates, repair programming, and public confidence. A vendor rating discipline turns every inspection deliverable into a data point. This guide shows how bridge vendor rating software keeps that record in one place.
Bridge Inspection Vendor Rating Software: Performance Guide
Score every inspection consultant on on-time delivery, QC pass rate, and finding accuracy, then use the record to guide assignments and contract renewal.
Why Bridge Inspection Vendor Performance Rarely Gets Measured
Most agencies can tell you how many bridges are due for inspection this quarter. Far fewer can say which firm delivered its last ten reports on time, or whose element data needed the most correction.
- Renewals default to the incumbent because nobody can prove otherwise.
- QC comments are resolved by email and then disappear.
- Strong and weak firms receive the same volume of work.
- Late reports are tolerated until a deadline becomes a compliance problem.
- Every assignment carries a due date, a status, and a delivery timestamp.
- QC review results are stored against the bridge and the vendor.
- Assignments follow documented performance.
- Renewal packages are built from records, not recollection.
What goes wrong when vendors are not rated
- Late reports delay load rating updates, repair prioritization, and inventory submittals.
- Inaccurate condition data pushes maintenance dollars toward the wrong structures.
- Repeat QC failures consume reviewer hours that could support field oversight.
- Auditors and FHWA reviewers ask for QA evidence that lives in personal inboxes.
Where Vendor Rating Fits Inside NBIS Compliance
The National Bridge Inspection Standards (23 CFR 650, Subpart C) place responsibility for program quality on the agency, even when consultants perform the fieldwork. Vendor rating is one way to prove that oversight is real.
| NBIS area | What it means for vendor oversight | Record to keep |
|---|---|---|
| Inspection frequency | Routine and fracture critical inspections generally run on 24-month cycles; underwater inspections on longer cycles. Vendors must hit those dates. | Due date, completion date, and report delivery date per bridge |
| Personnel qualifications | Team leaders and program staff must meet defined qualification and training requirements. | Certification and training expiry per inspector |
| Quality control and assurance | Vendors apply QC; the agency runs QA and documents the results. | QC review outcomes, QA sample results, corrective actions |
| Critical findings | Findings that threaten safety need prompt notification and follow-up. | Timestamps from discovery to notification to resolution |
| Load rating | Condition changes can trigger new load ratings within required timeframes. | Load rating trigger and completion dates |
| Inventory data | Data must be accurate and consistent as agencies transition to the Specifications for the National Bridge Inventory (SNBI). | Data validation errors per submittal |
The Four-Part Bridge Vendor Scorecard
A useful scorecard is small enough to explain in one meeting and specific enough to defend in a contract dispute. The weights below are a starting example; adjust them to your contract and risk profile.
| Metric | What it measures | Formula | Sample weight |
|---|---|---|---|
| On-time delivery | Reports submitted by the contract due date | Reports on time / reports due | 30% |
| QC pass rate | Reports accepted without major rework | First-pass accepted / reports reviewed | 25% |
| Finding accuracy | Agreement between vendor findings and QA verification | Verified findings / findings sampled | 30% |
| Critical finding response | Speed of notification and follow-up | Notifications within required window / critical findings | 15% |
On-time delivery
Track two dates: field inspection completion and final report acceptance. A vendor can finish fieldwork promptly and still stall the report.
- Record the original due date and any approved extension separately.
- Count extensions granted for agency-caused delays as neutral, not vendor misses.
QC pass rate
First-pass acceptance shows how much internal quality control the firm performs before submitting. Rework cycles are the hidden cost of a low bid.
- Categorize comments as minor, moderate, or major so one typo does not equal a failed report.
- Track the number of review rounds per report.
Finding accuracy
This metric matters most for safety and programming, and it is the hardest to measure. It depends on QA sampling, covered in the next section.
Critical finding response
Measure the hours from discovery to agency notification, and from notification to documented action. Slow notification is a safety issue, not a scheduling issue.
From Assignment to Renewal: The Rating Workflow
Measuring Finding Accuracy Without Guesswork
Finding accuracy cannot be scored from paperwork alone. It needs a repeatable QA sample in which an agency inspector or independent reviewer verifies a portion of each vendor's work.
Practical QA sampling methods
- Field re-inspection of a small, rotating sample of each vendor's bridges.
- Desk review comparing photos, sketches, and element quantities against prior inspection history.
- Trend checks that flag sudden, unexplained condition improvements without recorded repairs.
- Comparison of narrative notes against the ratings assigned.
How to classify variance
Vendor Segmentation Matrix
Once scores accumulate, plot each firm by delivery reliability and quality. The quadrant suggests the right management response.
Contract Cycle Timeline
Spreadsheets vs a CMMS for Bridge Vendor Rating
| Need | Spreadsheet approach | CMMS approach |
|---|---|---|
| Due-date tracking | Manual updates, easy to miss | Scheduled work orders with status and alerts |
| QC comments | Email threads and attachments | Comments and resubmittals stored on the work order |
| Vendor history | Separate tabs per year | Searchable history by vendor, bridge, and inspection type |
| Reporting | Rebuilt before each review | Dashboards generated from live records |
| Audit trail | Difficult to prove who changed what | Timestamped activity on each record |
How Oxmaint Supports Bridge Vendor Rating
Oxmaint maintenance management software gives bridge programs the records a scorecard depends on, without asking reviewers to rebuild history from email.
- Asset management: keep each bridge, its inspection type, and its inspection history in one record.
- Work orders and scheduling: assign inspections to vendors with due dates and track completion.
- Inspections and compliance records: attach reports, photos, and QC comments to the bridge.
- Corrective maintenance: turn inspection findings into repair work orders with clear priority.
- Dashboards and reporting: summarize on-time delivery, QC outcomes, and open findings by vendor.
- Mobile workflows: capture field notes and status updates at the structure.
Scorecard rollout checklist
- Define the four metrics and weights in writing.
- Add the scorecard terms to contracts or task orders.
- Load current bridges, vendors, and due dates.
- Set the QA sampling rate and reviewer assignments.
- Schedule quarterly vendor feedback sessions.
- Plan the annual rating review ahead of renewal dates.