State DOT bridge programs are being asked to defend spend at a resolution most legacy systems were never built to produce — not "how much did we spend on bridges this year," but "how much did this specific bridge, this specific inspection type, and this specific vendor cost us." With bridge rehabilitation needs now estimated in the hundreds of billions nationally, budget offices are pushing that question down to every line item, and a program that can only answer it in aggregate is the one that loses the argument for next year's funding. A CMMS built around per-bridge cost tracking is how leaner bridge programs are closing that gap without adding headcount.
Can you tell your budget office what Bridge #4471 cost to inspect last year — broken down by inspection type and vendor?
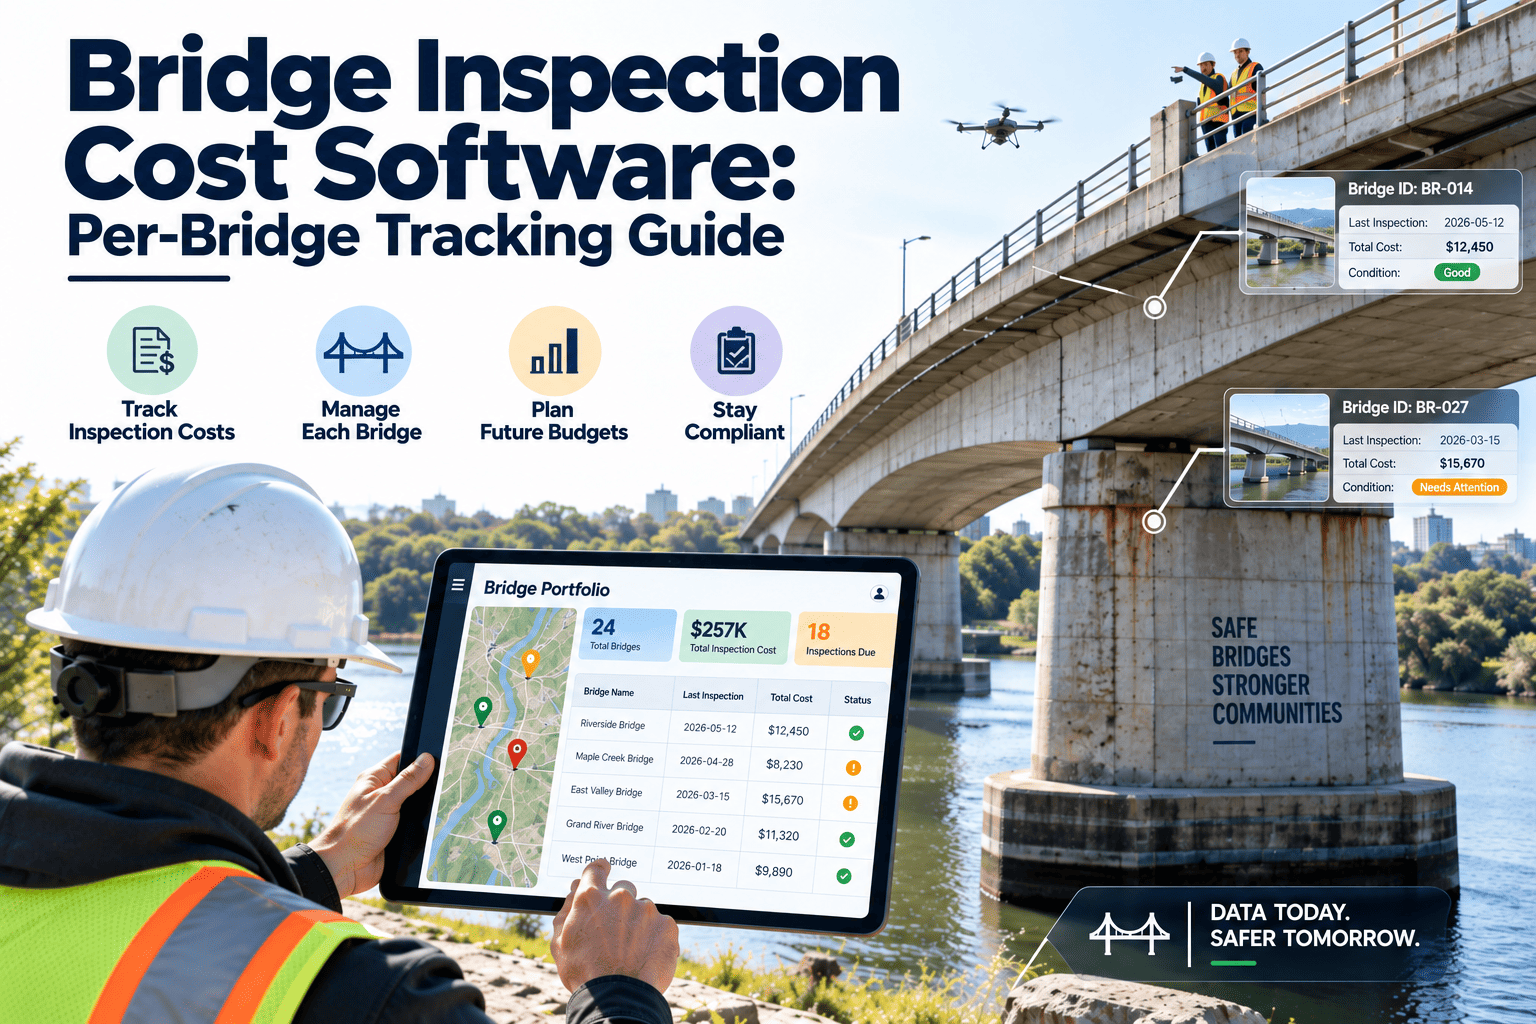
Most bridge programs can report total annual inspection spend. Almost none can break it down per bridge, per inspection type, and per vendor on demand. That gap is exactly what a per-bridge cost tracking workflow inside a CMMS is built to close.
The national bridge inventory is aging faster than funding is growing
The scale of the inventory every inspection budget has to cover is enormous, and it is getting more expensive to maintain every year — which is exactly why cost has to be tracked at the bridge level, not just the program level.
Total program spend hides where the money actually goes
A single annual inspection-program total tells a budget office almost nothing about where dollars are effective and where they are wasted. Three questions expose the gap most legacy tracking cannot answer.
- One annual total for the whole inspection program
- Cost per bridge estimated only during budget season, from memory or spreadsheet reconstruction
- Vendor invoices filed by date, not linked to the bridge or inspection type they covered
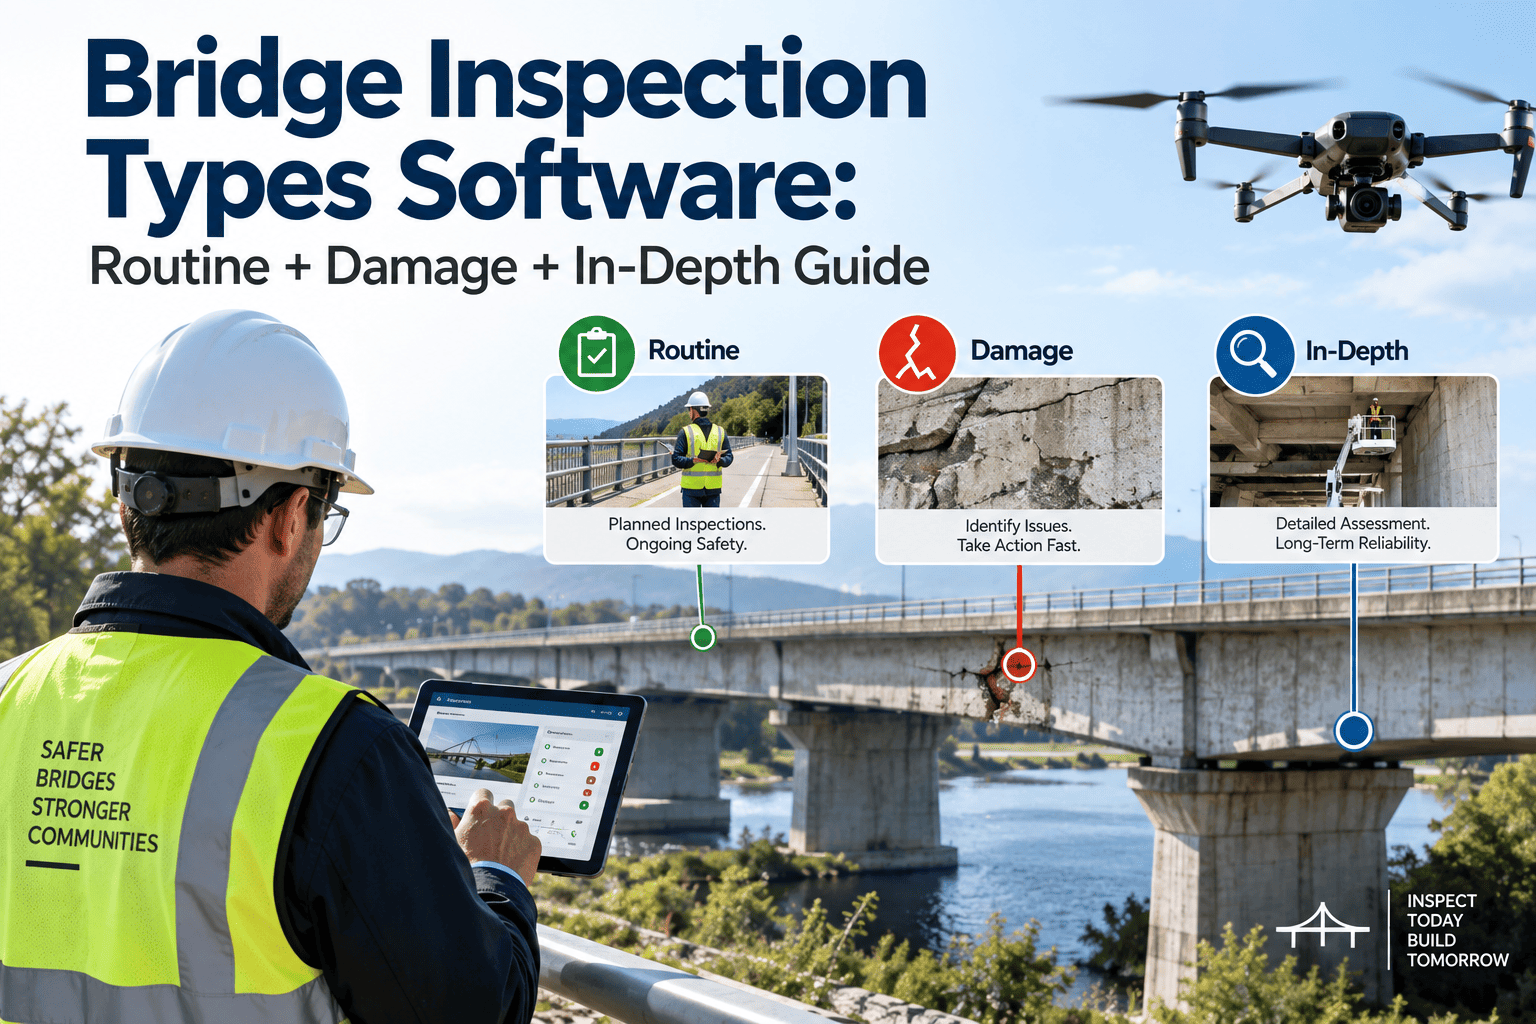
- No way to see which inspection type — routine, fracture-critical, underwater, special — is driving cost growth
- Cost logged against the specific bridge, inspection type, and vendor at time of work order closure
- Any bridge's full cost history pulled in seconds, not reconstructed from filed invoices
- Vendor cost trends visible across the whole contracted inspection portfolio
- Cost-per-inspection-type reporting available for NBIS-mandated routine, fracture-critical, and underwater cycles separately
Inspection cost is not uniform across the inventory — and shouldn't be tracked as if it were
NBIS sets the inspection cycle, but the cost of meeting it varies enormously by structure type, access difficulty, and condition. Four factors explain most of the spread state programs report, and each one shows up differently depending on whether a bridge sits on the state or local system.
A short-span, easy-access structure on flat terrain can be inspected from the deck or a ladder in under an hour. A long-span river crossing with fracture-critical members underneath may require a multi-day mobilization involving a snooper truck, a certified team lead, and coordinated lane closures with the local jurisdiction. Treating these two structures as equivalent "one inspection" line items in a budget spreadsheet is exactly what produces the disconnect between total program spend and actual per-bridge cost.
Inspection Type
Routine biennial inspections cost far less than fracture-critical member inspections or underwater diving inspections, which require specialized crews and equipment.
Access Requirements
Structures requiring snooper trucks, rope access, or lane closures carry access-equipment and traffic-control costs that dwarf the inspection labor itself.
Condition and Load Posting
A posted or poor-condition bridge is inspected more frequently and often requires supplemental load-rating analysis, both of which add cost above the baseline cycle.
In-House vs. Consultant
Programs blending district staff inspections with consultant contracts need cost tracked consistently across both delivery models to compare true unit cost.
Stop reconstructing cost per bridge at budget season
Log inspection cost against the bridge, the inspection type, and the vendor as work orders close — not once a year from filed invoices.
Preventive spend versus reactive spend, by the numbers
State DOT bridge programs consistently report the same pattern reflected in published 2025 unit-cost estimates: the earlier a deficiency is caught and addressed, the cheaper the fix — and that pattern only shows up in the data when cost is tracked at the bridge and work-type level.
| Bridge Work Category | Example Scope | Relative Cost per Square Foot |
|---|---|---|
| Preventive Maintenance | Deck sealing, joint and bearing maintenance, paint element upkeep | Lowest tier — roughly $100–$150/SF |
| Rehabilitation | Concrete repair, expansion joint and bearing replacement | Mid tier — roughly $550–$650/SF |
| Major Rehabilitation | Deck replacement, superstructure rehabilitation | High tier — roughly $850–$900/SF |
| Full Replacement | Complete bridge replacement | Highest tier — over $1,100/SF as of 2025 |
These figures, drawn from recent state DOT bridge condition reporting, are exactly why inspection cost cannot be viewed in isolation from the maintenance cost it feeds — a program that catches deterioration during a routine or fracture-critical inspection funnels a bridge toward the cheapest column in this table, not the most expensive one.
Four steps to a per-bridge cost record your budget office trusts
Register every structure with its NBIS inspection type and cycle
Import the bridge inventory with structure type, NHS status, condition rating, and mandated inspection interval attached to each record.
Tag every work order with inspection type and vendor
Routine, fracture-critical, underwater, and special inspections are logged as distinct work order types, each carrying the assigned vendor or in-house crew.
Capture actual cost at work order closure
Labor hours, equipment (snooper, dive crew, traffic control), and consultant invoice amounts are recorded against the bridge and inspection type as the work is closed out.
Roll up cost by bridge, type, and vendor for reporting
Dashboards surface cost per bridge over time, cost per inspection type across the portfolio, and vendor-to-vendor comparisons for contract renewal decisions.
A CMMS built for line-item bridge budget defense
Oxmaint gives bridge maintenance and inspection teams a structured place to capture the cost data budget offices are now asking for, without adding a parallel spreadsheet process.
Per-bridge asset records
Every structure carries its own asset record, condition history, and full inspection and cost history in one place.
Preventive maintenance scheduling
Set NBIS-driven inspection intervals by structure type and condition, with automatic recurrence and overdue alerts.
Mobile field inspections
Field inspectors log findings, photos, and element condition ratings from the bridge site, tied directly to that structure's work order.
Vendor and cost tracking
Attach vendor, labor, and equipment cost to each closed work order for accurate per-inspection-type and per-vendor reporting.
Compliance-ready records
Maintain an auditable inspection and cost history for FHWA and state DOT reporting requirements.
Program-level dashboards
View total spend by bridge, inspection type, district, or vendor in a single dashboard for budget season presentations.
The inspection cycle cost tracking has to sit alongside
The National Bridge Inspection Standards set the frequency and rigor every state DOT program has to meet, and the 2022 NBIS Final Rule expanded reporting requirements further — which is part of why the cost of compliance has been climbing even as the share of bridges in poor condition has slowly improved.
Most NBI bridges — those carrying vehicular traffic on a public roadway over 20 feet in length — are inspected on a 24-month cycle at minimum, with fracture-critical, underwater, and other special inspections following their own more frequent schedules. A bridge posted for load restriction typically moves to a shorter cycle automatically, which is one reason the 63,085 posted structures nationally carry a disproportionate share of total inspection spend relative to their share of the inventory.
| Inspection Type | Typical Cycle | Cost Driver |
|---|---|---|
| Routine | 24 months (standard) | Baseline labor and travel; lowest cost per structure |
| Fracture-Critical | Per member-specific schedule, often 24 months or less | Specialized inspector qualification, access equipment |
| Underwater | Typically 60 months, shorter if scour-critical | Dive crew, specialized equipment, weather windows |
| Special / Damage | As triggered by event or condition change | Unplanned scheduling, often expedited mobilization |
Because each inspection type carries a materially different cost structure, blending them into a single "inspection cost" line item in reporting understates where a program's dollars are actually concentrated — which is precisely the distinction per-bridge, per-type tracking is meant to restore.
Where per-bridge cost tracking typically breaks down today
Programs rarely lack the underlying cost data. What breaks down is the link between that data and the specific bridge and inspection type it belongs to.
Invoices filed by date, not bridge
Consultant invoices are archived chronologically or by contract number, requiring manual cross-referencing to attribute cost to an individual structure.
In-house labor cost untracked
District staff time on routine inspections is rarely logged with the same cost discipline as consultant contracts, skewing per-bridge comparisons.
Equipment cost bundled or omitted
Snooper truck rental, traffic control, and dive-crew mobilization are often tracked as a separate line item disconnected from the bridge they served.
No historical trend view
Even when cost is captured accurately for the current year, prior years live in different formats, making year-over-year cost trend reporting for a single bridge impractical.
Closing these gaps does not require a new inspection process — it requires the existing work order already generated for every inspection to carry a few additional structured fields, captured once at closeout rather than reconstructed later.
Bridge inspection cost tracking — five common questions
These are the questions bridge program managers raise most often when they first move from program-level totals to structure-level cost reporting.
What cost data do I need before I can report per-bridge inspection cost?
At minimum, each closed inspection work order needs the bridge ID, inspection type, vendor or crew, and total labor plus equipment cost. Most programs already generate this data — it just isn't linked together consistently.
How does this differ from tracking total annual inspection program spend?
A program total tells you what you spent; a per-bridge, per-type breakdown tells you why — which structures, inspection types, or vendors are driving cost, so budget requests can be targeted rather than blanket increases.
Can this handle both in-house district inspections and consultant contracts?
Yes — both delivery models are logged as work orders with the same cost fields, so in-house and consultant unit costs can be compared on equal footing across the portfolio.
Does per-bridge cost tracking help with NBIS compliance reporting?
Cost tracking runs alongside compliance tracking rather than replacing it — the same work order record that captures cost also holds the inspection date, findings, and condition rating NBIS reporting requires. Book a Demo to see the reporting fields.
How long does it take to get per-bridge cost reporting running?
Programs that already have a structured bridge inventory typically have cost tracking live within a few weeks, since the main effort is mapping existing vendor invoices to bridge and inspection-type fields. Start a free trial to import your inventory.
The KPIs a per-bridge cost record makes possible
Once cost is attached to the bridge and inspection type at closeout, a handful of KPIs become available that a program-total spreadsheet simply cannot produce.
- Cost per bridge, trended year over year, to flag structures whose inspection cost is rising faster than their condition would suggest
- Cost per inspection type across the full portfolio, separating routine, fracture-critical, underwater, and special inspections
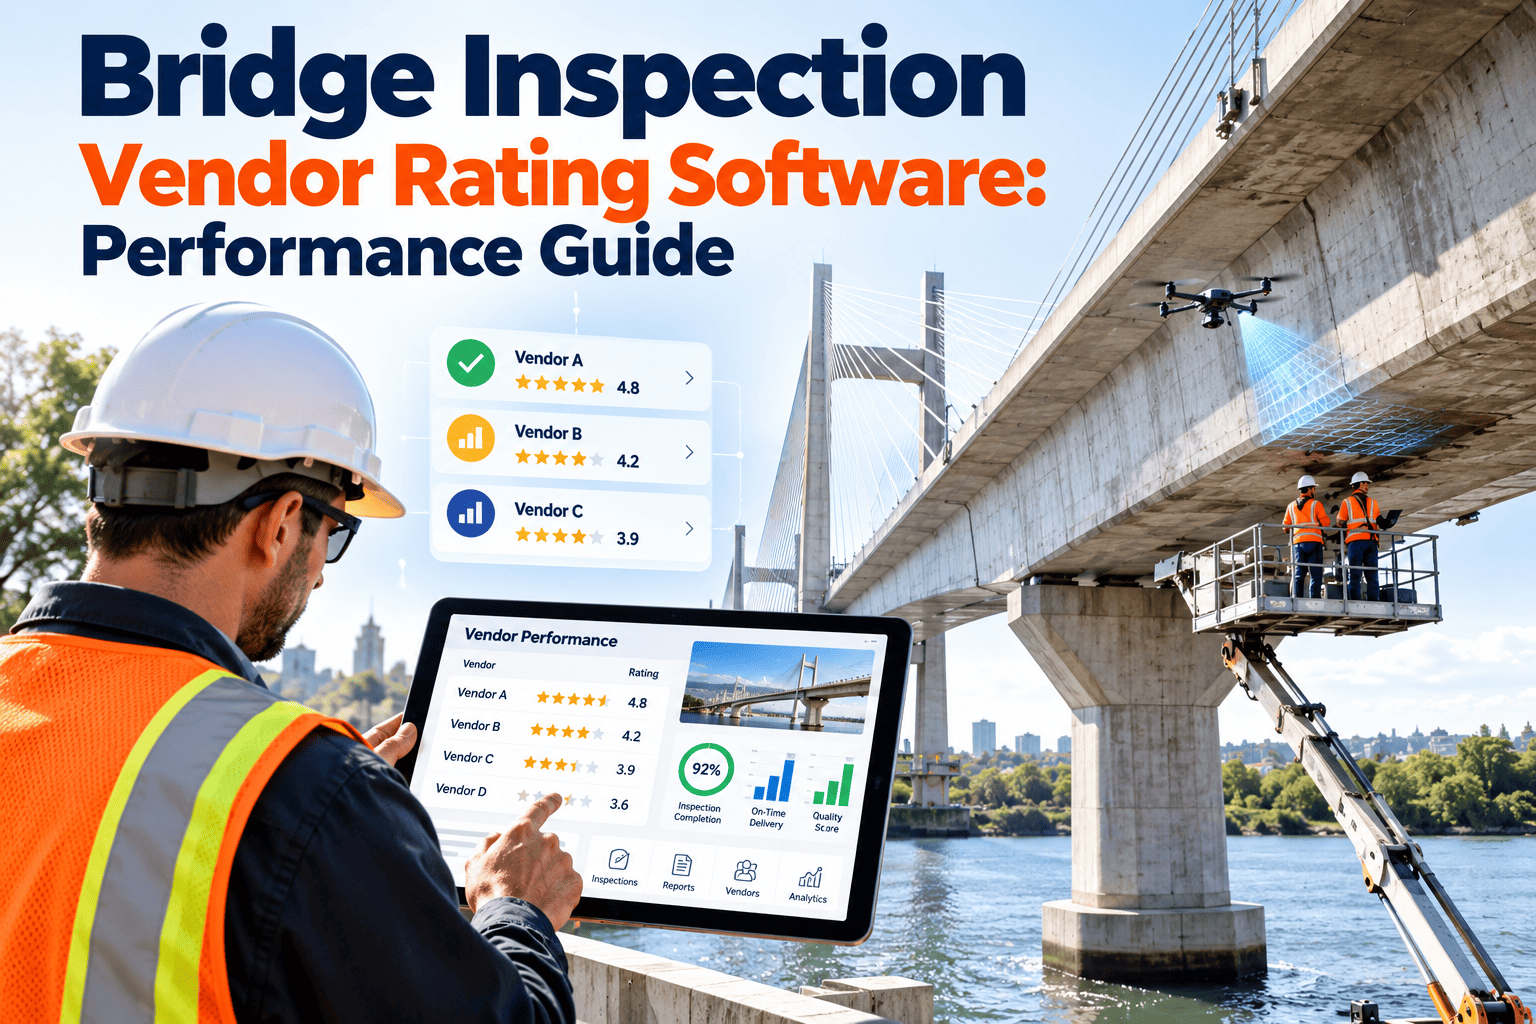
- Cost per vendor, normalized by structure count and inspection type, to support contract renewal and procurement decisions
- Preventive versus reactive cost ratio, showing whether inspection findings are being converted into timely maintenance or deferred into costlier rehabilitation
- Condition trend versus spend trend, checked together to confirm that inspection dollars are correlating with real improvement rather than simply keeping pace with deterioration
Presented together, these four KPIs give a bridge program director a far stronger basis for a budget request than a single annual total — they show not just how much was spent, but whether it was spent well, which is the question most reviewing bodies are actually asking. A program that can answer it consistently, year after year, tends to have an easier time defending its budget than one that can only speak in program-wide averages.
Answer the cost question before your budget office asks it twice
Import your bridge inventory, tag every inspection by type and vendor, and generate cost reporting that holds up in a budget review.
Free 14-day trial · No credit card