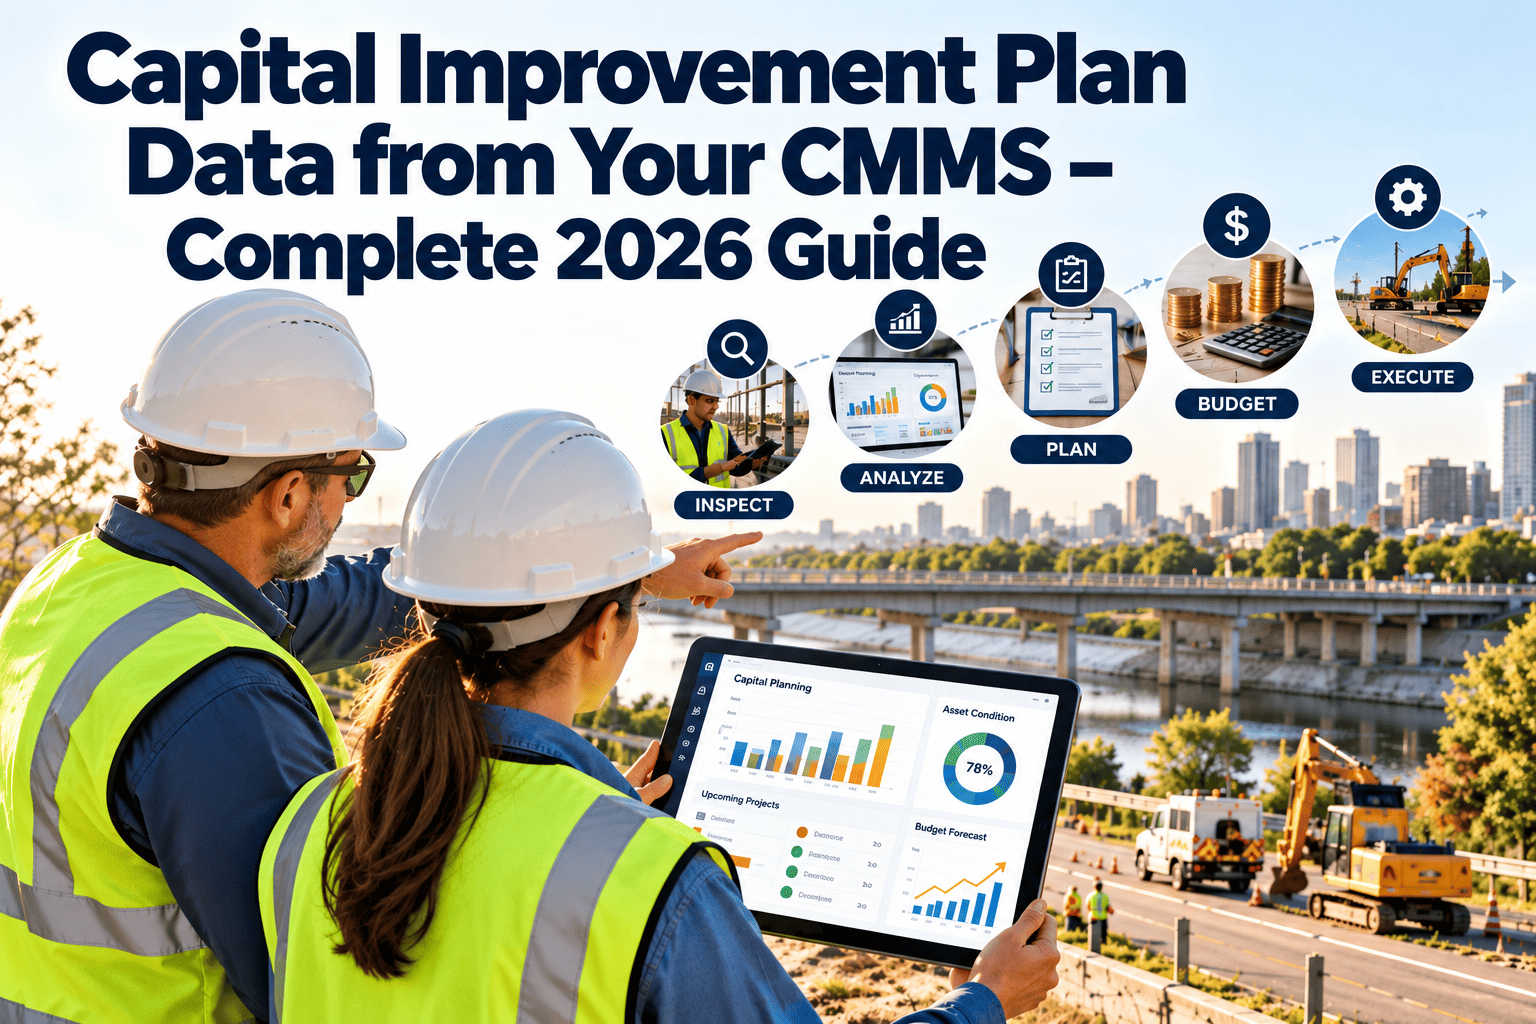
Every year a public works director walks into a budget hearing with a list of projects and walks out with a fraction of them funded — not because the needs were not real, but because the list looked like a wish list instead of an investment plan. A capital improvement plan built on departmental requests and spreadsheet guesswork cannot answer the one question a council always asks: prove this pipe, this roof, this pump needs replacing now rather than in five years. The answer already exists inside the maintenance system, in the form of condition scores, repair-cost history, and remaining-useful-life data that most agencies never connect to the CIP. Turning that operational record into defensible capital evidence is precisely what a CMMS-backed asset platform makes possible.
Build Your Capital Improvement Plan From Real CMMS Data
Stop defending infrastructure requests with anecdotes. Feed your capital improvement plan with the condition scores, repair-cost trends, and remaining-useful-life data already sitting in your maintenance system — and sequence replacements with evidence a council can approve.
Why Most Capital Improvement Plans Fail at the Hearing
A CIP does not fail because the projects are wrong. It fails because the plan cannot survive a skeptical question. When prioritization rests on politics or a long-tenured employee's memory instead of recorded condition data, the plan is fragile — and the backlog it was meant to address keeps compounding while deferred work grows several times more expensive.
The Data a Defensible CIP Actually Needs — and Where It Lives
Good data in, good CIP out. The problem is rarely that the data does not exist; it is that it sits across four to six disconnected systems. A CMMS is where the operational truth of each asset already accumulates — the challenge is channeling it into the planning process instead of leaving it in work-order history.
The Prioritization Scoring Matrix
The core of a data-driven CIP is a scoring matrix that converts a flat project list into a ranked portfolio. Each project is scored against weighted criteria, and the weighting is where condition data does its work — an asset in poor condition with high consequence rises to the top no matter who requested it.
| Scoring Criterion | What It Measures | CMMS Data Source | Typical Weight |
|---|---|---|---|
| Asset condition | How far the asset has degraded toward failure | Inspection condition score / FCI | 25–30% |
| Consequence of failure | Safety, service disruption, and regulatory exposure if it fails | Asset criticality rating | 20–25% |
| Cost trend | Whether repair spend is escalating year over year | Repair-cost history per asset | 15–20% |
| Remaining useful life | Years left before replacement is unavoidable | Age vs expected life calculation | 15% |
| Cost savings / ROI | Avoided emergency cost if funded now | Planned vs reactive cost delta | 10–15% |
From criteria score to final rank
Each criterion score is multiplied by its weight and summed into a single number — the same final-score logic public CIPs publish in their adopted plans. The output is a ranked list where every project carries a traceable line from asset condition to budget position, which is exactly what survives a public hearing.
OxMaint turns inspection scores, repair-cost history, and remaining-useful-life into a ranked, defensible project list — and keeps it current as condition changes. Walk into the next budget hearing with evidence behind every line.
Sequencing Replacements Across the Planning Horizon
A CIP is not a single-year budget — it is a rolling multi-year schedule, typically five to twenty years out, where the first year becomes the capital budget. Ranked projects get sequenced across that horizon so spending stays level and the highest-risk assets are addressed before they force an emergency.
Spreadsheet CIP vs CMMS-Backed CIP
The difference between the two approaches is not effort — teams building CIPs on spreadsheets work extremely hard. The difference is whether the plan can defend itself and whether it stays current without a manual rebuild every cycle.
- Condition assumed, not measured
- Rebuilt by hand every cycle
- Priority order is contestable
- Data goes stale within months
- Knowledge tied to one person
- Condition scored from inspections
- Re-scores from live work-order data
- Every rank traceable to evidence
- Always current, refreshed on schedule
- Survives staff turnover
How OxMaint Feeds the Capital Planning Process
Frequently Asked Questions
How does CMMS data make a capital improvement plan more defensible?
It replaces "we think it's failing" with recorded condition scores, repair-cost trends, and remaining-useful-life per asset — evidence a council can scrutinize. Start a free trial to see your assets scored from real data.
How often should a capital improvement plan be updated?
Annually at minimum. Condition data, revenue projections, and council priorities shift enough in twelve months that a static plan goes stale fast. Book a demo to see an always-current CIP view.
What's the typical planning horizon for a CIP?
Most municipal CIPs run five to twenty years, with the first year adopted as the capital budget. The rest is a rolling schedule re-sequenced as asset condition changes each cycle.
Can OxMaint score and rank projects for CIP prioritization?
Yes. Condition, criticality, cost trend, and remaining life feed a weighted scoring matrix that produces a ranked project list with a traceable line from asset data to budget position. Start free to build your scored register.
We have no digital asset condition data yet. Where do we start?
Begin with your highest-consequence asset class, inspect and score it in OxMaint, and let the CIP inputs build as work orders accumulate. The register grows into a full plan over time. Book a demo for a phased approach.
OxMaint turns the condition scores, repair history, and remaining-useful-life already in your maintenance system into a ranked, defensible capital improvement plan — and keeps it current as your infrastructure changes. Talk to our public sector team about your asset portfolio.