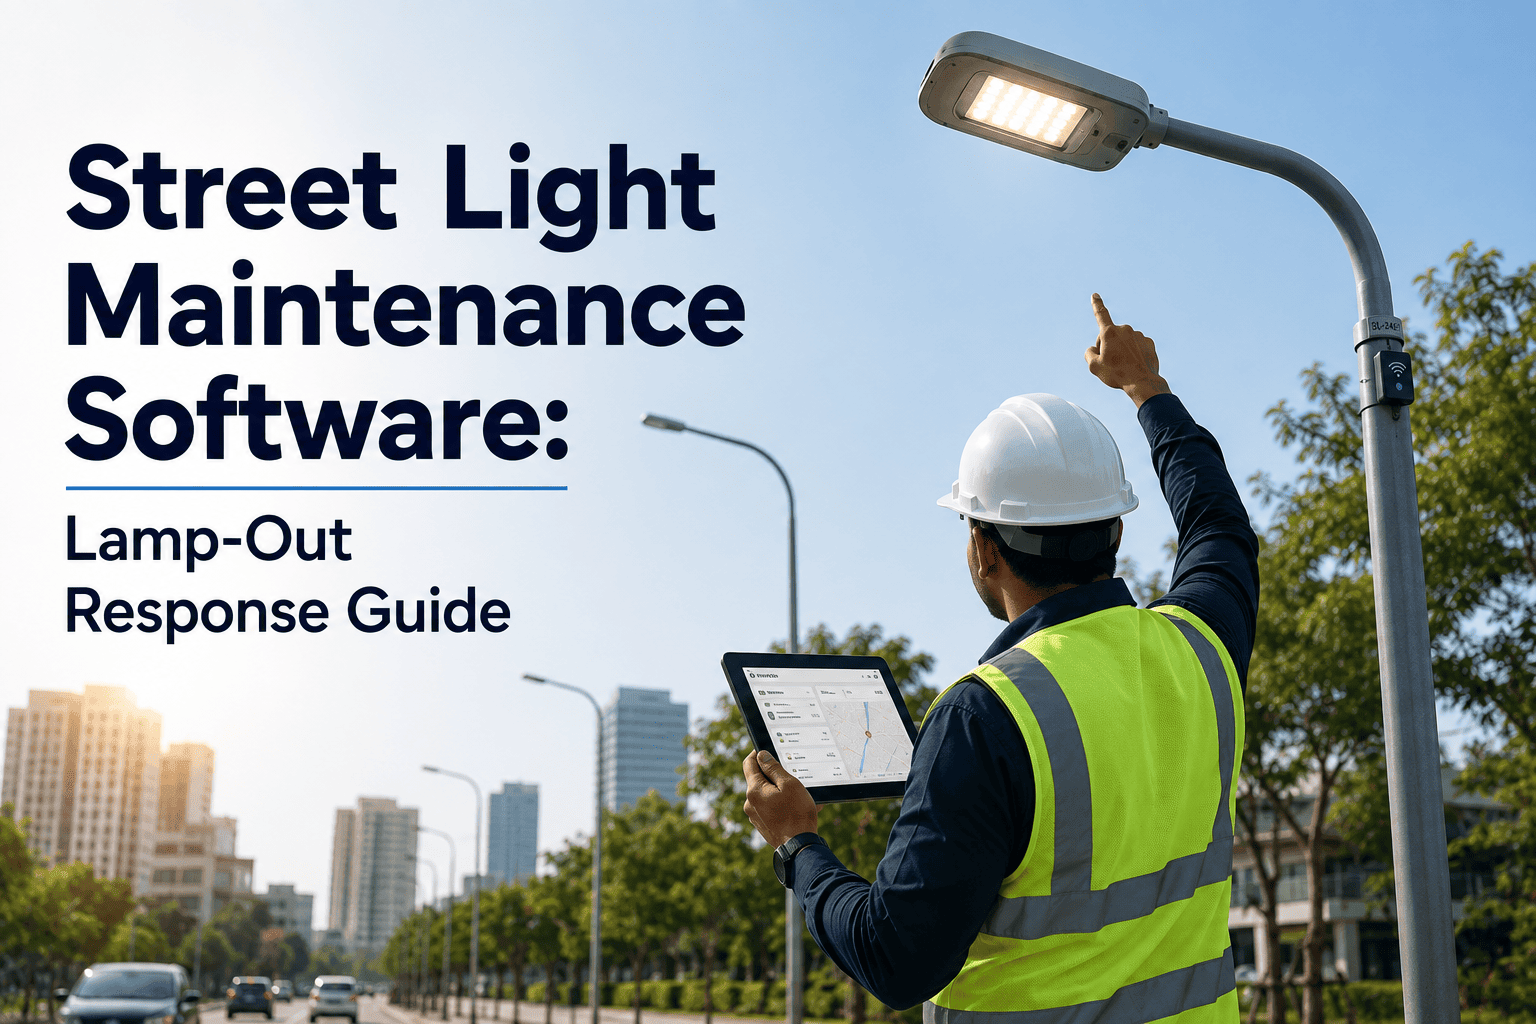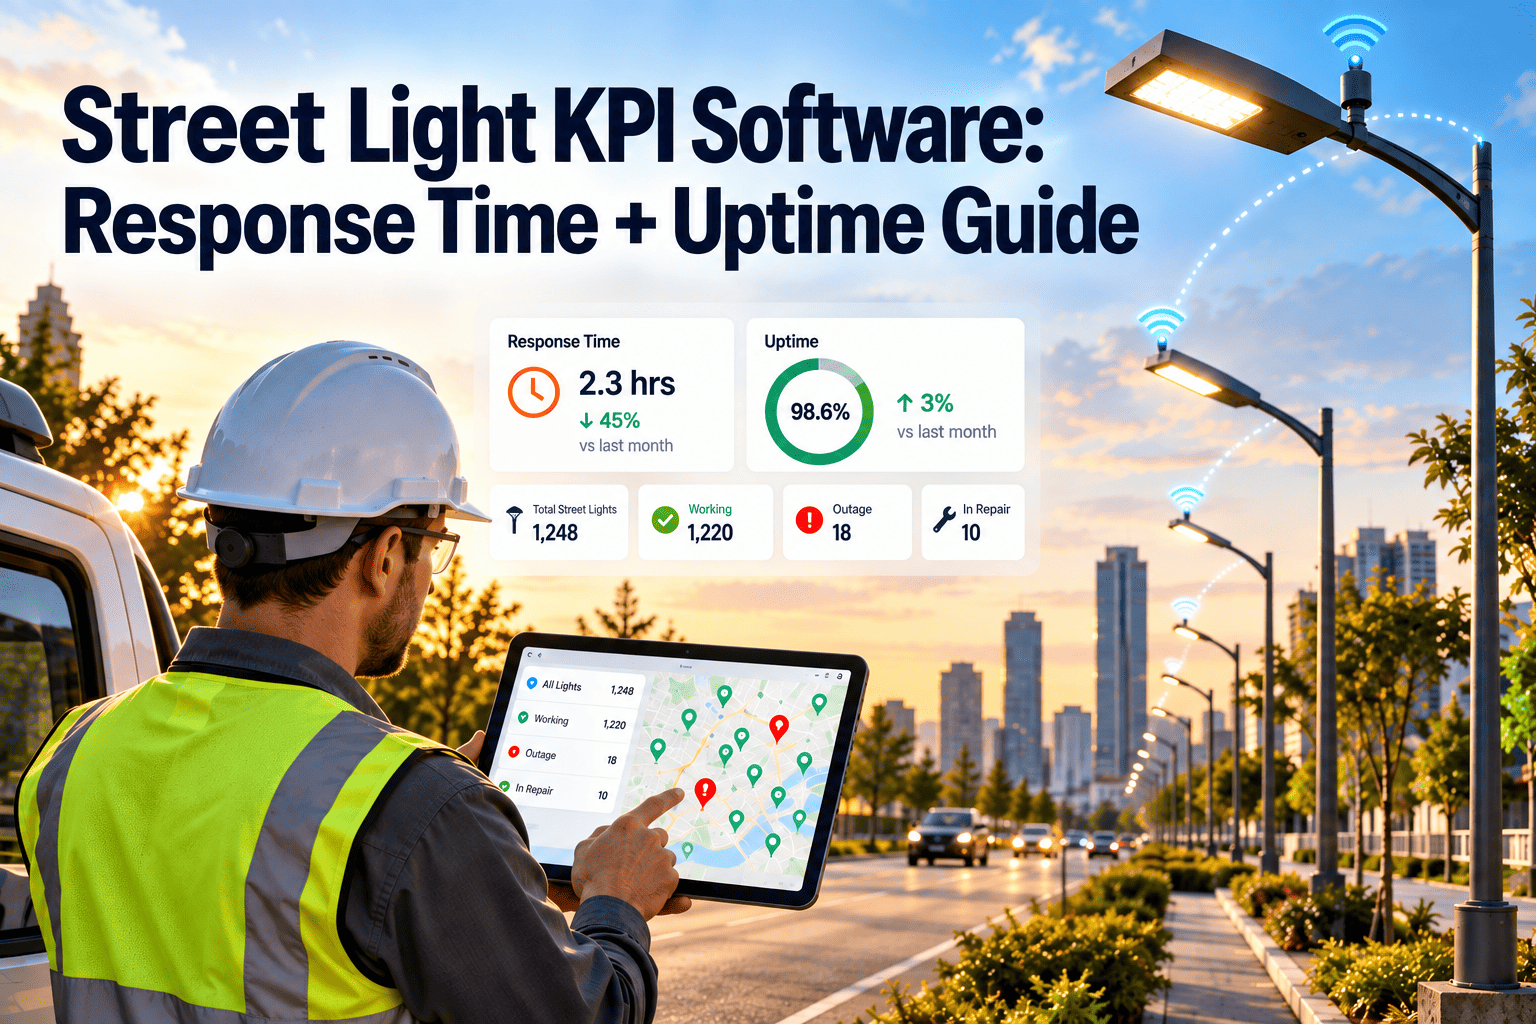
Few municipal services are as visible as street lighting. A dark corridor generates calls, council questions, and, when a crash or crime occurs, liability concerns. Yet many lighting programs still report only how many lamps were replaced, not how fast outages were fixed or how much of the fleet is lit on a given night. Three measures change that conversation: lamp-out response time, fleet uptime, and citizen complaint closure. Here is how street light KPI software makes them trackable, repeatable, and defensible at budget time.
Street Light KPI Software: Response Time and Uptime Guide
Measure how quickly outages are fixed, how much of the fleet stays lit, and how many complaints actually close, then take that evidence to council.
Why Street Lighting Programs Get Judged on Three Numbers
Council members and residents rarely ask about lumen output or driver specifications. They ask whether the light on their street works and how long it took to fix.
What goes wrong without KPIs
- Repairs are tallied by crew instead of by outage age.
- Duplicate complaints inflate call volume and hide real backlog.
- Repeat failures on the same circuit are treated as new problems.
- Budget requests rely on anecdotes about dark streets.
Outage Types That Distort Your KPIs
Not every dark light is the same problem. Mixing them in one average makes response time look better or worse than it really is.
| Outage type | Common causes | Repair path | KPI effect |
|---|---|---|---|
| Single fixture out | LED driver failure, photocell fault, lamp end of life on legacy fixtures | Bucket truck or pole-level repair | Sets the baseline response time |
| Circuit or series out | Breaker trip, control cabinet fault, failed contactor | Electrician at the cabinet | Drops uptime sharply until fixed |
| Underground cable fault | Insulation failure, water intrusion, dig-in damage | Fault location and cable repair | Long duration; report separately |
| Knocked-down pole | Vehicle impact, storm damage | Make safe, then replace with claim documentation | Safety-priority response |
| Vandalism or theft | Stolen copper wire, damaged access doors | Repair plus security measures | Repeat outages at the same locations |
| Utility-side outage | Service interruption on the feed | Coordinate with the utility | Exclude or tag as external |
Response Time: Measure the Clock in Stages
A single response time number hides where delays happen. Break the clock into stages so you can see whether the bottleneck is intake, dispatch, or the repair itself.
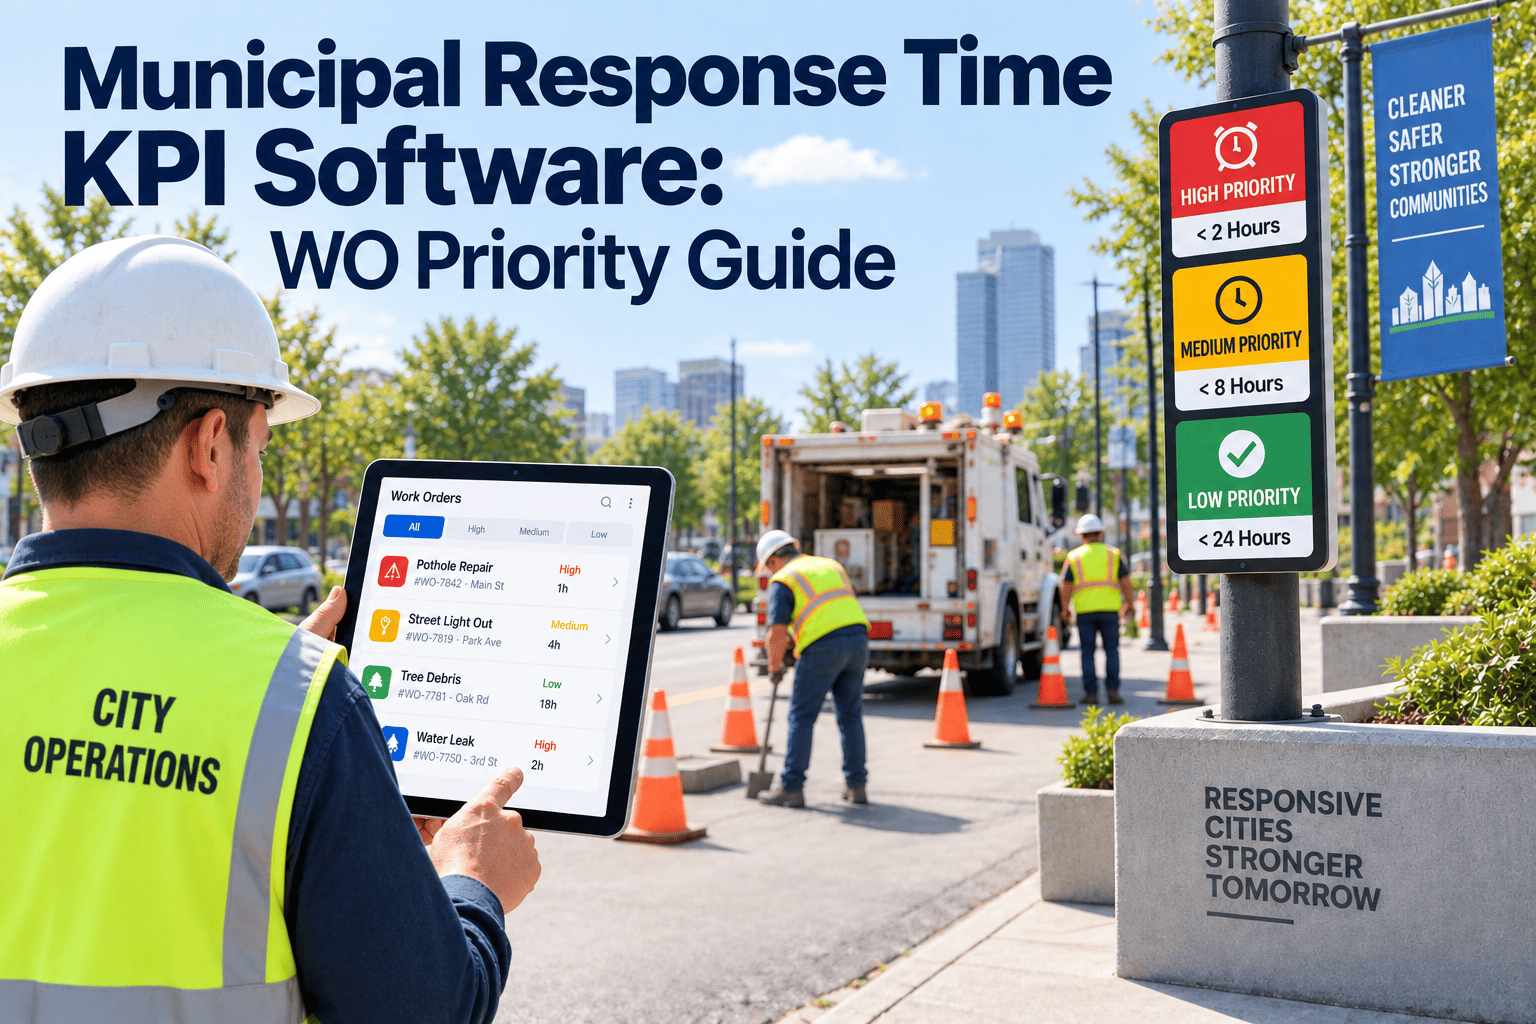
Priority tiers for response targets
The targets below are examples only. Set yours through council policy, contract terms, and crew capacity.
| Priority | Typical situation | Example target approach |
|---|---|---|
| Priority 1 | Downed pole, exposed conductors, hazard to the public | Immediate make-safe response, then permanent repair |
| Priority 2 | Multiple lights out at an intersection, school zone, or crosswalk | Shortest routine window |
| Priority 3 | Single fixture out on a local street | Standard routine window, batched by area |
Fleet Uptime: Formulas and Pitfalls
Pitfalls that distort uptime
- Unknown inventory: if the asset list is wrong, the denominator is wrong. Audit fixture counts by circuit.
- Complaint-only detection: uptime based on reports misses outages on low-traffic streets.
- Averaging away the pain: a strong citywide average can hide one corridor that stays dark for weeks.
- Ignoring repeats: track fixtures that fail more than once so root causes get fixed, not patched.
Citizen Complaint Closure: Closing the Loop
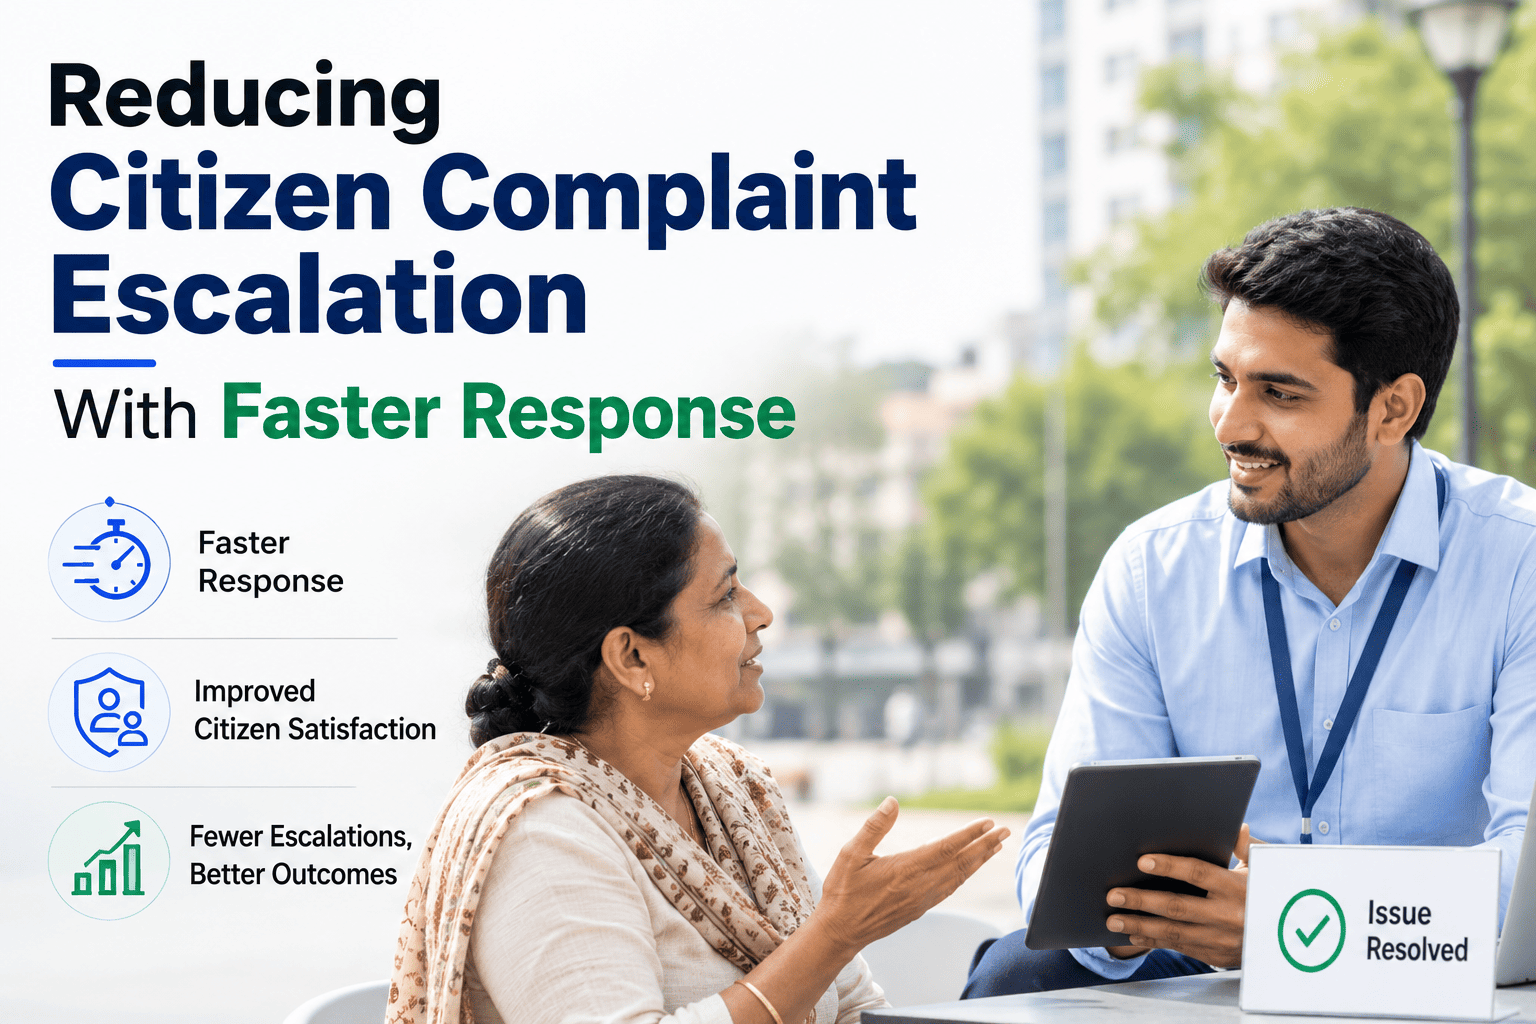
A complaint is closed when the light works and the resident knows it, not when the ticket is marked complete.
Trends Reshaping Lighting Performance Measures
LED conversion changes the failure mode
LED fixtures reduce routine relamping, but failures shift to drivers, surge protection, and connections. Track failure causes by fixture model so warranty claims and replacement planning have evidence.
Networked controls and telemetry
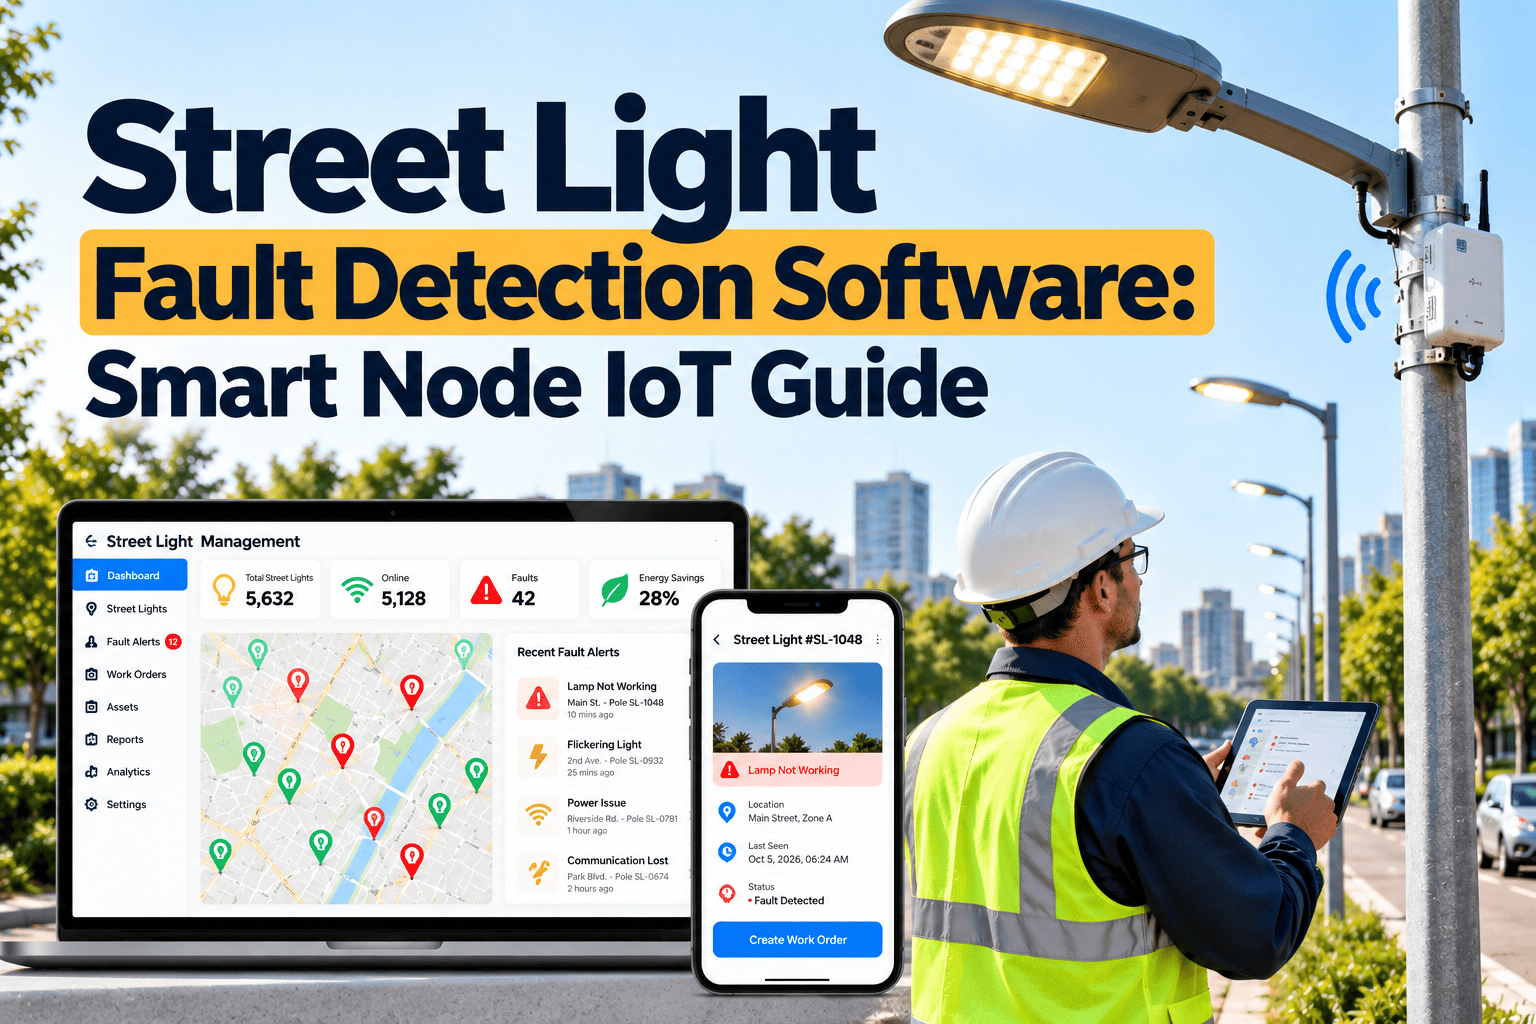
Many cities now use controllers on standard photocontrol receptacles or wireless nodes to report outages and energy use. These signals can create work orders automatically and improve uptime accuracy.
Dimming and dark-sky practices
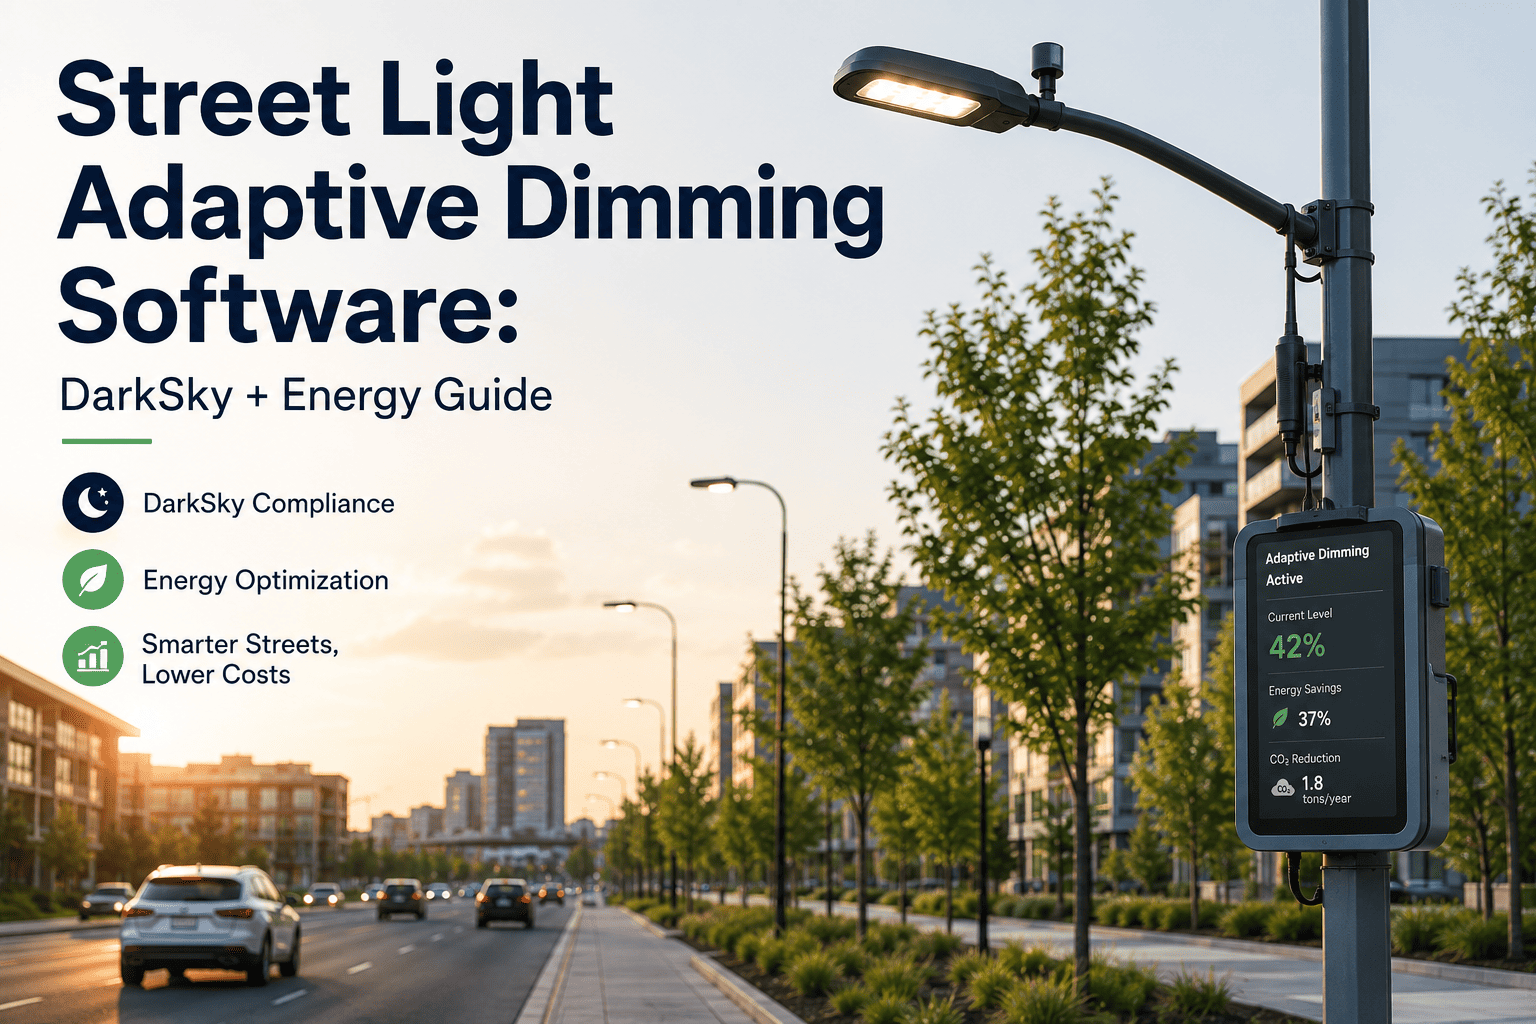
Adaptive dimming and shielded fixtures affect how you define "lit as designed." Record the intended schedule so dimmed fixtures are not counted as outages.
Building the Council Review Package
A budget hearing rewards clarity. Put the KPI story on one page, with backup detail available on request.
| Question from council | Anecdote answer | KPI evidence |
|---|---|---|
| Are outages fixed quickly? | Crews are busy and doing their best | Median and 90th percentile response by priority |
| Is the fleet reliable? | Most lights are working | Uptime by district with repeat-failure list |
| Do residents get answers? | We return calls when we can | Complaint closure rate and reopen count |
| Why do we need more funding? | Equipment is aging | Failure trend by fixture age, model, and cause |
One-page report layout
- Headline KPIs against targets, with the trend from the prior period.
- Backlog by age bucket and priority.
- Top repeat-failure circuits with proposed fixes.
- Cost per repair and the labor hours behind it.
How Oxmaint Supports Street Light KPI Tracking
Oxmaint maintenance management software connects the outage report, the fixture record, and the repair into one traceable chain.
KPI setup checklist
- Verify fixture inventory by circuit and district.
- Define priority tiers and clock start and stop rules.
- Tag external utility outages separately.
- Standardize failure cause codes.
- Schedule regular night inspections for uptime snapshots.
- Agree on the monthly report format before the budget cycle.