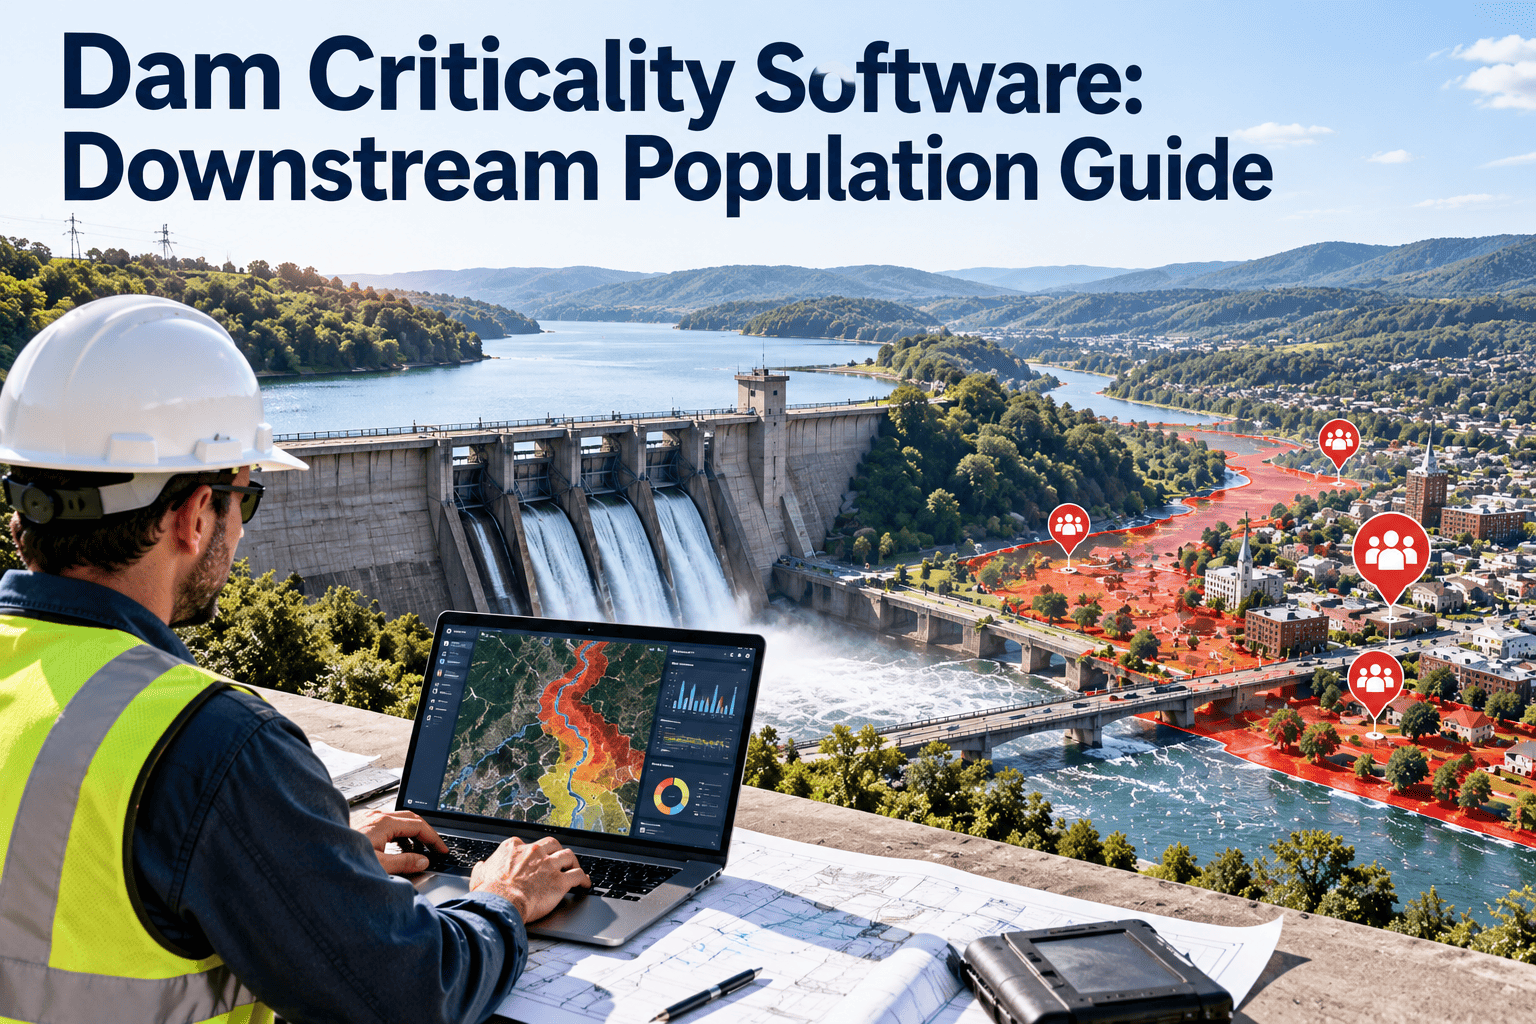
Dam criticality is the structured ranking of which dams deserve the most inspection effort, maintenance funding, and emergency planning attention based on what happens downstream if they fail or misoperate. Condition alone cannot answer that question. A dam in fair condition above a school, a highway, and a water intake can matter more than a dam in poor condition above open pasture. Owners of high hazard potential dams are expected to document that reasoning, tie it to their emergency action plans, and keep it current. The right dam criticality software turns that reasoning into a repeatable record instead of a one-time study that ages on a shelf.
Dam Criticality Software: Downstream Population Guide
Condition Tells You Likelihood. Criticality Tells You Consequence.
A condition rating describes how likely a structure is to develop a problem. Criticality describes how serious that problem becomes for people and property downstream. Dam safety programs need both views to decide where limited inspection hours and capital dollars go first.
- Worst-looking dam moves to the top of the list
- Low-consequence structures absorb scarce repair funds
- Downstream growth never changes the ranking
- Hard to explain to a board or regulator
- Condition and consequence are scored together
- Funds follow risk to people, lifelines, and economy
- Exposure data is refreshed when the valley changes
- Every ranking decision has a documented basis
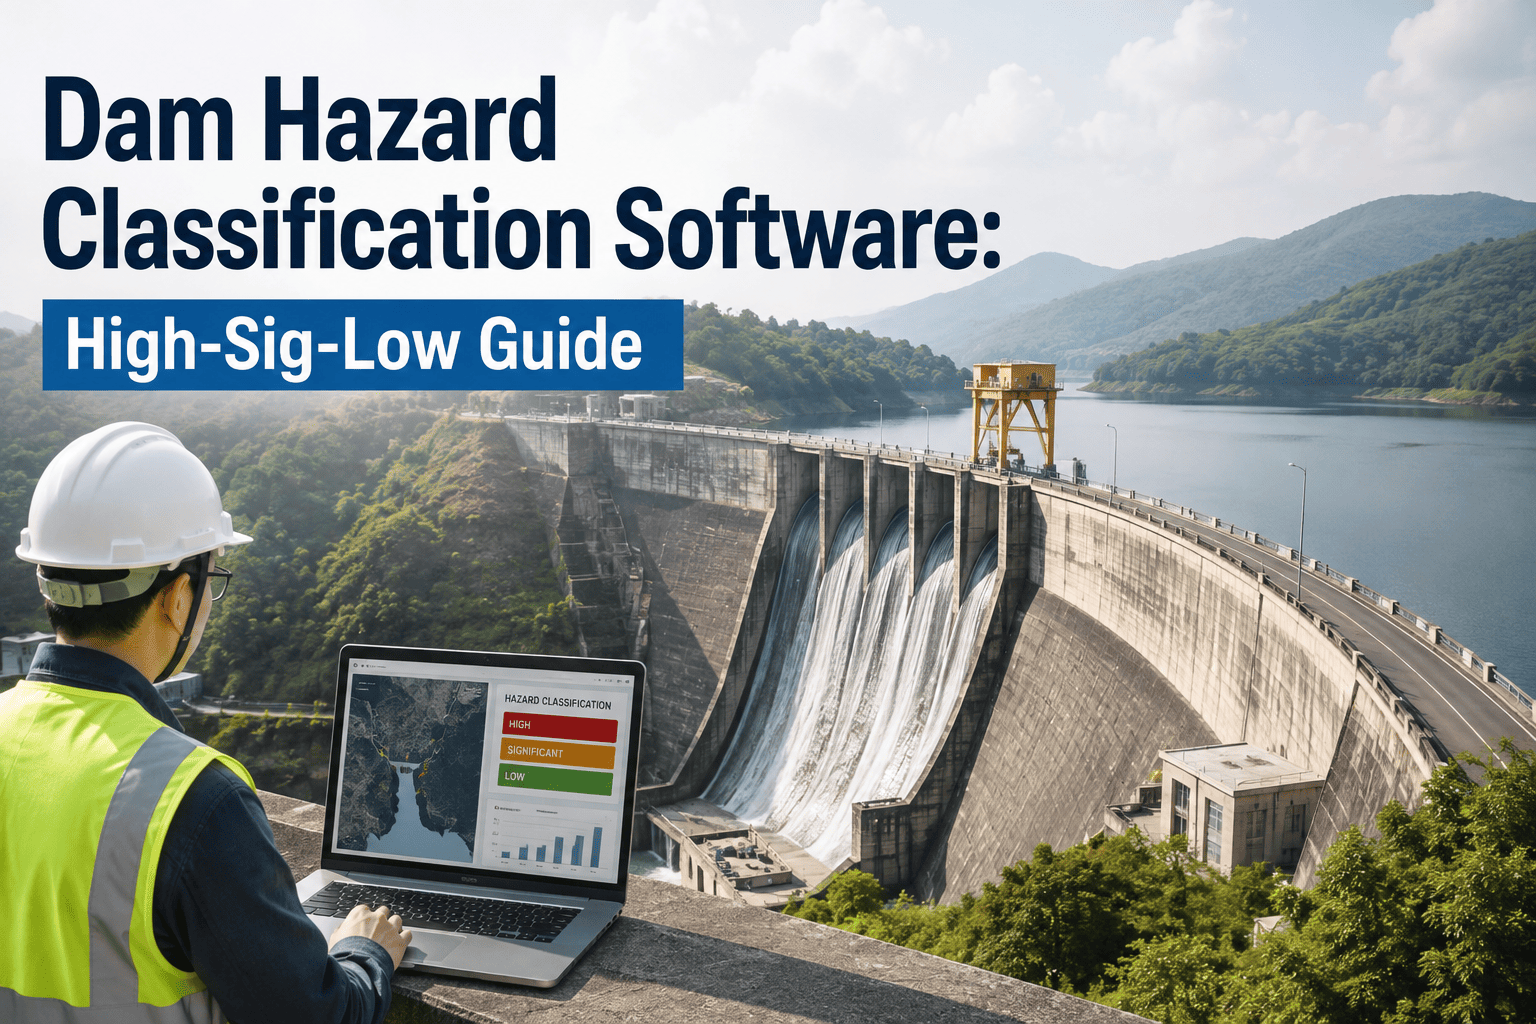
How Hazard Potential Classification Frames the Discussion
Most state dam safety programs build on the hazard potential classifications described in FEMA federal guidance. The classification reflects the consequences of failure or misoperation, not the probability that either will happen. State definitions and thresholds differ, so always work from your own program's regulations.
| Hazard class | Consequence meaning | Typical owner implication |
|---|---|---|
| Low | No expected loss of life; economic loss mostly limited to the owner's property | Lighter inspection cycle; emergency action plan often not mandated |
| Significant | No probable loss of life, but economic, environmental, or lifeline disruption is possible | Mid-level inspection cycle; some states require an emergency action plan |
| High | Probable loss of life from failure or misoperation | State EAP required in most programs, frequent inspections, periodic exercises, formal reporting |
Why the class alone is not enough
- Two high hazard dams can differ greatly in population at risk and warning time.
- Classification is a category; a criticality score ranks dams inside each category.
- Owners with large portfolios need that ranking to sequence work rationally.
Three Exposure Dimensions Every Criticality Record Should Hold
A defensible record captures downstream population, infrastructure exposure, and economic loss as separate fields with a source and a date.
Downstream population
- Permanent residents inside the inundation zone
- Seasonal and transient populations such as campgrounds and recreation areas
- Vulnerable occupancies including schools and care facilities
- Estimated warning and evacuation time
- Source and date of every population count
Infrastructure exposure
- Highways, bridges, and rail crossings in the flood path
- Substations, transmission lines, and pipelines
- Water intakes, treatment plants, and wastewater facilities
- Hospitals and emergency response facilities
- Downstream dams that could be overtopped in a cascade
Economic loss
- Direct damage to homes, businesses, and public property
- Business interruption and lost tax base
- Agricultural and environmental damage
- Loss of the dam's own service such as water supply or power
- Estimate method, assumptions, and review date
Building a Scoring Model a Regulator Will Recognize
A transparent model beats a clever one. Use weighted factors, document each weight, and calibrate with your state dam safety program. The weights below are illustrative, not a regulatory standard.
| Factor | What is scored | Illustrative weight | Typical data source |
|---|---|---|---|
| Downstream population | Persons at risk and vulnerable occupancy | 30% | Inundation study, census data, local planning records |
| Warning time | Time between breach and flood arrival | 15% | Breach analysis, EAP notification chart |
| Infrastructure exposure | Lifeline and transport assets in the flood path | 20% | GIS layers, utility owners |
| Economic loss | Property, business, agricultural, environmental | 15% | Loss estimates, assessor data |
| Structural condition | Latest inspection ratings and open deficiencies | 10% | Inspection reports, work orders |
| Operational reliability | Gate, spillway, and instrumentation performance | 10% | Work order history, readings |
Turning scores into tiers
Reading the Matrix: Where Condition Meets Consequence
Plotting each dam on a simple grid shows why two dams with the same condition rating need different responses. Rows show downstream consequence; columns show condition concern.
From State EAP Requirements to Daily Maintenance
Where an emergency action plan is required, typically for high hazard dams, the plan only works if maintenance keeps its assumptions true. Gates must open, notification equipment must work, and access roads must be passable.
Maintenance items that protect EAP execution
- Spillway gates, hoists, and operators tested under load
- Backup power for gates and monitoring equipment
- Sirens, radios, and other notification equipment checked and logged
- Piezometers, weirs, and survey monuments read on schedule
- Access roads, bridges, and crest surfaces kept passable in wet weather
- Vegetation, burrowing animals, seepage, and erosion managed before they escalate
Spreadsheet Criticality Versus a Managed Record
Many owners keep criticality in a workbook built for a past audit. It is accurate on the day it is finished and drifts from that day onward.
- Population counts copied from an old study with no date
- Scores stored apart from inspection findings
- Overdue inspections discovered during audits
- Deficiencies tracked in email and field notebooks
- Rankings rebuilt by hand each budget season
- Exposure fields carry a source and review date
- Scores sit on the asset beside inspections and work orders
- Tier-based schedules generate inspections automatically
- Every deficiency has an owner, priority, and due date
- Portfolio rankings refresh from live records
Hazard Creep: When the Downstream Valley Changes
Dams built in rural settings often end up above subdivisions, commercial strips, and new roads. Downstream development can raise the consequence of a failure without any change in the dam itself.
What to Configure in Oxmaint for Dam Criticality Management
Oxmaint is a maintenance management platform, so it holds the criticality record where the work actually happens. These are the capabilities most relevant to dam owners.
| Capability | How it supports dam criticality |
|---|---|
| Asset management | One record per dam and per component, with hazard class, tier, state ID, and downstream exposure fields |
| Preventive maintenance | Schedules tied to tier for gate exercising, lubrication, and instrument checks |
| Mobile inspections | Routine, formal, and post-storm inspection checklists with photos captured on site |
| Work orders | Corrective work prioritized by criticality, with owner, status, and closure evidence |
| Inventory | Spare seals, hoist parts, and instrument components tracked for fast repair |
| Compliance records | Inspection reports, EAP reviews, and exercise logs retained against each dam |
| Dashboards and reporting | Portfolio ranked by tier, overdue work, and open deficiencies by dam |
| Condition-based workflows | Work triggered when logged readings such as seepage or pore pressure cross set limits |
Common Data Gaps That Weaken Criticality Scores
Most scoring problems trace back to missing or stale inputs rather than a flawed formula. Find these gaps early and assign an owner to close each one.
| Data gap | Why it matters | Practical fix |
|---|---|---|
| Undated population counts | Reviewers cannot tell whether the figure reflects today's valley | Store the source and review date beside every count |
| Inundation maps stored as loose files | Field staff and emergency managers may use different versions | Attach the current approved map to the dam record |
| Infrastructure lists with no owner | Notification during an emergency stalls without a named contact | Record an owner and contact for each exposed lifeline |
| Economic estimates with no method | Numbers cannot be defended or updated consistently | Document the method and assumptions in the record |
| Inspection findings kept as PDF only | Deficiencies never become tracked work | Convert each finding into a work order with a priority |
Technology Trends Shaping Dam Criticality Work
Several tools now make exposure data easier to gather and keep current. A maintenance platform gives that data a permanent home.
Questions to ask before choosing a platform
- Can hazard class, tier, and exposure fields be configured on each dam record?
- Do inspection schedules adjust when a tier changes?
- Can findings from a formal inspection become prioritized work orders in one step?
- Can leadership see the portfolio ranked by criticality without manual assembly?
- Are reports easy to produce for the state program and for your governing board?
KPIs That Show Criticality Management Is Working
Choose a small set of measures and review them on a fixed cadence with leadership.
Who Owns Each Part of the Criticality Record
Clear ownership keeps scores from going stale. Assign each input to a role and review it at a fixed interval.
| Role | Responsibility | Review rhythm |
|---|---|---|
| Dam safety engineer | Hazard classification, breach analysis, inundation mapping, tier approval | Annually and after major change |
| Emergency manager | Contact lists, notification charts, exercises, downstream coordination | Annually and after each exercise |
| Maintenance supervisor | Preventive schedules, corrective work orders, parts availability | Monthly for Tier 1 and Tier 2 |
| Asset or finance lead | Economic loss estimates, backlog by tier, capital requests | Each budget cycle |
Annual Criticality Review Checklist
Use this list each year for every dam, starting with Tier 1 and high hazard structures.