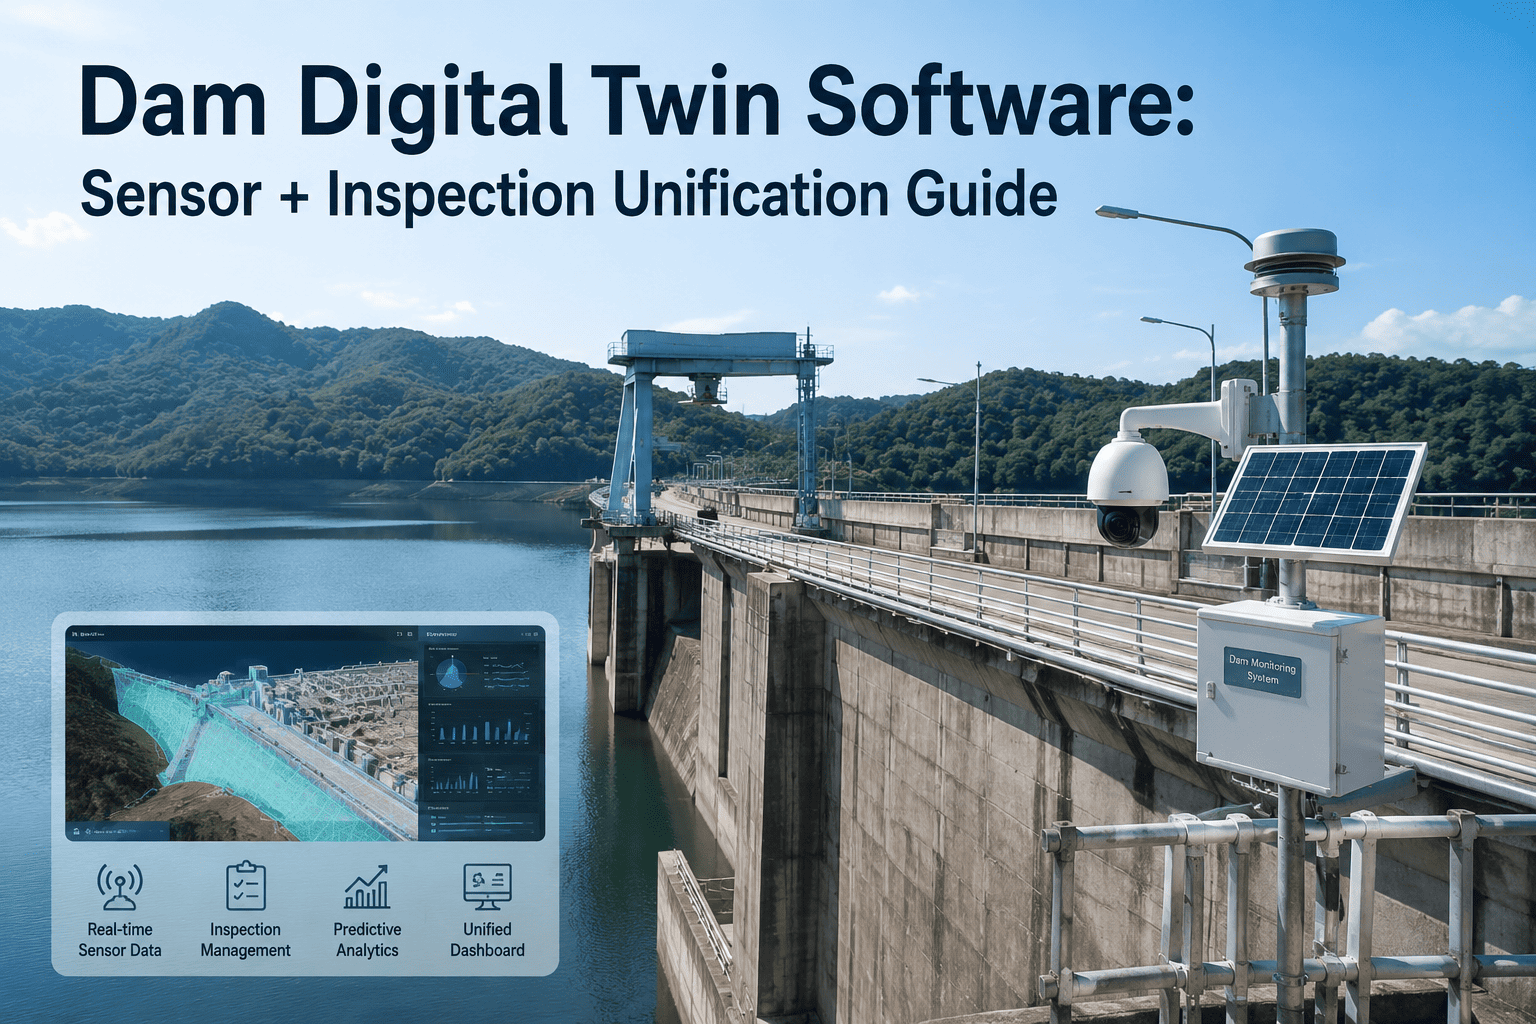
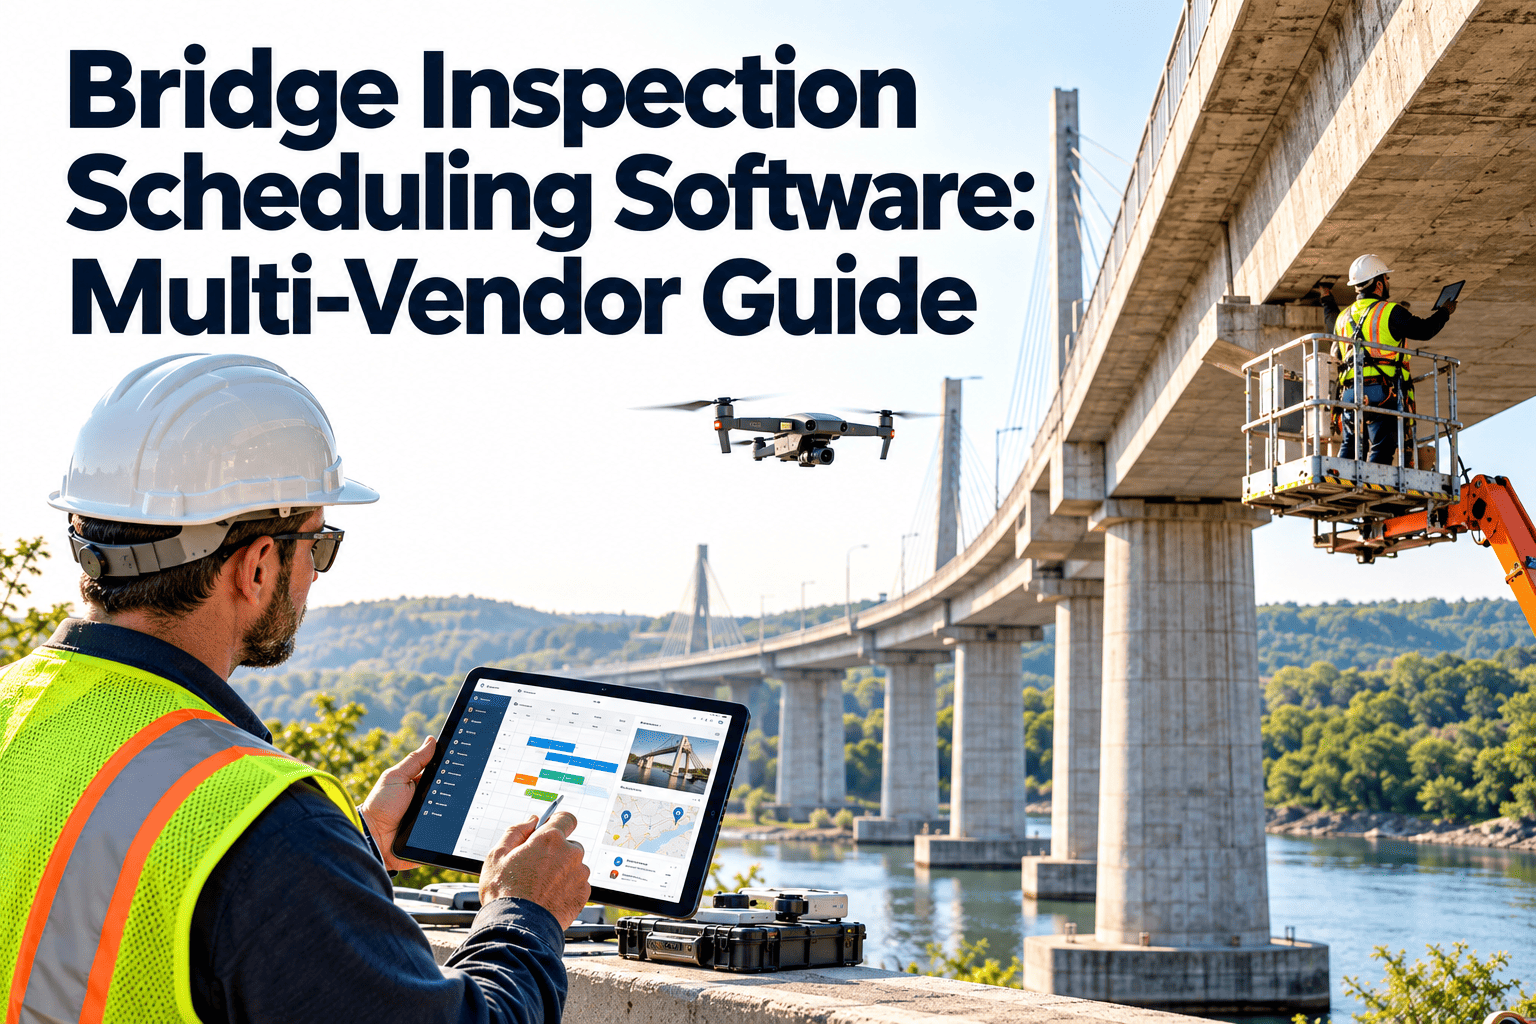
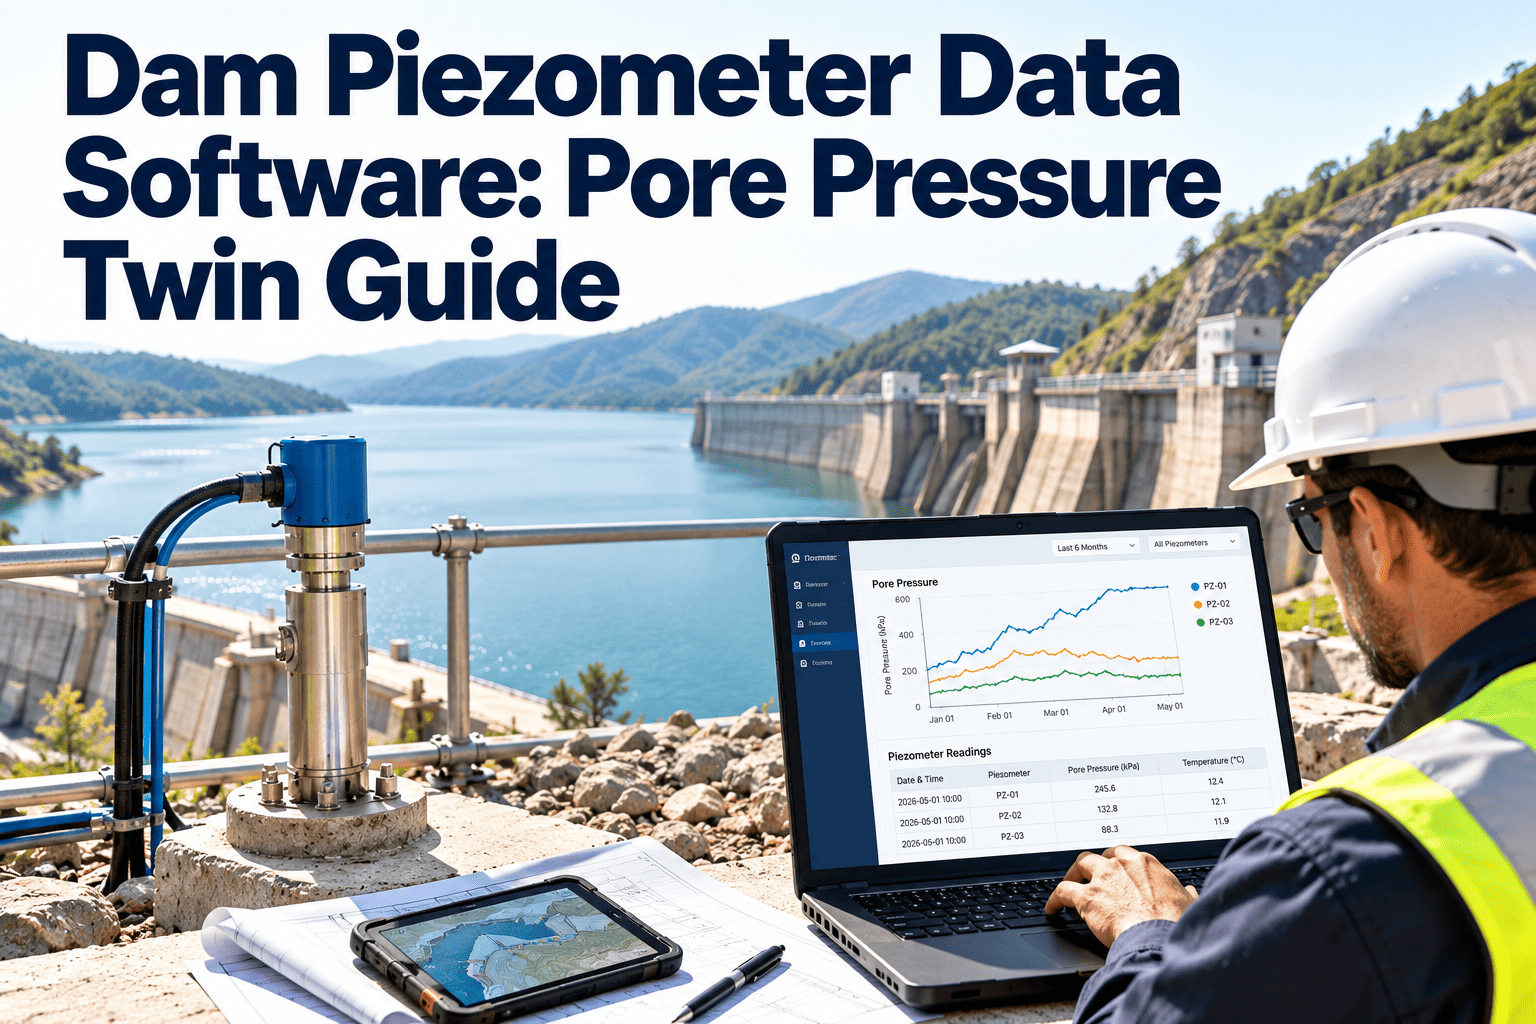
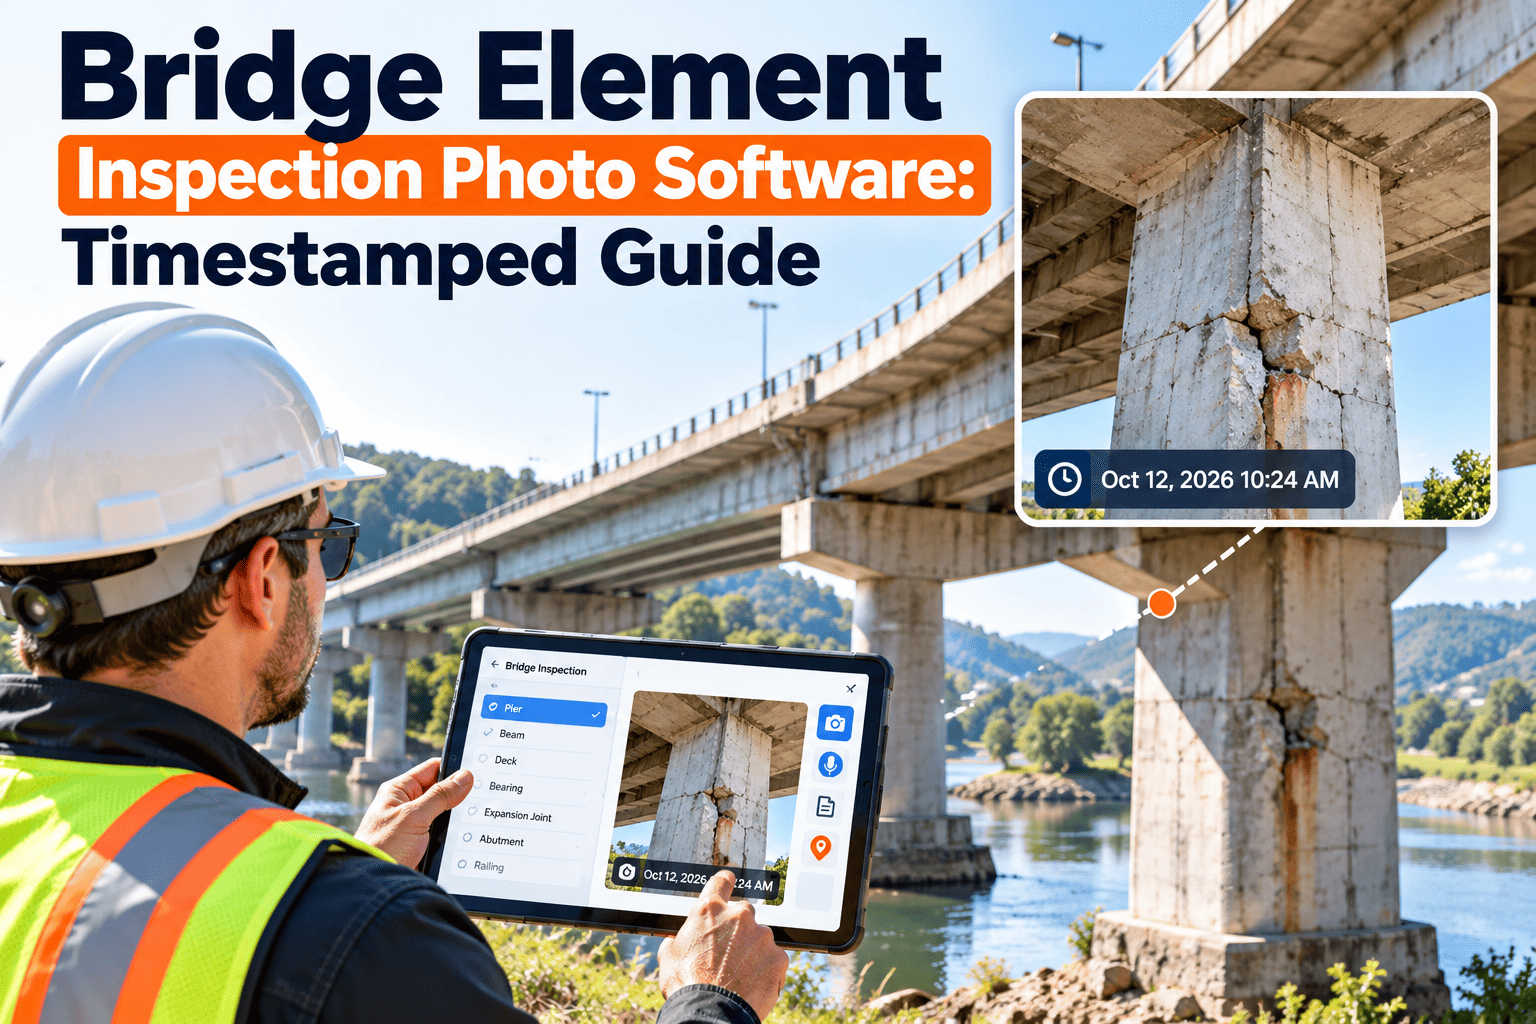
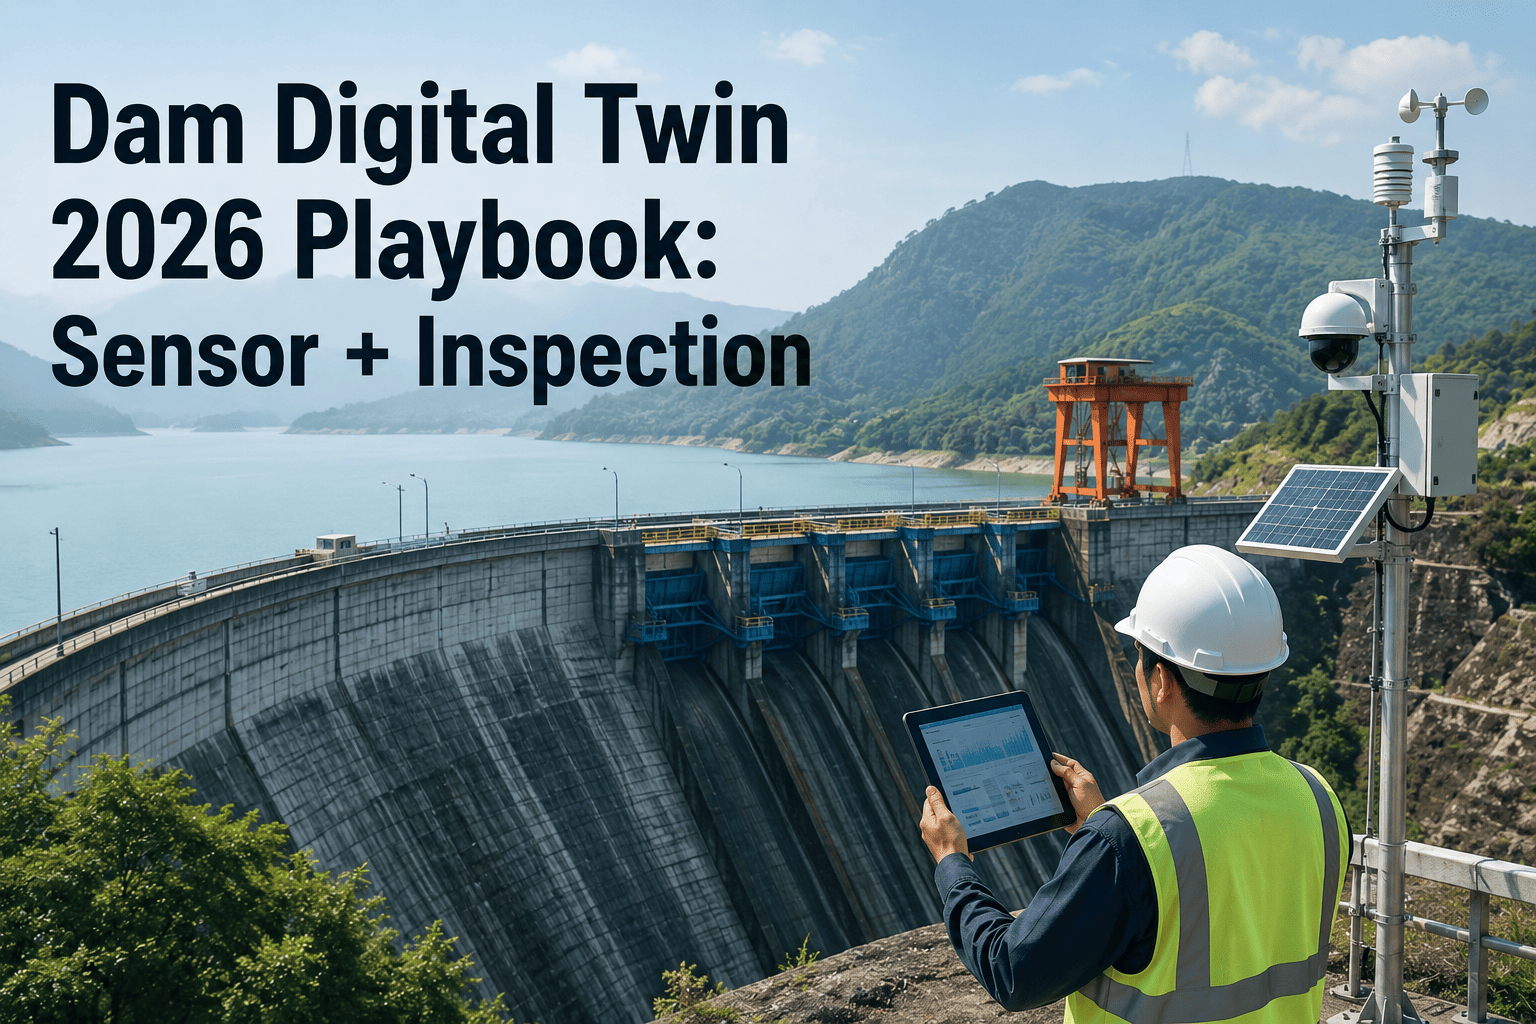
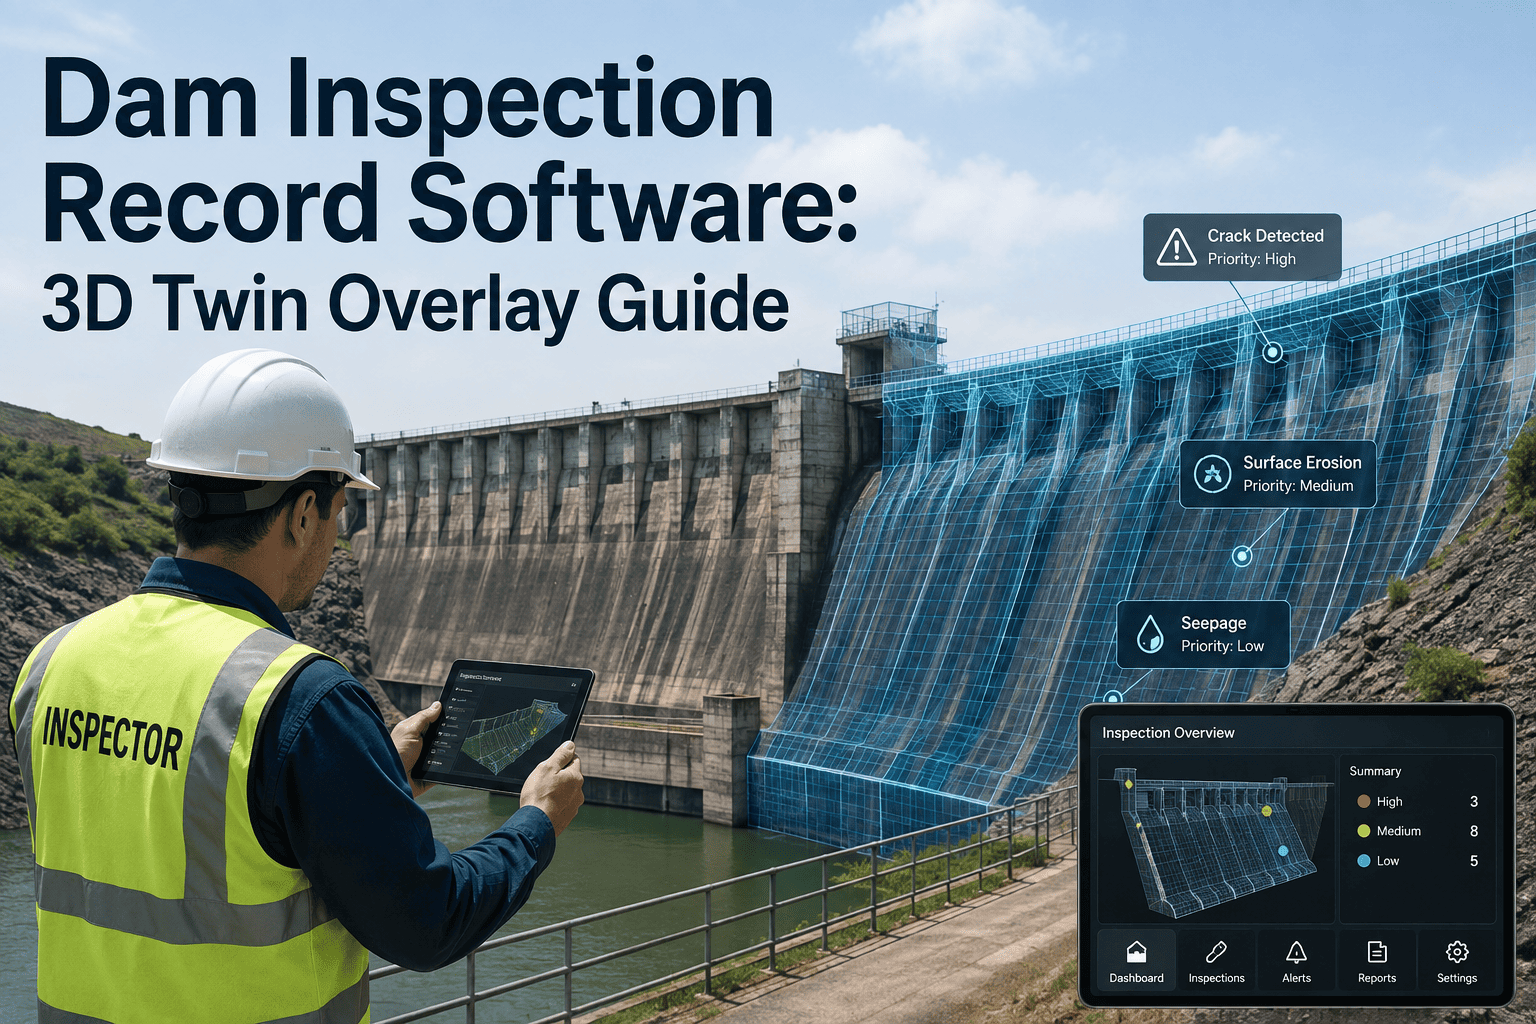
A single embankment dam can carry dozens of piezometers, seepage weirs, inclinometers, and crackmeters, each one logging readings on its own schedule, in its own format, often by a different field crew than the one who filed last month's periodic inspection report. Dam safety programs at USACE and Reclamation are built on risk-informed decisions, but a risk-informed decision is only as good as the data feeding it, and most dam owners are still reconciling sensor spreadsheets against PDF inspection reports by hand before a review board meeting. A dam digital twin closes that gap by pulling piezometer, seepage, inclinometer, and inspection data into one live model of the structure's behavior, so an unusual reading and the maintenance history around it sit in the same view instead of three different filing cabinets. This guide walks through how that unification actually works, and you can see it built around a real dam profile at https://calendly.com/oxmaintapp/30min.
Dam Safety · Digital Twin 2026
Dam Digital Twin Software
Unify piezometer readings, seepage flow, inclinometer movement, and inspection findings into one living model reviewers and engineers can both trust.
The Four Signal Streams
What a Dam Digital Twin Actually Unifies
Every dam instrumentation program is built around a handful of sensor families, plus the human inspection record that gives those readings context. A digital twin does not replace any of these — it gives them one shared timeline so a spike in one signal can be checked against every other signal from the same week.
01
Piezometers
Track pore water pressure and uplift beneath the structure. Weekly and monthly readings compared against baseline trends are the earliest warning of an internal seepage path forming.
02
Seepage Weirs
Measure flow rate and turbidity at drainage and toe locations. A rising flow rate combined with cloudy water is one of the clearest signs of internal erosion in an embankment.
03
Inclinometers
Record lateral movement and deformation inside the embankment or foundation over time, flagging slope instability well before it becomes visible at the surface.
04
Inspection Records
Periodic inspection reports, photos, and engineer notes provide the visual and judgment-based context that raw sensor numbers alone cannot capture.
The Problem Today
Why Dam Owners Struggle to See the Full Picture
Readings Live in Isolated Systems
Piezometer logs sit in one spreadsheet, seepage weir readings in another, and inclinometer data in a third format entirely, so comparing them for the same week takes manual cross-referencing every time.
Inspection Reports Stay On Paper
Periodic inspection findings are often filed as standalone PDF reports, disconnected from the sensor trends that were active at the time of the walk-down, losing the correlation engineers actually need.
Thresholds Are Checked Manually
Without a connected system, someone has to remember to compare this month's reading against the historical baseline, which means slow-developing trends can go unnoticed for months.
Review Boards Get an Incomplete Story
When sensor data and inspection findings are presented separately, risk-informed review boards spend more time reconstructing context than actually evaluating the dam's condition.
See The Twin In Action
Watch Sensor Data and Inspection History Meet in One View
Oxmaint connects data loggers, manual field readings, and inspection records into a single asset timeline for every monitored structure at your dam.
How It Works
Building the Twin From Raw Sensor Data to Risk-Informed View
1
Map Every Instrument to the Structure
Each piezometer, seepage weir, and inclinometer is registered against its physical location on the dam, so every reading carries context about where on the structure it came from.
2
Bring In Readings, Manual and Automated
Data logger feeds and manually recorded field readings both flow into the same record, so crews without automated telemetry are not left out of the twin.
3
Attach Inspection Findings to the Same Timeline
Periodic inspection reports, photos, and engineer notes are logged against the same dates as sensor readings, so a walk-down finding and the piezometer trend from that week sit side by side.
4
Flag Deviations Against Baseline
Each instrument's historical baseline is used to flag readings that drift outside expected range, giving engineers an early signal instead of waiting for the next scheduled comparison.
5
Export the Full Record for Review
Sensor trends, inspection history, and maintenance actions export together, giving risk-informed review boards one connected story instead of three separate documents to reconcile.
Before vs After
What Changes When Sensor and Inspection Data Share One System
| Activity |
Disconnected Systems |
Dam Digital Twin |
Change |
| Comparing piezometer and seepage trends |
Manual, spreadsheet by spreadsheet |
Same timeline, same view |
Faster correlation |
| Linking inspection findings to sensor data |
Separate PDF reports |
Attached to the same asset record |
Full context |
| Spotting a reading outside baseline |
Depends on manual review timing |
Flagged against historical baseline |
Earlier signal |
| Preparing a review board packet |
Days of document assembly |
Exported directly from the twin |
Faster preparation |
| Instrument maintenance history |
Tracked separately from readings |
Logged against the same instrument record |
One source of truth |
Where This Applies
Digital Twin Coverage Across Dam and Levee Types
Embankment
Earthfill and Rockfill Dams
Piezometer, seepage weir, and inclinometer data from the embankment and foundation are unified against inspection findings, giving engineers a single view of internal erosion and slope stability risk over time.
Concrete
Concrete Gravity and Arch Dams
Crackmeter, joint meter, and uplift pressure readings sit alongside structural inspection history, helping engineers track deformation and joint movement trends across seasonal water level changes.
Levee
Levee Systems
Underseepage and relief well monitoring points along a levee reach are tracked as one connected system, matching the way USACE levee monitoring programs are structured across long linear assets.
Spillway
Spillways and Outlet Works
Mechanical and structural inspection findings on gates, hoists, and outlet conduits connect to the same asset record as the instrumentation monitoring nearby embankment or foundation behavior.
Team Feedback
What Dam Safety Teams Say About Unified Monitoring
We used to walk into review meetings with a stack of separate reports and hope the story held together. Now the piezometer trend and the inspection note from the same week are on one screen, and that changes the whole conversation.
Our field crews still take manual readings at several instruments. Having those manual entries land in the same system as the automated logger data meant we finally had one complete record instead of two partial ones.
Common Questions
Dam Digital Twin Software: Frequently Asked Questions
No. The twin sits alongside existing data loggers and telemetry, pulling readings in through standard integrations. Manual field readings can also be entered directly, so instruments without automated telemetry are still fully represented. Book a demo at https://calendly.com/oxmaintapp/30min to review your current instrumentation setup.
Yes. Inspection findings, photos, and notes are logged against the same asset and date as the relevant sensor readings, so a walk-down observation and the instrument trend from that period stay connected permanently.
Baselines are built from each instrument's historical reading history, then reviewed and adjusted by your engineering team, so deviation flags reflect the actual behavior pattern of that specific piezometer, weir, or inclinometer.
Yes, structures can be grouped by watershed, district, or ownership, so a multi-dam operator or a levee district covering several reaches can manage every structure from one connected system. Sign up at https://app.oxmaint.ai to set up your first structure.
No, you can begin logging current readings immediately and the twin builds trend history going forward. Existing historical records can also be imported to establish baselines faster for long-monitored instruments.
Start Unifying Your Monitoring Data
Give Your Engineers and Reviewers One Connected View
Stop reconciling piezometer spreadsheets against inspection PDFs before every review. Bring sensor readings and inspection history into one living record of how your dam is actually behaving.