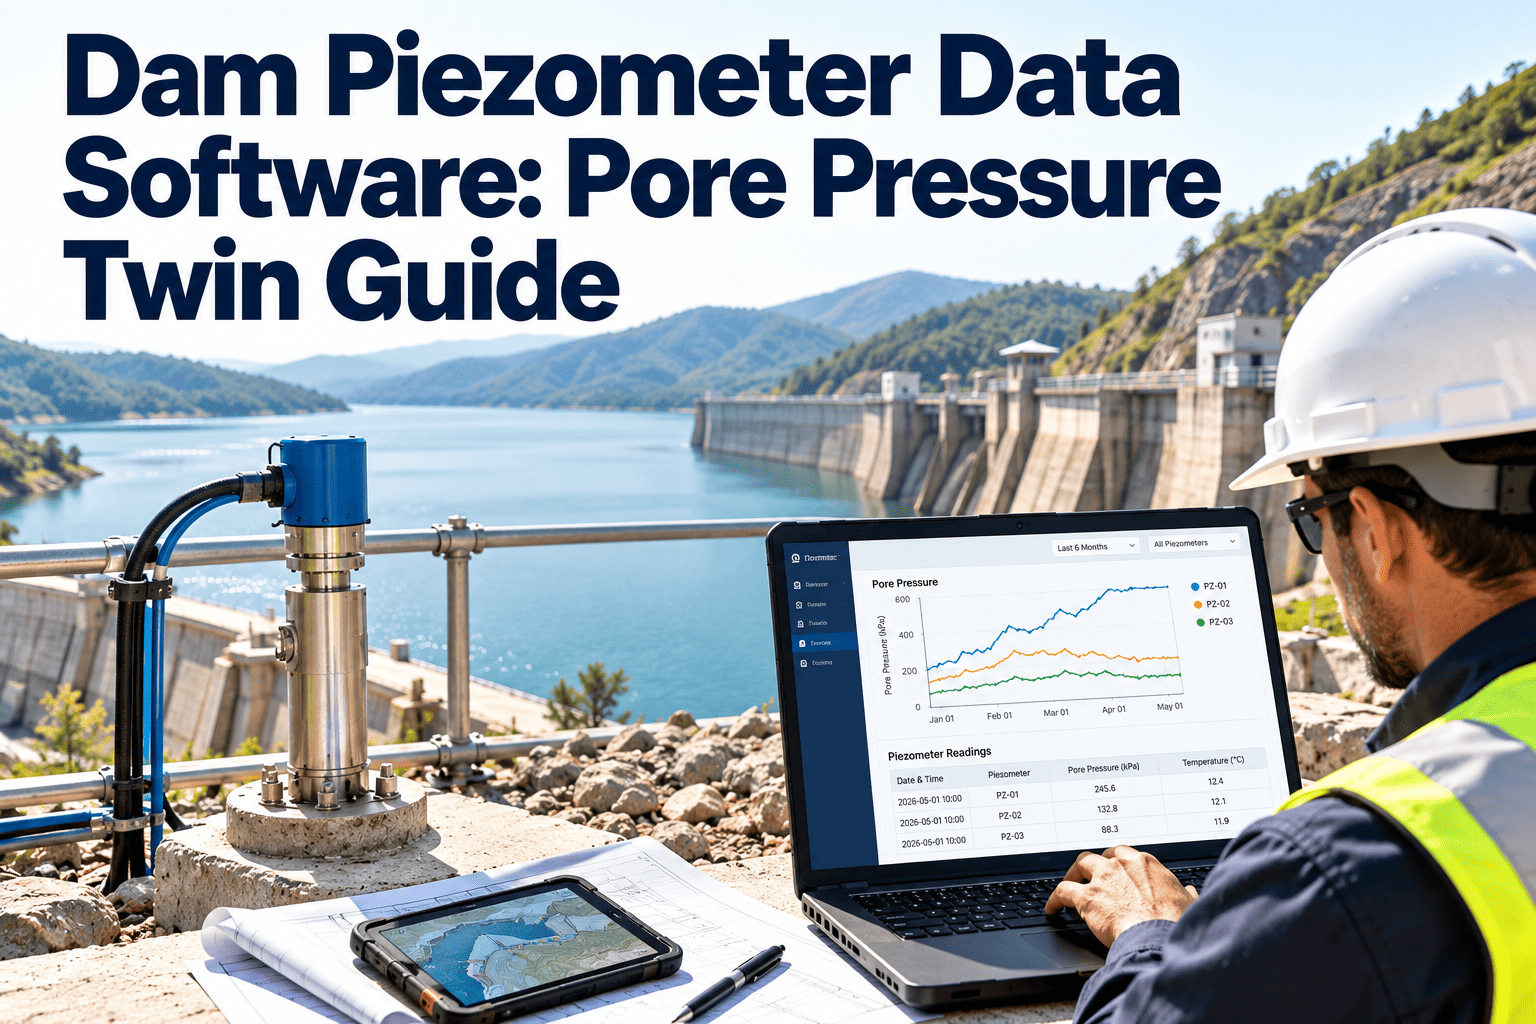
Dam piezometers measure the water pressure held inside an embankment, its foundation, and its abutments, and that pressure is one of the earliest signals of how a dam is behaving. The readings only help when they are complete, comparable from year to year, and tied to the exact instrument that produced them. Many dam owners still keep those readings across spreadsheets, logger exports, and consultant reports that rarely meet in one place. This guide shows how to organize piezometer data and pore pressure trends around one asset record per instrument. Teams building that record can start in a maintenance management workspace designed around assets, inspections, and work orders.
Dam Safety Instrumentation · Pore Pressure Monitoring
Dam Piezometer Data Software: Pore Pressure Twin Guide
Link every piezometer on every abutment and foundation to one asset record, so pore pressure trends, calibration history, and maintenance work stay together and are ready for dam safety review.
P-1
P-2
P-3
P-4
P-5
Illustrative layout of piezometric levels across a dam section. Not measured data.
Why Pore Pressure Matters
What Piezometer Readings Tell You About an Embankment
Water inside a dam is not a problem by itself. The concern is how much pressure it exerts and whether that pressure is changing in ways the design did not expect.
Stability depends on effective stress
Higher pore pressure reduces the effective stress that holds soil and rock together. That lowers shear strength in the embankment, foundation, and abutments.
Seepage paths reveal themselves slowly
A new seepage path, a clogged drain, or a degraded cutoff often shows up first as a change in piezometric level, well before water appears at the surface.
Response to loading is the real test
Engineers compare pore pressure against reservoir elevation, rainfall, and season. A reading only has meaning against that context.
Instrument Types
Piezometer Types and What Each One Asks of Your Maintenance Team
Different instruments fail in different ways. A useful dam piezometer record captures the type, because the type drives the inspection and calibration work.
| Instrument | How It Is Read | Typical Strength | Maintenance Concern |
|---|---|---|---|
| Open standpipe | Water level sounder in a riser pipe | Simple and easy to verify | Slow response in low-permeability soil, blocked or damaged pipe, sounder error |
| Pneumatic | Gas pressure applied at a readout unit | Fast response, no electronics buried | Tubing leaks, readout unit condition, gas supply |
| Vibrating wire | Frequency read by portable unit or datalogger | Long cable runs, automation friendly | Cable damage, lightning exposure, zero drift, conversion factors |
| Multi-level or multi-sensor installations | Several sensors in one borehole | Profile of pressure with depth | Identifying which sensor is which, seal integrity between zones |
Whatever the type, the record needs its installation depth, tip elevation, calibration data, and the person who last verified it.
Root Causes
Why Piezometer Data Becomes Hard to Trust
Most data problems are record keeping problems. The instrument may be fine while the information around it has drifted.
1
Instrument identity gets lost
Names change between consultants. P-3 in one report becomes PZ-03 in another, and the trend line breaks.
2
Readings sit apart from context
Pool elevation, weather, and tailwater are stored in different files, so every review begins with manual assembly.
3
Calibration history is incomplete
A sensor swap or new conversion factor goes unrecorded and later looks like a real pressure change.
4
Gaps are not flagged
A missed reading round, a dead logger, or a frozen riser leaves a hole that nobody notices until the annual report.
5
Follow-up work is untracked
An anomaly is discussed in a meeting, but no work order exists to verify the instrument or inspect the area.
The Twin Approach
Building a Pore Pressure Twin Around the Asset Record
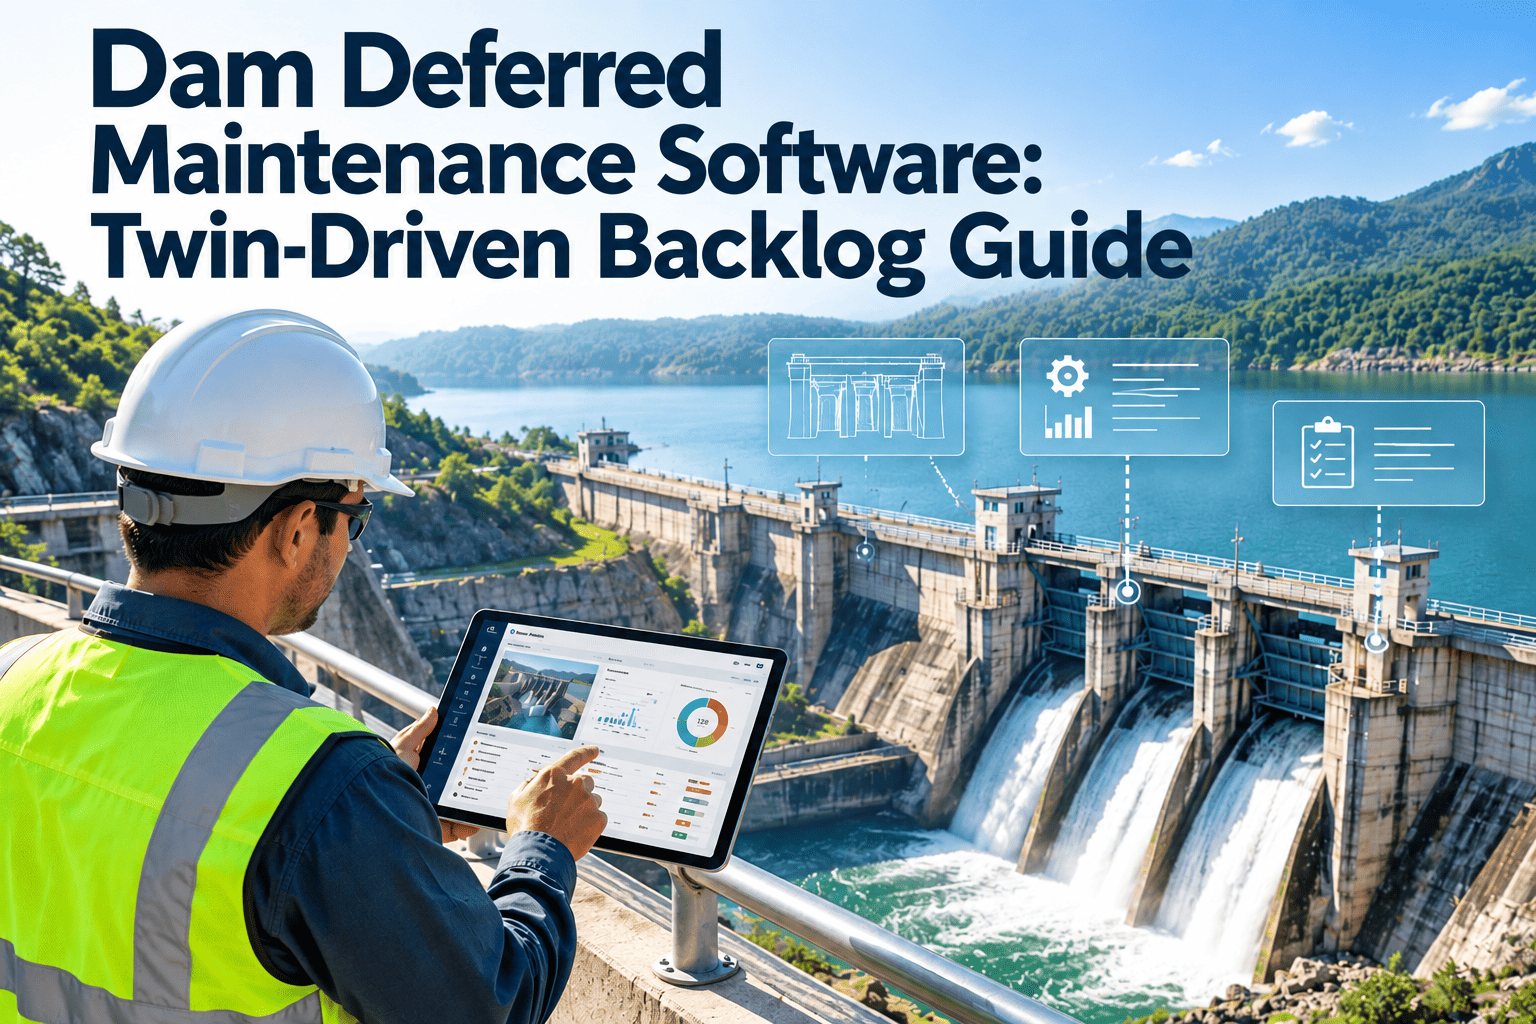
A twin here means a structured digital model of the dam that keeps each instrument connected to its location, its history, and the work performed on it.
Dam
Top level asset with owner, hazard class, and review dates
to
Section
Left abutment, right abutment, embankment, foundation, outlet
to
Instrument
Each piezometer with type, tip elevation, and install date
to
Records
Readings, calibrations, inspections, and work orders
With that hierarchy in place, a question such as which right abutment instruments have not been verified this year can be answered from one screen.
Data Integrity
The Metadata That Makes a Reading Comparable
A number without its metadata is hard to defend. Store these items on the instrument record so a reading taken today can be compared with one taken a decade ago.
Before and After
From Scattered Files to a Single Instrument Trail
Before
- Readings kept in personal spreadsheets
- Instrument names differ between reports
- Calibration sheets stored in a separate folder
- Gaps discovered during the annual review
- Anomalies noted but not assigned
After
- Readings entered against the instrument record
- One identifier used everywhere
- Calibration and sensor changes logged with dates
- Missed reading rounds visible as overdue tasks
- Anomalies turned into tracked work orders
Give Every Piezometer a Complete Record
Set up your dam, sections, and instruments in one structure, then attach readings, inspections, and work orders to each one.
Reading the Trends
Common Pore Pressure Patterns and the Response They Call For
Interpretation belongs to the dam safety engineer. The software job is to make the pattern visible and make sure the follow-up happens.
| Pattern | Possible Explanations | Typical First Step |
|---|---|---|
| Level rises and falls with reservoir | Expected hydraulic connection to the pool | Compare against prior years at similar pool elevation |
| Gradual upward drift at constant pool | Reduced drain capacity, developing seepage path, sensor drift | Verify instrument, then escalate to engineer review |
| Sudden step change | Sensor replacement, datum change, damaged cable, real event | Check the record for recent field work before drawing conclusions |
| Flat line with no response | Blocked riser, failed sensor, stuck logger | Field verification and functional test |
| Seasonal pattern shifts | Rainfall changes, groundwater changes, drain performance | Overlay rainfall and tailwater with the series |
Alert Logic
Matching Reading Status to Action
Many programs define action levels for each instrument. A simple matrix keeps the response consistent between staff and between years.
Stable Trend
Rising Trend
Within normal range
Routine reading schedule
Review at next scheduled interval
Near action level
Increase reading frequency
Notify engineer, verify instrument
Above action level
Engineer review, field check
Follow the emergency action procedures
The thresholds themselves come from the dam's engineering evaluation. Store them with the instrument so everyone reads the same numbers.
Regulatory Context
The Piezometer Discipline Behind USACE and Reclamation Programs
Federal dam owners operate under formal instrumentation and surveillance expectations, and many state programs follow similar principles.
USACE
Engineer Manual EM 1110-2-1908 covers instrumentation of embankment dams and levees, and ER 1110-2-1156 sets dam safety policy and procedures for the Corps portfolio.
Reclamation
The Bureau of Reclamation dam safety program relies on routine monitoring, periodic examinations, and comprehensive reviews that draw on instrument records.
FEMA guidance
The Federal Guidelines for Dam Safety frame surveillance and monitoring as part of an owner's responsibility, and states often build their programs on them.
State dam safety offices
Requirements vary by state and hazard class, so owners should confirm inspection intervals and reporting expectations with the regulator.
Across all of these, the shared expectation is documented, repeatable monitoring that engineers can review without reconstructing history.
Sensor Replacement
Handling a Replacement Without Breaking the Trend
A replaced sensor is one of the most common reasons a trend appears to jump. A short, repeatable protocol protects the continuity of the series.
Step 1
Record before
Capture the last reading and the state of the old sensor.
Step 2
Swap
Log the new serial number, calibration sheet, and installation depth.
Step 3
Settle
Allow equilibration time before treating readings as baseline.
Step 4
Compare
Check new readings against nearby instruments and pool level.
Step 5
Annotate
Mark the change on the trend so later reviewers do not misread it.
Field Program Checklist
What a Reliable Piezometer Routine Includes
Before the reading round
- Confirm the instrument list and access conditions
- Verify readout units and sounders are calibrated
- Check battery and gas supply where relevant
- Record reservoir and tailwater at the time of reading
During the round
- Read each instrument using the documented method
- Note weather, access, and visible conditions nearby
- Flag unusual readings on site, not later
- Photograph damaged protective covers or risers
After the round
- Review readings against recent history and thresholds
- Open work orders for repairs and verifications
- Confirm no instrument was skipped
- Route flagged items to the responsible engineer
Maintenance Management
How Oxmaint Supports the Piezometer Workflow
Oxmaint is maintenance management software, so its strength is keeping assets, inspections, and work organized. That fits the surveillance side of a dam program well.
Asset management
Build the dam, section, and instrument hierarchy and keep installation details with each piezometer.
Preventive maintenance and scheduling
Schedule reading rounds, calibration checks, and cover and riser inspections at defined intervals.
Mobile inspections
Let field staff complete checklists on site and record readings and notes against the correct instrument.
Work orders
Convert an anomaly into a corrective task with an owner, a due date, and a closure record.
Compliance records and reporting
Pull inspection history and completed work for periodic reviews and regulator requests.
Inventory
Track spare sensors, cable, and readout accessories so replacements are not delayed.
KPIs to Track
Measuring the Health of Your Instrumentation Program
These indicators describe program discipline rather than dam condition. Define each one in your own procedures before you report it.
Reading completion rate
Scheduled instrument readings completed in the planned window.
Instruments out of service
Piezometers that are damaged, blocked, or unreadable, and for how long.
Verification age
Days since each instrument was last functionally checked.
Anomaly closure time
Time from a flagged reading to a documented engineer response.
Data gap count
Missing readings by instrument and by period.
Getting Started
A Practical Rollout in Four Stages
Stage 1
Inventory
List every instrument, its type, location, and current condition from existing drawings and reports.
Stage 2
Structure
Create the dam, section, and instrument hierarchy with one consistent naming scheme.
Stage 3
Schedule
Set reading, calibration, and inspection intervals that match your monitoring plan.
Stage 4
Review
Hold regular reviews of trends, gaps, and open work with the responsible engineer.
Start with the instruments that matter most for the dam's critical failure modes, then expand coverage as the routine settles.
Manual and Automated Readings
Managing Both Reading Methods in One Record
Many dams use a mix of hand readings and dataloggers. The record should show which method produced each value, so reviewers know how much weight to give it.
Manual rounds
Hand readings give a technician a chance to notice a damaged cover, standing water, or a changed access path. They also depend on consistent method, so record the sounder or readout unit used.
Datalogger data
Automated readings fill gaps between visits and capture fast events. They still need periodic manual verification, battery checks, and a record of any logger replacement or reprogramming.
Reconciling the two
Schedule a manual check on automated instruments at a defined interval. A recorded difference between the two methods is useful evidence of drift before it affects a trend.
Review Package
What to Have Ready for a Periodic Dam Safety Review
Reviewers need to see history, not just current values. Assembling this package should be a report, not a project.
- Instrument list with type, location, tip elevation, and status for each piezometer
- Reading history paired with reservoir level, tailwater, and rainfall for the same dates
- Calibration records and a log of sensor replacements or datum changes
- Reading rounds completed versus scheduled, with explanations for any gaps
- Anomalies flagged during the period, the engineer response, and the closing work order
- Photos of instrument covers, risers, and nearby conditions from recent inspections
FAQs
Dam Piezometer Data Questions
What is dam piezometer data used for?
It shows pore pressure in the embankment, foundation, and abutments. Engineers compare it with reservoir level to judge seepage and stability.
Does a CMMS replace engineering analysis?
No. It organizes instruments, readings, and follow-up work so engineers can analyze with complete records. You can book a demo to see the workflow.
How often should piezometers be read?
It depends on the dam's monitoring plan, hazard class, and regulator. Set each instrument's interval from that plan and store it in the record.
Why track calibration with the instrument?
Sensor changes and conversion factors can look like real pressure shifts. A dated calibration history lets reviewers separate the two.
Can we start with only some instruments?
Yes. Begin with critical sections, then expand. You can create your workspace and add instruments in stages.
Make Every Pore Pressure Reading Defensible
Bring piezometer inspections, calibration history, and corrective work into one record that supports dam safety reviews year after year.