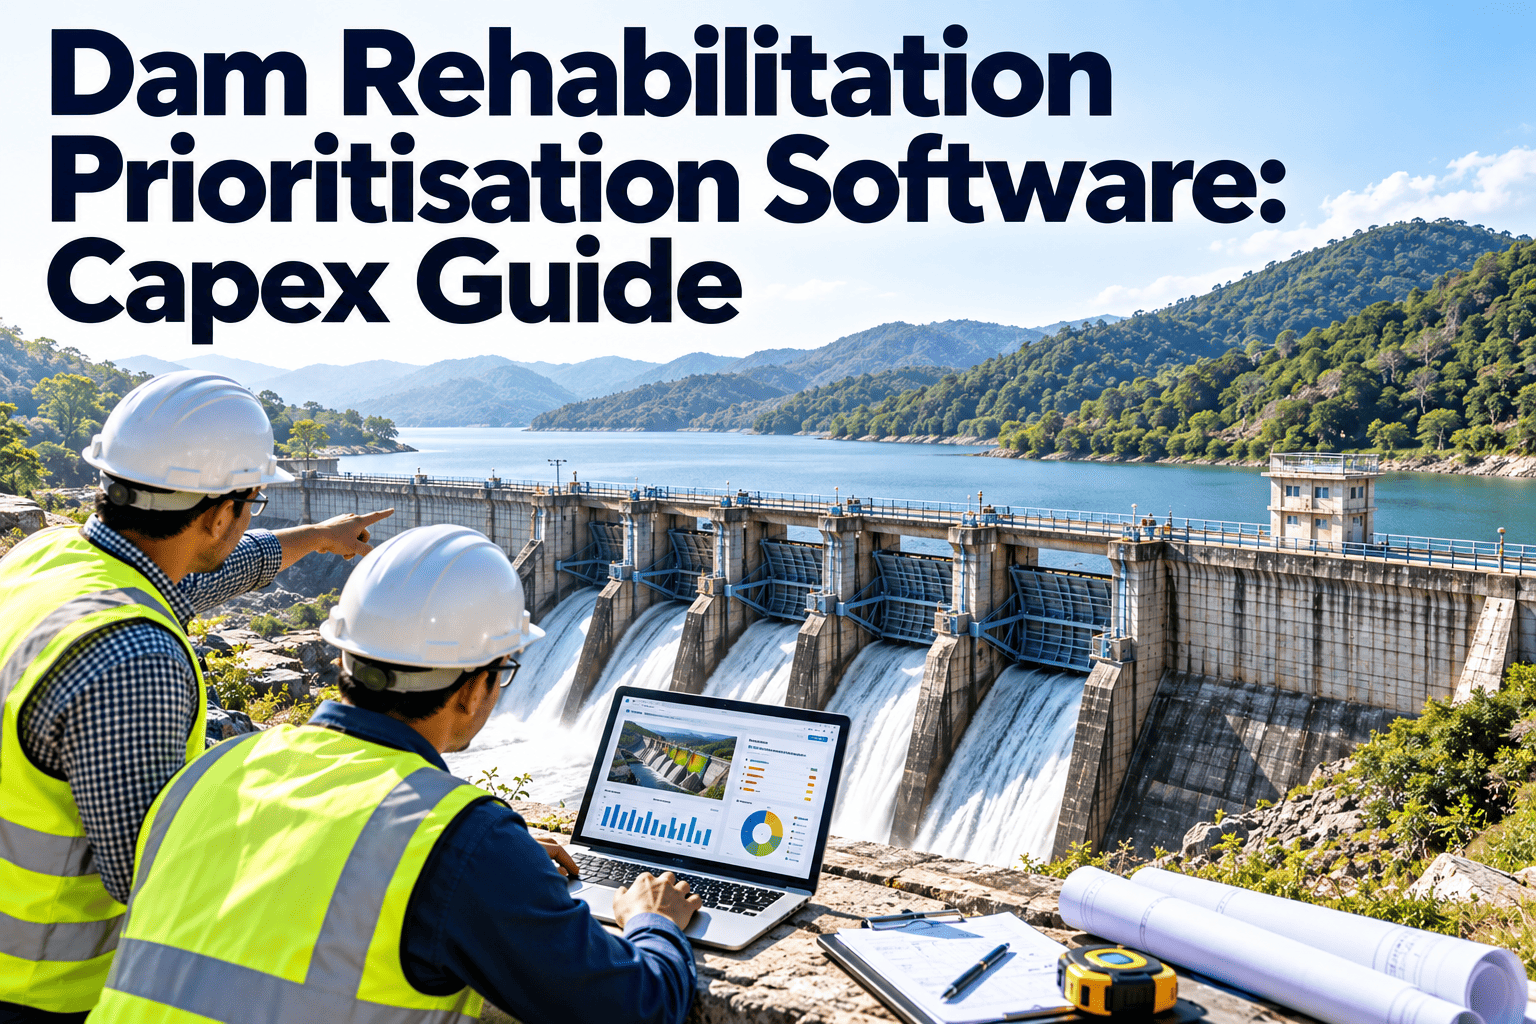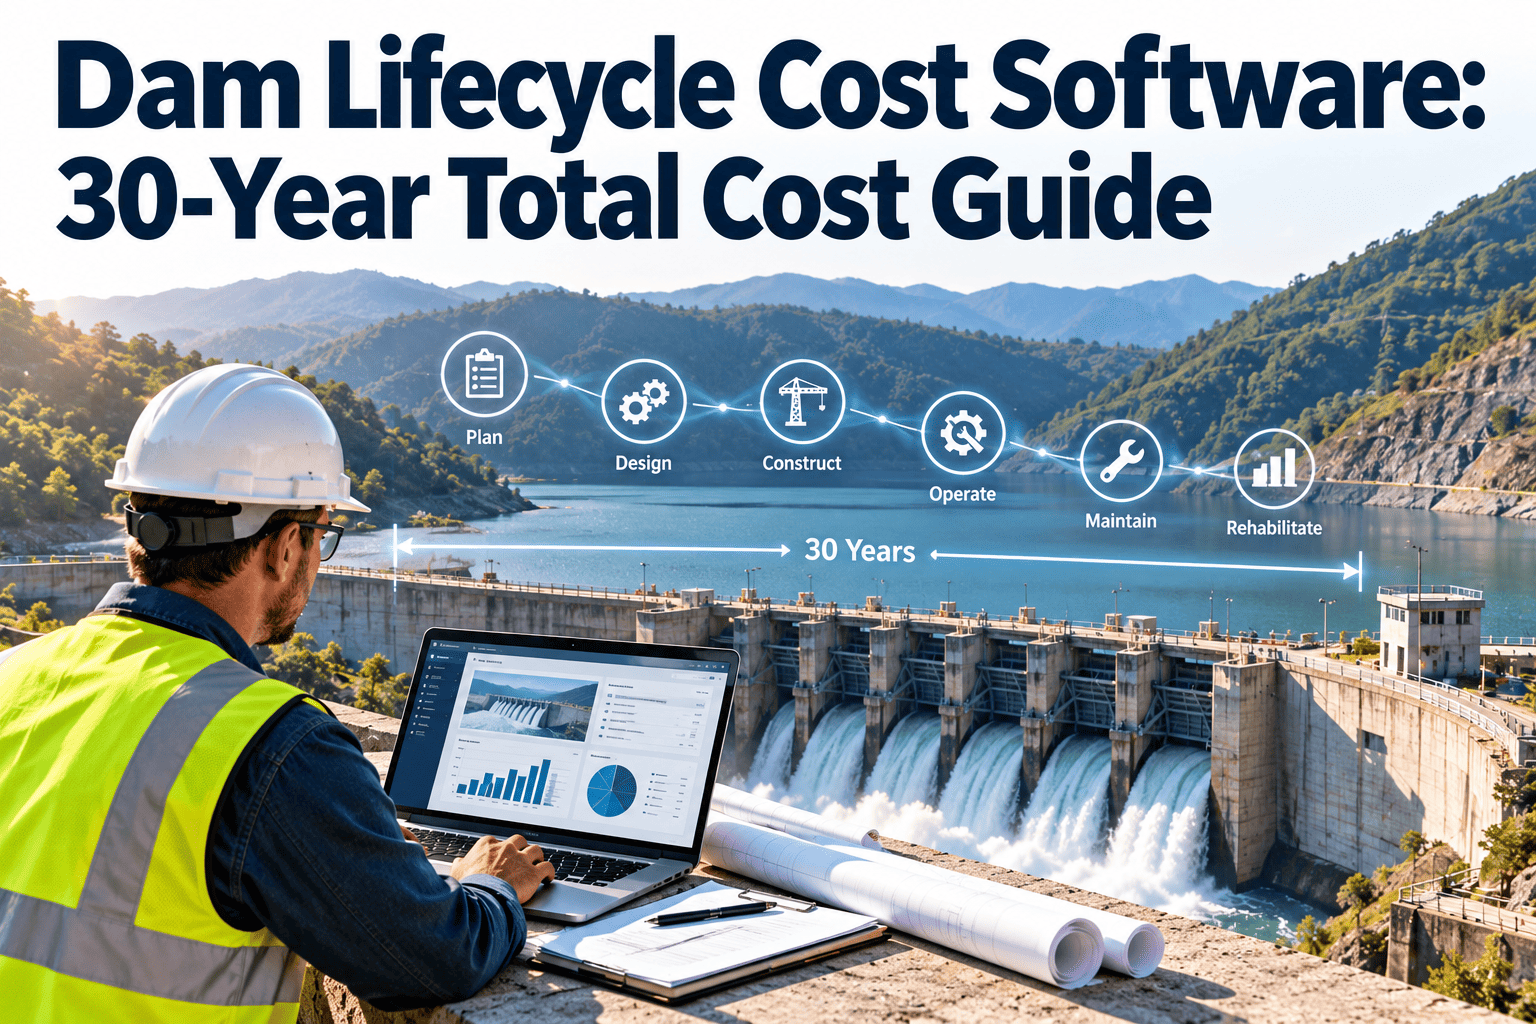
A dam is a long-lived asset, and its real cost is spread across decades of inspection, maintenance, rehabilitation, and eventually replacement or decommissioning. Owners who only look at the annual operating budget often miss the larger picture: deferred work gets more expensive, and major rehabilitation arrives as a surprise. This guide explains how to build a 30-year total cost view for a dam using the maintenance and inspection records you already generate. Teams that want those records and costs in one structure can begin in a maintenance management platform built around asset history.
Dam Asset Management · Lifecycle Cost Planning
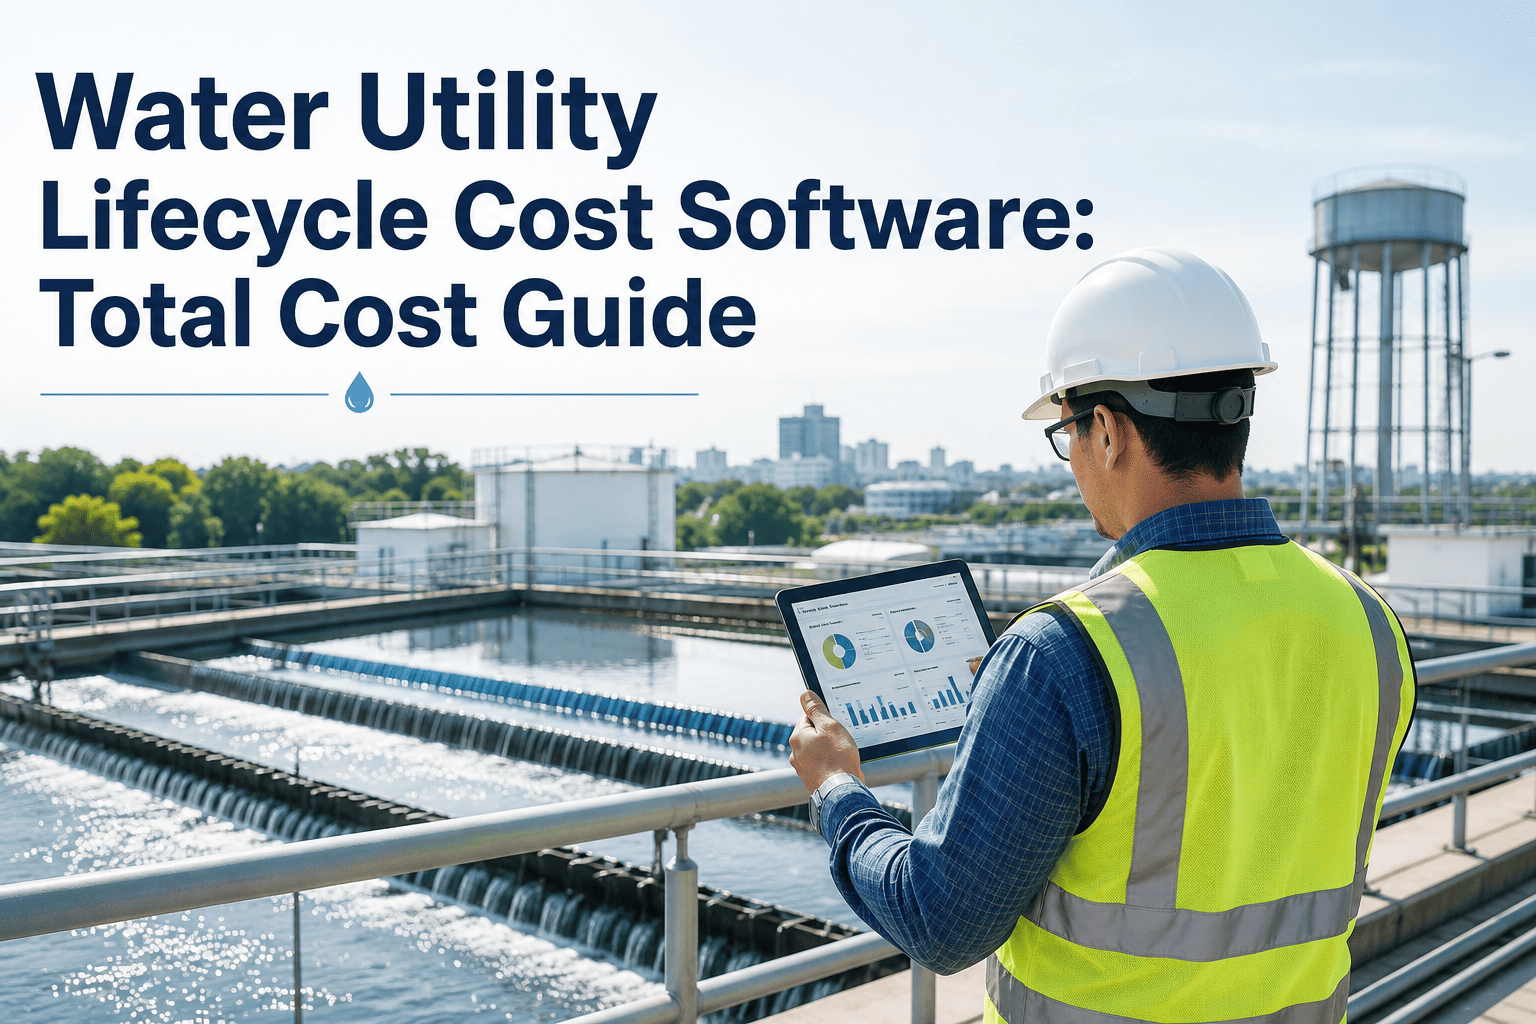
Dam Lifecycle Cost Software: 30-Year Total Cost Guide
Combine inspection, maintenance, rehabilitation, and replacement planning into one 30-year cost view per dam, so budgets follow condition and risk instead of last year's spending.
Years 1 to 10
Years 11 to 20
Years 21 to 30
InspectionMaintenanceRehabilitationReplacement
Illustrative proportions only. Not based on any real dam or cost data.
Why Total Cost
The Budget Problem With Annual Thinking
A one-year budget answers what to spend next. A lifecycle view answers what the dam will require over its remaining life, and when.
A
Deferred work compounds
A small gate, drain, or spillway repair postponed for several budget cycles can grow into a larger rehabilitation project.
B
Large projects arrive without notice
Without a forecast, rehabilitation competes with everything else for funding in the year it becomes urgent.
C
Costs are scattered
Inspection fees, crew labor, contractor repairs, and capital projects sit in separate budgets and cannot be compared.
D
Risk is invisible in the numbers
Spending history does not show which dams carry the highest consequence if something goes wrong.
Four Cost Buckets
What Belongs in a 30-Year Dam Cost Model
Separating cost into buckets keeps each one measurable and lets you see how they shift as the dam ages.
Inspection and monitoring
Routine inspections, periodic assessments, instrumentation readings, surveys, and engineering reviews required by the dam safety program.
Routine maintenance
Mowing, vegetation control, drain cleaning, gate and valve servicing, spillway upkeep, and minor repairs by crews or contractors.
Rehabilitation
Planned larger projects such as spillway upgrades, drain systems, gate replacement, embankment repair, or seepage control.
Replacement or end of life
Major reconstruction, replacement of key components, or decommissioning and removal where that becomes the better option.
The 30-Year View
How the Mix Typically Shifts Across Three Decades
Every dam is different. The pattern below describes a general planning logic, not a prediction for your structure.
Years 1 to 10
- Establish baseline condition and records
- Close known deficiencies from inspections
- Build a preventive maintenance routine
- Capture actual costs per task
Years 11 to 20
- Component wear becomes more visible
- Mechanical items reach replacement points
- Rehabilitation candidates are identified
- Funding requests start to use history
Years 21 to 30
- Major rehabilitation or replacement decisions
- Repair versus replace comparisons
- Risk reviews guide capital priority
- End of life options are evaluated
Plan Dam Spending Across Decades, Not Just Budget Years
Record actual inspection and maintenance costs per dam today, and build the history that makes long-range forecasts credible.
Cascade of Deferral
How a Small Deferred Repair Becomes a Capital Project
This simplified sequence shows why tracking small items matters. Actual timing varies widely by component and condition.
Minor defect found during inspection
Repair deferred for budget reasons
Condition worsens and is flagged again
Emergency or accelerated repair required
Rehabilitation project with larger scope
Repair or Replace
Comparing Rehabilitation and Replacement Options
Lifecycle cost is most useful when it compares options on the same basis. Use consistent assumptions across the alternatives.
| Factor | Continue Maintaining | Rehabilitate | Replace or Remove |
|---|---|---|---|
| Upfront cost | Lowest | Moderate to high | Highest |
| Ongoing cost | Rises as components age | Reduced for affected components | Reset to new asset levels or eliminated |
| Risk reduction | Limited by existing condition | Targeted to identified deficiencies | Addresses root condition |
| Service continuity | Unaffected | May need drawdown or restrictions | Significant disruption or loss of function |
| Data needed | Maintenance cost history | Condition findings and engineering studies | Full evaluation and alternatives analysis |
Data Inputs
The Records a Credible Lifecycle Model Depends On
A model is only as good as its inputs. Most of these already exist in maintenance and inspection workflows.
Asset inventory
Dams, components, gates, valves, drains, spillways, and instrumentation.
Condition history
Inspection findings and ratings over time.
Actual maintenance cost
Labor, parts, and contractor costs per work order.
Service life estimates
Expected life for components with reviewed assumptions.
Consequence information
Hazard classification and downstream exposure from the dam safety program.
Planned capital projects
Studies, designs, and rehabilitation projects already identified.
Funding Context
Why Documented Lifecycle Cost Supports Funding Requests
Programs that fund dam rehabilitation, including federal and state grant programs, typically ask applicants to describe condition, risk, and project need. Confirm current program rules before applying.
Weak support
- General statements that the dam is aging
- Cost estimates with no maintenance history
- No link between inspection findings and project scope
Strong support
- Dated inspection findings tied to specific components
- Actual maintenance cost trends per asset
- Clear comparison of repair and replacement options
Using Oxmaint
Building the Cost Record Through Daily Maintenance Work
Oxmaint is maintenance management software. It supports lifecycle planning by capturing the cost and condition data that planning depends on, as work happens.
Asset hierarchy
Organize each dam into structures and components so cost and condition roll up correctly.
Preventive maintenance
Schedule recurring work to reduce reactive repairs and make annual cost more predictable.
Work orders with cost
Capture labor, parts, and contractor cost against the asset that received the work.
Inspections
Record findings and condition notes over time to support rehabilitation timing.
Inventory
Track spare parts for gates, valves, and pumps to shorten repairs.
Reports and dashboards
Review spending by dam, asset, and cost type to feed capital planning.
Rollout
A Practical Path to a Working Lifecycle View
1
Build the asset list
Start with the dam, major structures, and mechanical components.
2
Assign cost categories
Tag work as inspection, maintenance, rehabilitation, or replacement.
3
Capture actuals
Record real labor, parts, and contractor cost on every work order.
4
Add planned projects
Enter identified rehabilitation work with expected timing.
5
Review yearly
Update assumptions as new inspections and costs arrive.
KPIs
Measures That Keep Lifecycle Planning Honest
Define each measure in your own policy so numbers mean the same thing from year to year.
Cost per dam by bucket
Inspection, maintenance, rehabilitation, and replacement spending.
Planned versus reactive share
Proportion of maintenance work that was scheduled.
Deferred maintenance backlog
Open work and estimated cost, by age.
Forecast accuracy
Planned project cost compared with actual outcome.
See a Dam Cost Record Built From Real Maintenance Work
Review how asset, inspection, and cost data can roll up into a long-range view for your dams.
Modeling Assumptions
The Assumptions That Change a 30-Year Number
A lifecycle model is a set of assumptions. Write them down, review them each year, and keep them separate from the recorded actuals.
1
Escalation
Construction and labor costs change over time. State whether figures are in current dollars or escalated, and use the same basis throughout.
2
Discounting
If your agency compares present value, document the discount rate and who approved it, so alternatives are compared fairly.
3
Service life
Component life estimates should come from manufacturer data, experience with similar assets, and engineering review.
4
Operating conditions
Flood frequency, sediment, freeze and thaw, and operating cycles all affect wear and should be noted.
Component View
Planning at the Component Level Instead of the Whole Dam
Costs become more credible when they are built from components. This sample shows the structure, not real intervals or prices.
| Component | Typical Work Over Time | Cost Bucket | Data to Capture |
|---|---|---|---|
| Embankment and slopes | Mowing, erosion repair, seepage monitoring | Maintenance, rehabilitation | Inspection findings, repair cost, area treated |
| Spillway and outlet | Cleaning, concrete repair, gate service | Maintenance, rehabilitation | Condition ratings, work orders, outage time |
| Gates, valves, and operators | Lubrication, testing, part replacement | Maintenance, replacement | Test results, parts used, failure history |
| Instrumentation | Readings, calibration, sensor replacement | Inspection and monitoring | Reading completion, calibration dates |
| Electrical and controls | Inspection, testing, equipment replacement | Maintenance, replacement | Test records, age, spare parts |
Risk-Informed Planning
Putting Consequence and Condition Next to Cost
Cost alone does not set priority. A dam with high downstream consequence and a known deficiency usually deserves attention before a lower-risk dam with a similar repair cost.
High consequence, poor condition
Highest priority for engineering review, funding, and monitoring. Plan rehabilitation early.
High consequence, good condition
Maintain closely and keep inspection and monitoring current so changes are caught early.
Lower consequence, poor condition
Plan repairs within the capital cycle and track whether condition is stable or worsening.
Lower consequence, good condition
Routine maintenance and scheduled inspection, with attention to long-term component renewal.
End of Life
Including Decommissioning in the Cost Conversation
For some dams, removal or a reduced function is a legitimate option. Putting it in the same model helps owners compare alternatives honestly.
- Estimate the cost of continuing to inspect, maintain, and rehabilitate the dam over the same horizon
- Include engineering studies, permitting, and environmental work needed for any removal option
- Account for the loss of benefits such as water supply, flood control, or recreation, and who bears that loss
- Record the decision basis, approvals, and assumptions so the choice can be reviewed later
- Revisit the comparison when condition, regulation, or downstream development changes
Reserve Planning
Turning the Forecast Into a Funding Plan
A forecast is useful when it feeds a budget conversation. These steps connect the model to funding decisions.
1
Group projects by year
Place planned rehabilitation and replacement work into the years where it is expected.
2
Compare to current funding
Show the gap between forecast need and the available budget for each period.
3
Prioritize by risk
Use hazard class and condition to decide what happens first when funding is limited.
4
Seek outside funding
Prepare documented condition and cost evidence for grant or loan applications.
From Findings to Cost
Connecting Inspection Findings to Future Spending
Lifecycle cost is strongest when each forecast line traces back to an inspection finding or a component record.
Finding recorded
A deficiency is logged against the specific component with date and severity.
Action defined
The response is classified as maintenance, study, or rehabilitation.
Estimate attached
An engineer or estimator adds a cost range and the assumptions behind it.
Timing set
The work is placed in a planning year based on risk and funding.
Work executed
A work order or project captures actual labor, parts, and contractor cost.
Estimate updated
Actual cost is compared with the estimate to improve later forecasts.
Common Pitfalls
Modeling Mistakes That Undermine Lifecycle Numbers
Pitfalls
- Mixing current and escalated dollars in one forecast
- Leaving inspection and monitoring cost out of the total
- Using one service life for every component
- Treating emergency repairs as ordinary maintenance
- Never comparing forecast with actual outcomes
Better practice
- State the cost basis and keep it consistent
- Include all four cost buckets for every dam
- Set life estimates by component and condition
- Tag reactive work so its share can be measured
- Review forecast accuracy each year and adjust
Annual Review
A Yearly Lifecycle Cost Review Checklist
A short review each year keeps the model alive. Without it, the forecast quickly drifts away from the dam it describes.
- Update component condition from the latest inspection and instrumentation records
- Load the year's actual costs and compare them with the forecast for each bucket
- Move planned projects that were delayed or advanced and note the reason
- Revisit service life and escalation assumptions with the responsible engineer
- Check that hazard classification and consequence information are current
- Summarize the funding gap and share it with decision makers in plain terms
Preventive Value
Where Preventive Maintenance Fits in the Cost Picture
Preventive work does not eliminate major projects, but it can slow component wear and reduce surprise failures. Measure the effect with your own records rather than assuming it.
- Track the ratio of scheduled to reactive work orders for each dam and component
- Compare repair cost on components that were serviced on schedule with those that were not
- Record outage time and operational impact for every reactive repair
- Use failure history on gates, valves, and pumps to adjust service intervals and spare parts stock
- Feed these results back into service life assumptions at each annual review
Communicating the Result
Presenting Lifecycle Cost to Boards and Funders
Decision makers rarely read a model. They need a clear view of what is needed, when, and what happens if it is delayed.
1
Show the horizon
Present total cost by decade and bucket so large future projects are visible now.
2
Show the options
Compare continue, rehabilitate, and replace or remove on the same assumptions.
3
Show the consequence
Explain downstream risk in plain language alongside the cost figures.
4
Show the evidence
Point to dated inspections, work orders, and actual costs behind each estimate.
FAQs
Dam Lifecycle Cost Questions
What is dam lifecycle cost?
It is the total expected cost of owning a dam over time, including inspection, maintenance, rehabilitation, and replacement.
Why use a 30-year horizon?
It is long enough to capture component replacement and rehabilitation cycles. Owners can choose a different horizon.
Does software calculate rehabilitation cost?
Engineers estimate project cost. Software records actuals and plans. You can book a demo to see this.
What data should we capture first?
Start with asset lists, inspection findings, and the actual cost of each work order.
Can we model several dams together?
Yes. Group dams in one workspace to compare spending and backlog. You can create an account to begin.
Give Every Dam a Cost Story That Spans 30 Years
Capture inspection, maintenance, and project cost in one record, and plan rehabilitation and replacement with evidence.