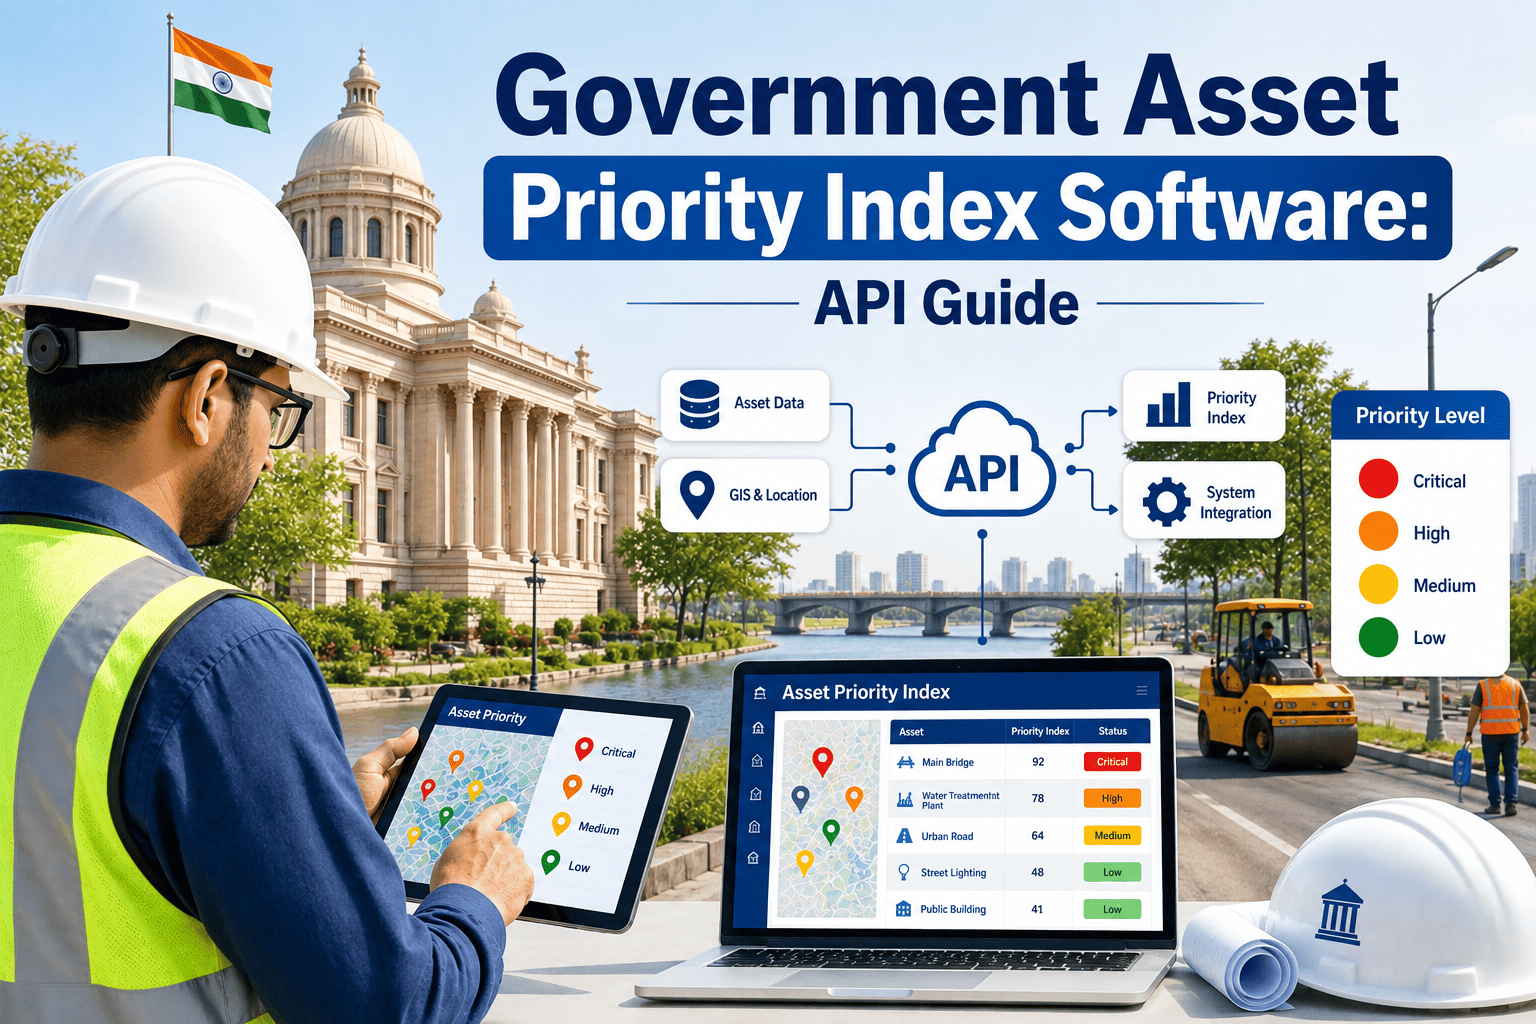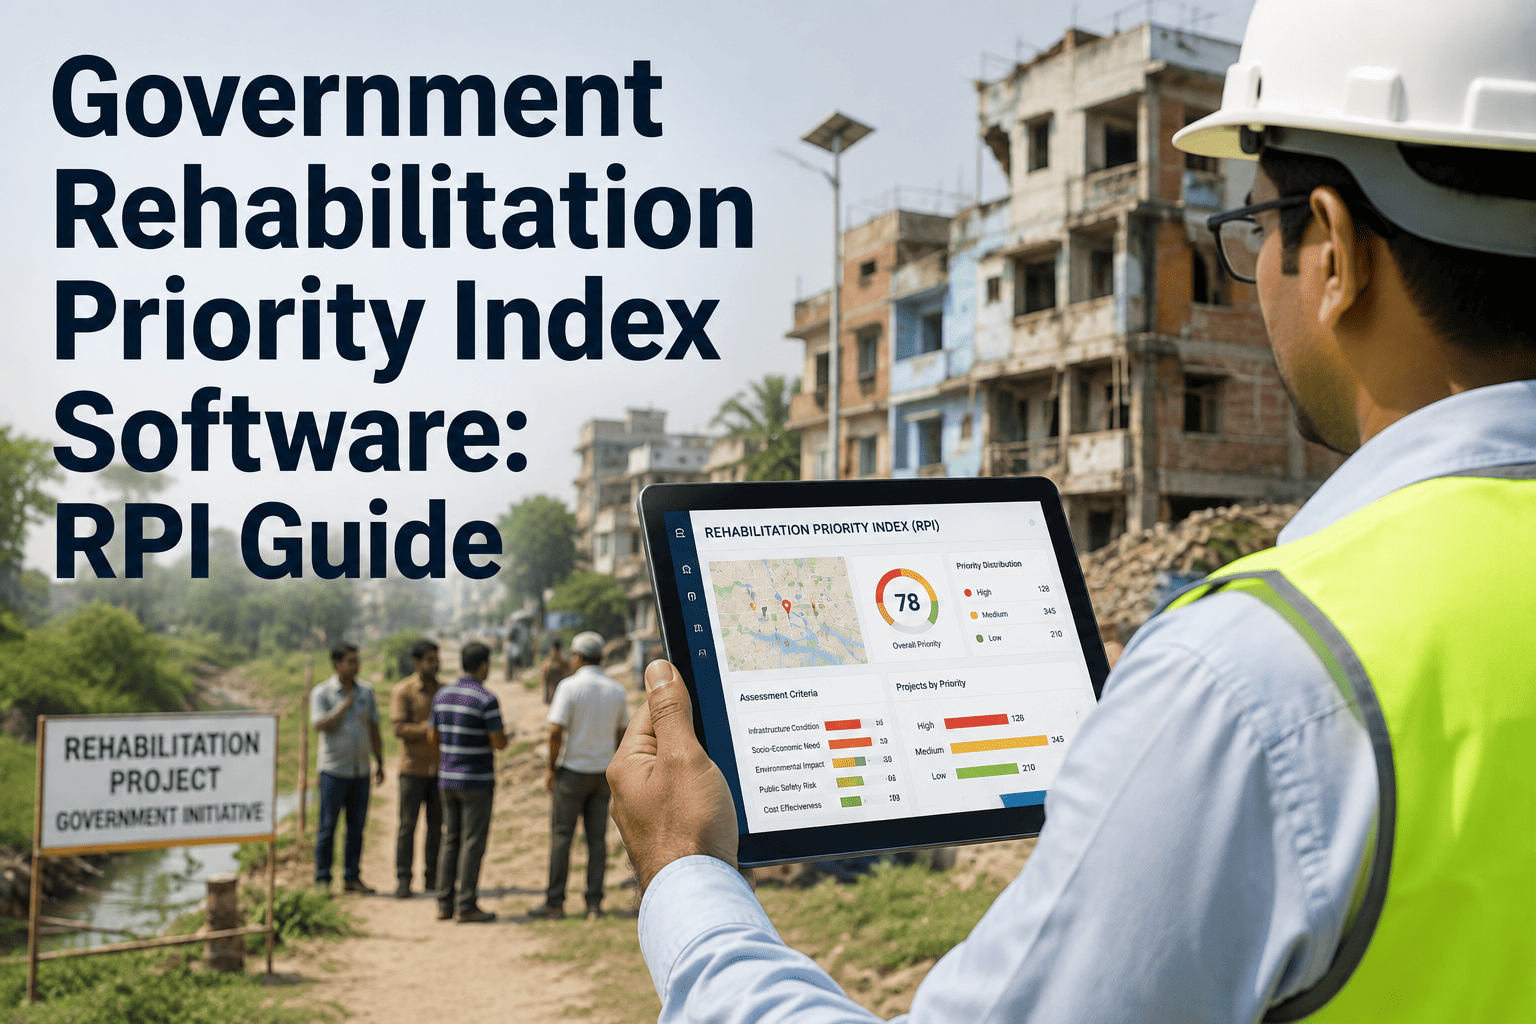
A bridge inspection flags corrosion on a load-bearing beam. Three buildings over, a boiler is nine years past its rated life and burning through the maintenance budget. A dozen more work orders sit in the queue, each one competing for the same limited capital dollars, and somebody has to decide which project moves this fiscal year and which one waits. That decision is exactly what a Rehabilitation Priority Index is built to make defensible instead of political. Agencies that skip a scored RPI methodology tend to fund the loudest request instead of the riskiest one, and BIA and DFMC reviewers notice the gap first. You can see how the scoring model works and rank your own backlog at app.oxmaint.ai.
Rank Every Rehabilitation Project With a Score Your Capital Committee Can Defend
A Rehabilitation Priority Index converts condition data, mission impact, safety risk, cost efficiency, and funding urgency into one ranked number per project. It is the same scoring discipline behind BIA and DFMC reviews at federal, state, and local agencies — and it is the difference between a capital plan built on evidence and one built on whoever asked loudest.
What the Rehabilitation Priority Index Actually Measures
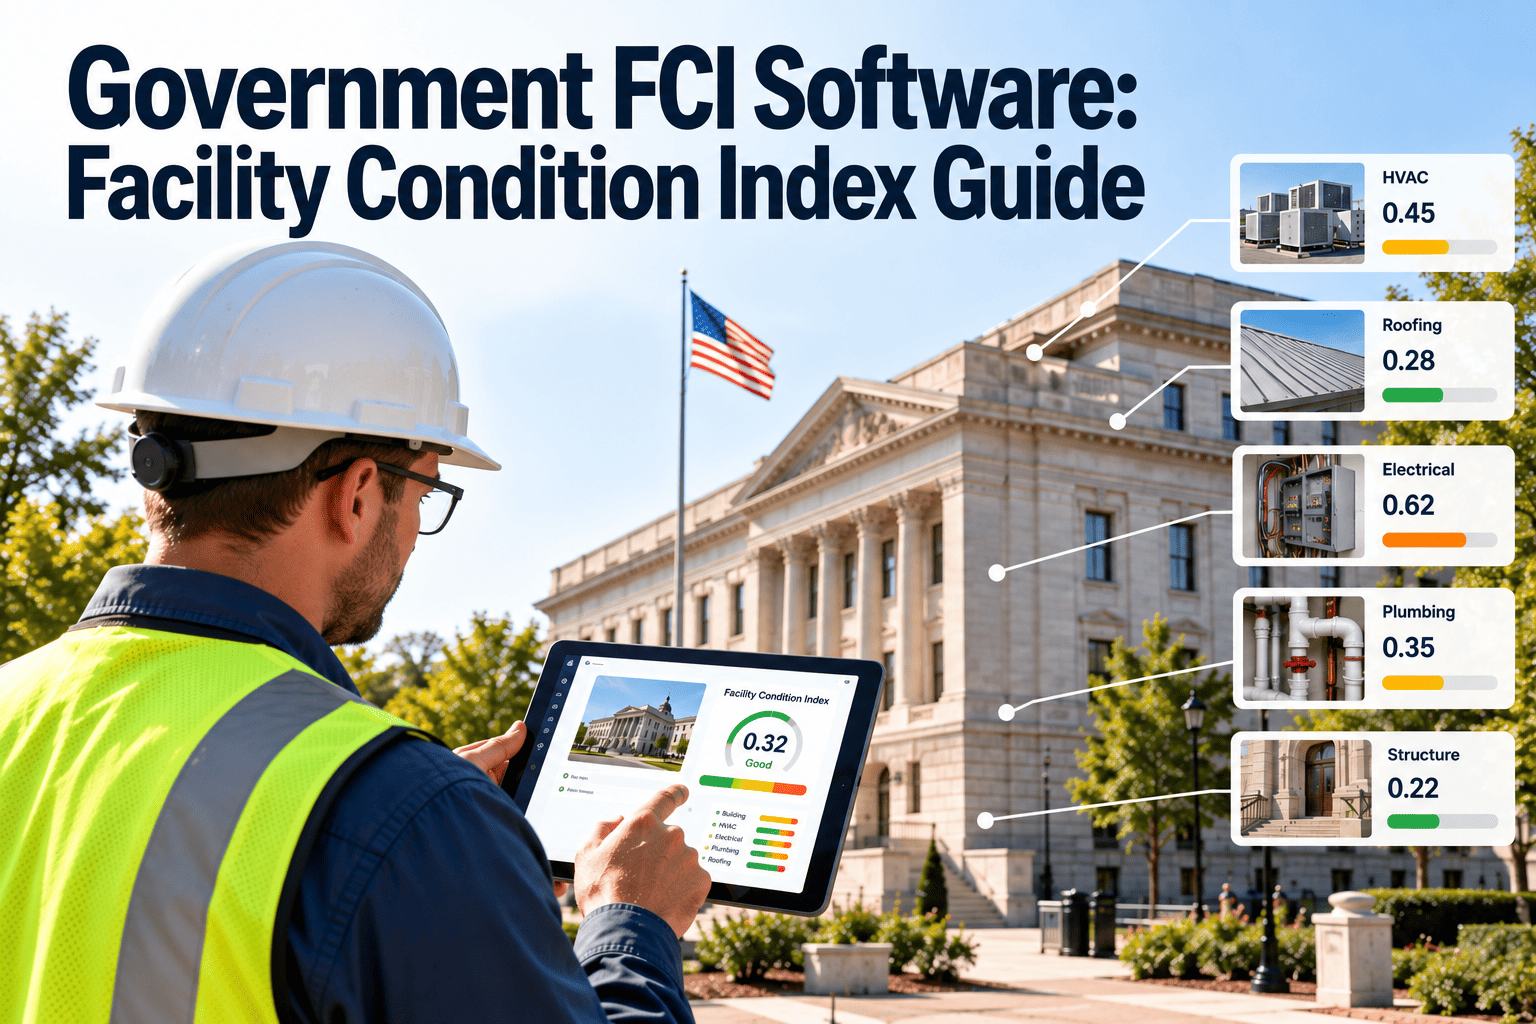
A Facility Condition Index tells you how deteriorated a building is. It does not tell you whether that building houses a 911 dispatch center or a seasonal storage shed, and it does not tell you whether the deficiency is a cracked sidewalk or an exposed electrical panel. The Rehabilitation Priority Index closes that gap. It takes the condition data an FCA or CMMS already produces and layers in the operational context — mission criticality, safety exposure, cost-of-delay, and the funding or compliance window the agency is working against — so that two buildings with an identical FCI score can still land in very different places on the priority list.
Government agencies rarely use RPI in isolation. It sits alongside a Backlog Investment Analysis, or BIA, which rolls individual project scores into a portfolio-level investment plan, and a Deferred Facility Maintenance Cost figure, or DFMC, which quantifies what the backlog is costing in dollars every year it goes unaddressed. RPI is the project-level ranking layer that makes both of those exercises defensible: instead of a spreadsheet ranked by whoever submitted the request first, the capital committee gets a scored, weighted, and auditable list.
The Five Inputs Behind Every RPI Score
Each pillar below is scored independently against a defined 0–100 scale, then weighted into the composite RPI number. Agencies can adjust the weighting to match local policy — a district with an aging fire-station roster might weight safety risk higher, while a facilities office focused on grant compliance might weight funding urgency higher — but the five pillars themselves rarely change.
How the Score Gets Calculated From Data You Already Have
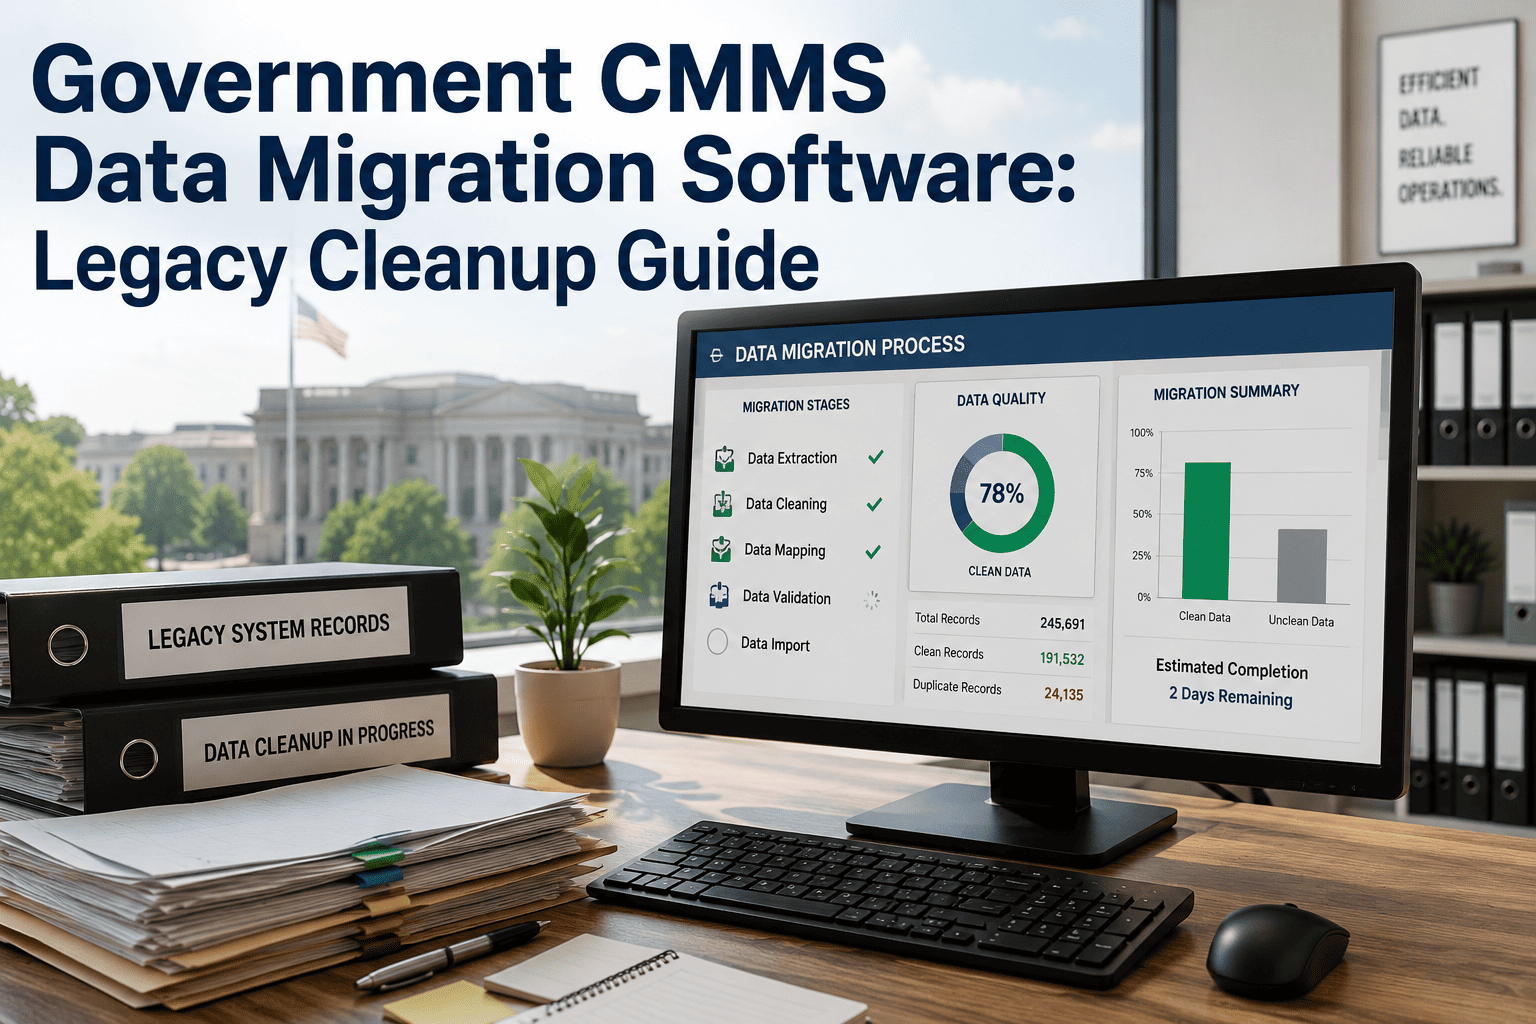
Agencies rarely need a new data-collection effort to start scoring. The inputs already exist across a facility condition assessment, a CMMS work-order history, and a handful of policy decisions finance and operations have usually already made informally. The scoring engine simply pulls them together on a consistent cycle instead of leaving that reconciliation to whoever compiles the capital request each year.
Who Relies on Rehabilitation Priority Index Scoring
RPI scoring shows up under different names across levels of government, but the underlying discipline is the same everywhere it appears: rank the backlog against risk and mission, not against who asked. The four groups below are where the methodology is most often formalized into policy.
The RPI Priority Ladder — From Monitor to Critical
Once every project carries a composite score, the score sorts into funding tiers instead of a flat ranked list — which is what most capital committees actually vote on. A typical five-tier ladder, calibrated to a 0–100 composite scale, looks like this.
RPI vs. FCI vs. BIA vs. DFMC — How the Four Metrics Relate
These four terms get used interchangeably in budget meetings, which is where confusion starts. Each one answers a different question, and a mature capital-planning program in government generates all four from the same underlying condition and work-order data rather than maintaining separate reports that quietly drift out of sync with each other over time.
| Metric | Question It Answers | Output | Refresh Cycle |
|---|---|---|---|
| FCI | How deteriorated is this asset physically? | 0–100 condition score per building or system | Annually or per assessment cycle |
| RPI | Which project should be funded first? | Weighted composite score per project | Every scoring cycle or on new data |
| BIA | How should capital dollars be allocated across the portfolio? | Ranked, tiered investment plan | Annually, aligned to budget cycle |
| DFMC | What is the backlog costing us every year we wait? | Dollar figure for deferred cost growth | Quarterly or annually |
A Ranked List Is Only as Strong as the Data Feeding the Score
OxMaint pulls condition scores, work-order history, safety flags, and cost data directly from your CMMS into a live RPI model — so every project on your capital list carries a current, auditable score instead of a stale spreadsheet estimate.
The KPIs a Facilities Director Tracks on an RPI Program
Standing up RPI scoring is the easy part. Keeping it accurate and trusted by the capital committee over multiple budget cycles is the part that actually determines whether the program survives past year one. These six metrics are what separates a live RPI program from a one-time spreadsheet exercise.
Deploying RPI Scoring in Four Phases
Agencies moving from spreadsheet ranking to a live RPI model tend to follow a similar sequence, regardless of portfolio size. Most mid-size public agencies complete the full rollout inside a single budget quarter.
Expert Perspective — Scoring the Backlog Instead of Arguing About It
I spent years watching capital committee meetings turn into a debate about whose building deserved funding more, and the debate almost never had anything to do with actual risk. Once we started scoring projects on mission criticality, safety exposure, condition, and cost-of-delay together, the meetings changed completely. Nobody argues with a number they helped set the weighting for. The bigger shift was operational — once RPI scores lived inside the CMMS instead of a spreadsheet someone updated twice a year, the ranking stayed current, and the committee started trusting it enough to actually follow it. That trust is the entire point of the exercise.
The Economics of Scoring the Backlog Before You Fund It
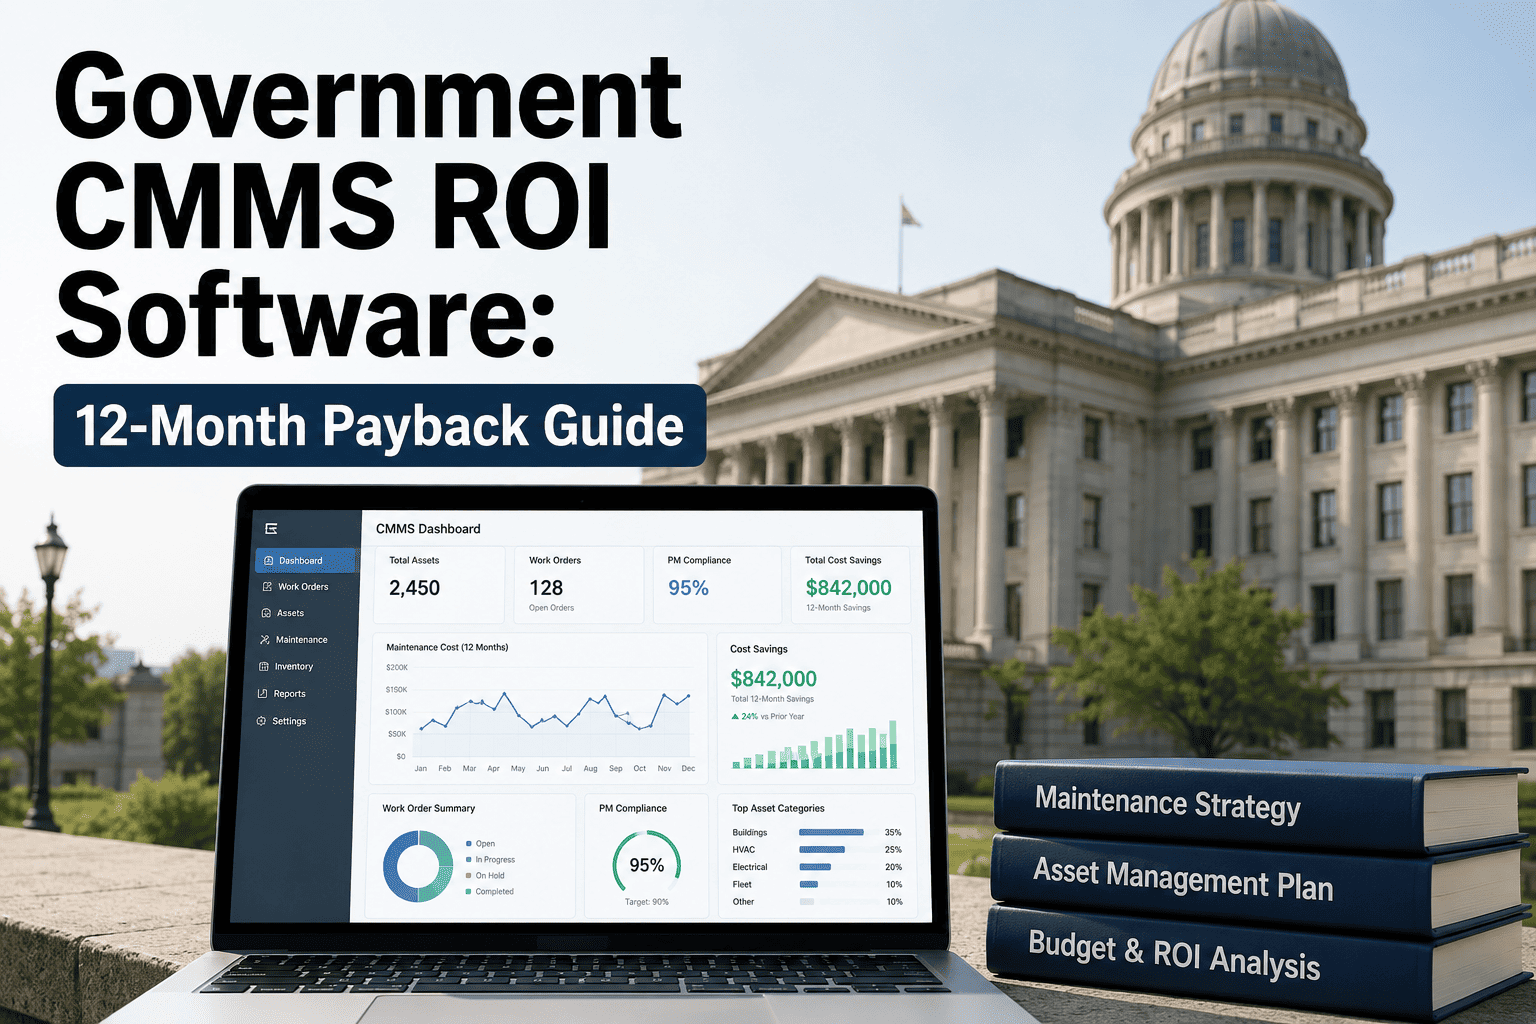
The financial case for RPI scoring is not the software cost. It is the cost of funding the wrong project first — a cosmetic renovation approved ahead of a structural repair that later fails and forces an emergency reconstruction at several times the planned cost. Agencies that score and rank consistently redirect capital toward the projects with the highest combined risk and return, instead of the projects with the most vocal sponsor. The savings compound over multiple budget cycles: fewer emergency procurements, fewer mid-year budget amendments, and a capital plan that survives leadership turnover because the reasoning is documented in the score rather than in one director's institutional memory.
Common Pitfalls When Building an RPI Model
Most RPI programs do not fail because the formula is wrong. They fail because the process around the formula breaks down after the first scoring cycle. These four issues account for most of the programs that quietly revert back to spreadsheet ranking within two budget cycles.
Frequently Asked Questions
Your Next Budget Cycle Will Rank Your Backlog Whether the Score Exists or Not
OxMaint turns condition assessments, work orders, and safety data into a live, defensible Rehabilitation Priority Index — built for BIA and DFMC reviews, and ready before your next capital committee meeting.