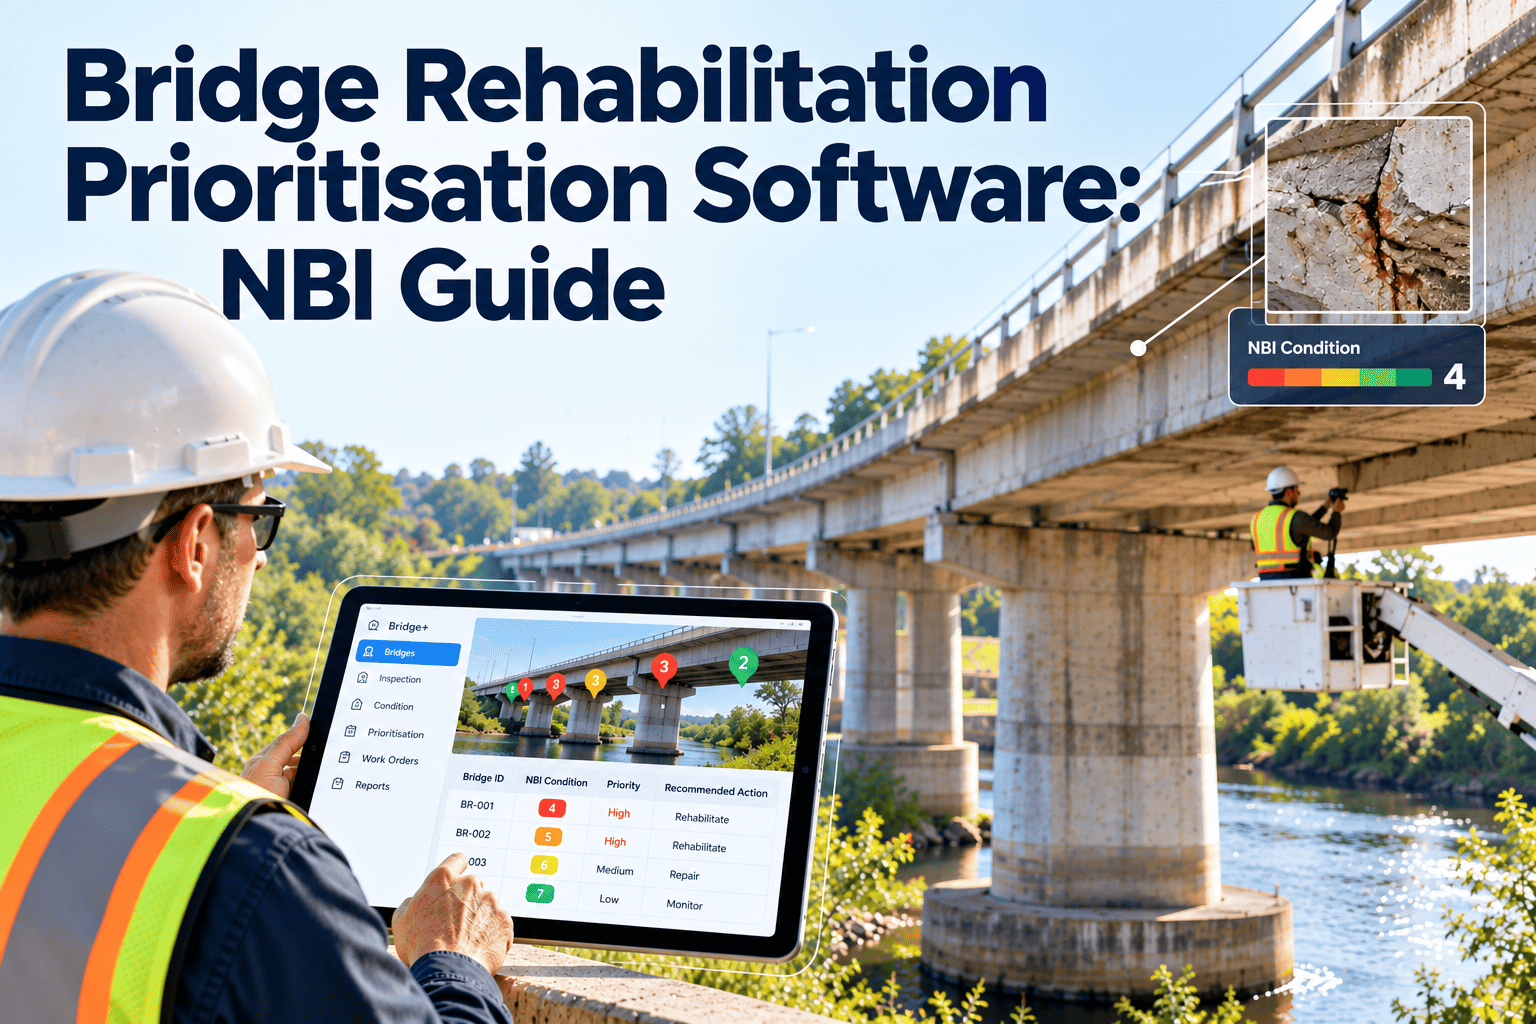
Every state bridge program faces the same arithmetic: more structures need work than the budget can fund this cycle. What separates a defensible program from a contested one is how clearly each ranking can be explained. This guide covers how National Bridge Inventory (NBI) condition ratings, average daily traffic (ADT), and safe load capacity combine into a transparent score, and how bridge rehabilitation prioritisation software like Oxmaint's CMMS keeps that score tied to inspection records.
Bridge Rehabilitation Prioritisation Software: NBI Guide
Score bridges by NBI condition rating, traffic exposure, and safe load capacity, then carry the ranking into your STIP with evidence attached to every line.
What the NBI Condition Rating Actually Tells You
NBI condition ratings run from 9 (excellent) down to 0 (failed) for the deck, superstructure, and substructure, and for culverts where applicable. FHWA groups them into good (7 to 9), fair (5 to 6), and poor (4 or below) for national reporting.
The lowest of the deck, superstructure, and substructure ratings drives the overall bridge classification, so a bridge with a fair deck and a poor substructure is a poor bridge. A prioritisation tool must keep the three components visible instead of averaging them away.
Why condition alone is not a ranking
- Two bridges rated 4 can differ enormously in traffic served and detour length
- A rating of 5 on a posted bridge may be more urgent than a 4 on a low-use local road
- Ratings are snapshots; the rate of deterioration matters as much as the number
- Component ratings hide whether the problem is deck wearing surface or primary members
The Four Questions Behind Every Bridge Rank
Most agency scoring models, however they are weighted, answer the same four questions. Make each one an explicit field in the record.
- How bad is the condition? Use component NBI ratings, element condition states, and the rate of change since the last inspection.
- Who is exposed if it gets worse? Use ADT, truck percentage, and whether the route is a freight, evacuation, or transit corridor.
- Can it still carry the load? Use load rating results, posting status, and any restrictions already in place.
- What happens if it closes? Use detour length, alternate routes, and the community or business served.
Safe Load Capacity: The Factor That Changes the Order
Load rating compares what a bridge can carry with what vehicles actually place on it. When the rating falls below legal loads, the bridge must be posted or restricted. Posted bridges disrupt trucking, school bus routes, and emergency services, which is why capacity deserves its own weight.
An out-of-date load rating is a hidden risk. If a bridge has deteriorated since its last rating, the posted limit may no longer be conservative, so rating dates belong in the same dashboard as condition scores.
An Illustrative Weighting Model
Weights are an agency policy decision, not a software default. The bars below show one example of how a scoring model might be balanced; your engineers and leadership should set the real values.
What matters is that the weights are written down, applied the same way to every bridge, and changeable when policy changes, with the earlier version preserved.
Rank Bridges With Rules You Can Show Anyone
Keep NBI ratings, traffic, and load capacity in one asset record so every rehabilitation decision traces back to inspection evidence.
From Inspection to Ranked List: The Pipeline
Prioritisation is a pipeline, not a spreadsheet exercise. Each stage produces evidence the next one depends on.
What a Ranked Candidate Record Looks Like
The sample below uses placeholder bridges to show the shape of the record. Values are illustrative and not real structures.
| Bridge | Lowest NBI component | ADT band | Load status | Flags | Suggested action |
|---|---|---|---|---|---|
| Sample A | 4 (superstructure) | High | Posted | Fracture critical | Rehabilitation candidate, near term |
| Sample B | 5 (deck) | High | Unrestricted | None | Preservation: deck overlay or sealing |
| Sample C | 3 (substructure) | Low | Closed to heavy trucks | Scour critical | Engineer review; consider replacement |
| Sample D | 7 (all) | Medium | Unrestricted | None | Routine maintenance only |
A good tool lets an engineer override the computed order, but only with a reason that is stored beside the score.
Preservation Versus Rehabilitation Versus Replacement
Not every candidate needs the same treatment. Matching the action to the condition keeps limited funds working across more bridges.
Waiting for poor condition
- Work starts when ratings hit 4 or below
- Larger scope and higher cost per structure
- More postings and emergency repairs
- Fewer bridges can be treated per cycle
Timed treatments
- Sealing, joints, and cleaning scheduled while ratings are fair
- Deterioration slowed before major repair is needed
- Rehabilitation reserved for structures that need it
- More of the network kept out of poor condition
Defending the List in Front of the STIP Process
The Statewide Transportation Improvement Program is where bridge needs compete with every other project. Reviewers, legislators, and local officials will ask why one bridge is funded and another waits.
- Show the scoring model, its weights, and its adoption date
- Attach the latest inspection report and photos to each ranked bridge
- Document every override with an engineer's name and rationale
- Record posting status and load rating dates for each candidate
- Keep prior-cycle rankings so changes in position can be explained
- Link programmed projects back to the structures they will treat
Federal bridge funding programs, including formula funding from recent infrastructure legislation, add reporting expectations. A structured record shortens the time spent assembling those submissions.
Where Oxmaint Fits in Bridge Workflows
Oxmaint is a CMMS, so its strength is the maintenance side of the lifecycle: keeping assets, inspections, and follow-up work connected.
| Capability | Bridge use |
|---|---|
| Asset management | Structure records with components, elements, ratings history, and flags |
| Inspections | Mobile checklists, photos, and defect notes captured at the bridge |
| Preventive maintenance | Recurring joint cleaning, drain flushing, bearing checks, and sealing |
| Work orders | Corrective repairs created from findings, with cost and completion records |
| Scheduling | Inspection and maintenance calendars across districts and crews |
| Reporting | Dashboards by district, condition band, posting status, and overdue work |
Data Quality Checks Before You Trust a Score
A ranking is only as good as its inputs. Run these checks before each programming cycle.
- Confirm every structure has a current inspection inside its required interval.
- Compare component ratings with photos for any bridge that changed by two points or more.
- Verify ADT values are recent and truck percentages are populated.
- Check that load ratings reflect the latest condition and any repairs.
- Reconcile open work orders so completed repairs are not still counted as needs.
Document each check with a date and a reviewer. When a ranking is questioned months later, that trail shows the inputs were verified before the list was finalised, which is often what settles the discussion.
Trends Changing Bridge Prioritisation
Agencies are moving from rating-only lists toward risk-informed asset management. Element-level inspection data, drone imagery, and structural health monitoring add detail, while climate and scour exposure sharpen the risk side of the score.
Deterioration Drivers by Component
Knowing why a rating dropped shapes the treatment. A deck problem and a substructure problem often call for very different budgets and timelines.
| Component | Common drivers | Typical response path |
|---|---|---|
| Deck | De-icing salts, chloride-driven corrosion of reinforcement, cracking, wearing surface wear | Sealing, overlays, patching, or deck replacement |
| Superstructure | Corrosion of steel members, section loss at bearings, fatigue cracking, impact damage | Cleaning, repair, strengthening, or member replacement |
| Substructure | Scour, settlement, spalling, bearing seat deterioration, drainage leaks | Scour countermeasures, repair, foundation work |
| Joints and bearings | Debris, seized or failed joints, water leakage onto bearings and beam ends | Preventive cleaning, joint replacement, bearing service |
Pain Points Inside Bridge Offices
Prioritisation breaks down in familiar ways. Spotting them early shows where software helps most.
Typical friction
- Inspection reports stored apart from the ranking spreadsheet
- Maintenance crews unaware of what the inspector flagged
- Ratings updated, but load rating dates never reviewed
- District rankings built with different assumptions
- Overrides explained in email, then lost
With a connected record
- Findings create work orders crews can see and complete
- One scoring model applied across all districts
- Load rating currency visible on the same dashboard
- Overrides stored with reason, author, and date
- Completed repairs update the bridge record automatically
Trends Matter More Than Snapshots
A bridge that drops from 6 to 5 in one inspection cycle is a different problem from one that has been a stable 5 for a decade. Both appear identical in a single-year list, which is why history should sit behind every score.
- Plot component ratings across every inspection on the record
- Flag any drop of two points in a single cycle for engineer review
- Track how treatments changed the trend, such as sealing or joint replacement
- Note whether deterioration is accelerating or leveling off
Network Views Leadership Actually Uses
Executives rarely ask for individual bridge records. They ask where the network stands and what the next dollar buys. Build dashboards around those questions.
Rolling Out a Prioritisation Process
Adopt the process in stages so the model earns trust before it drives funding decisions.
Who Owns What in the Process
Clear roles keep the score credible. Software enforces the handoffs, but people still own the judgment.
- Inspectors own accurate ratings, photos, and defect descriptions
- Load rating engineers own capacity analysis and posting recommendations
- Asset managers own the scoring model, its weights, and version history
- Maintenance supervisors own scheduled preservation and corrective work closure
- Program managers own the STIP package and the justification narrative
Closing the loop matters as much as ranking. When a treatment is delivered, the record should capture the new rating, the work performed, and the date, so the next cycle starts from facts rather than assumptions.
Special Cases That Deserve Their Own Flags
Some structures carry risks that a general condition score underweights. Flag them explicitly so they are never ranked purely on a rating.
| Flag | Why it matters | What to store |
|---|---|---|
| Scour critical | Foundation can fail suddenly during floods, often without visible warning | Scour evaluation, plan of action, post-flood inspection history |
| Fracture critical | Failure of a single tension member can cause collapse | Special inspection intervals, hands-on inspection records |
| Posted or restricted | Weight limits disrupt freight, buses, and emergency routes | Posting date, signage check, load rating basis |
| Long detour | Closure creates a large cost and safety burden for the community | Detour length and alternate route notes |
Treat these flags as modifiers or hard triggers in the scoring model, as your policy decides, and keep the reasoning in the record.
Frequently Asked Questions
Is the NBI rating enough to rank bridges?
Who sets the scoring weights?
Can engineers override the computed order?
How does this help STIP justification?
Can we start with a subset of bridges?
Turn Bridge Needs Into a Ranked, Defensible Program
Connect inspection findings, traffic exposure, and load capacity to your rehabilitation list, and carry the evidence from the field to the STIP.