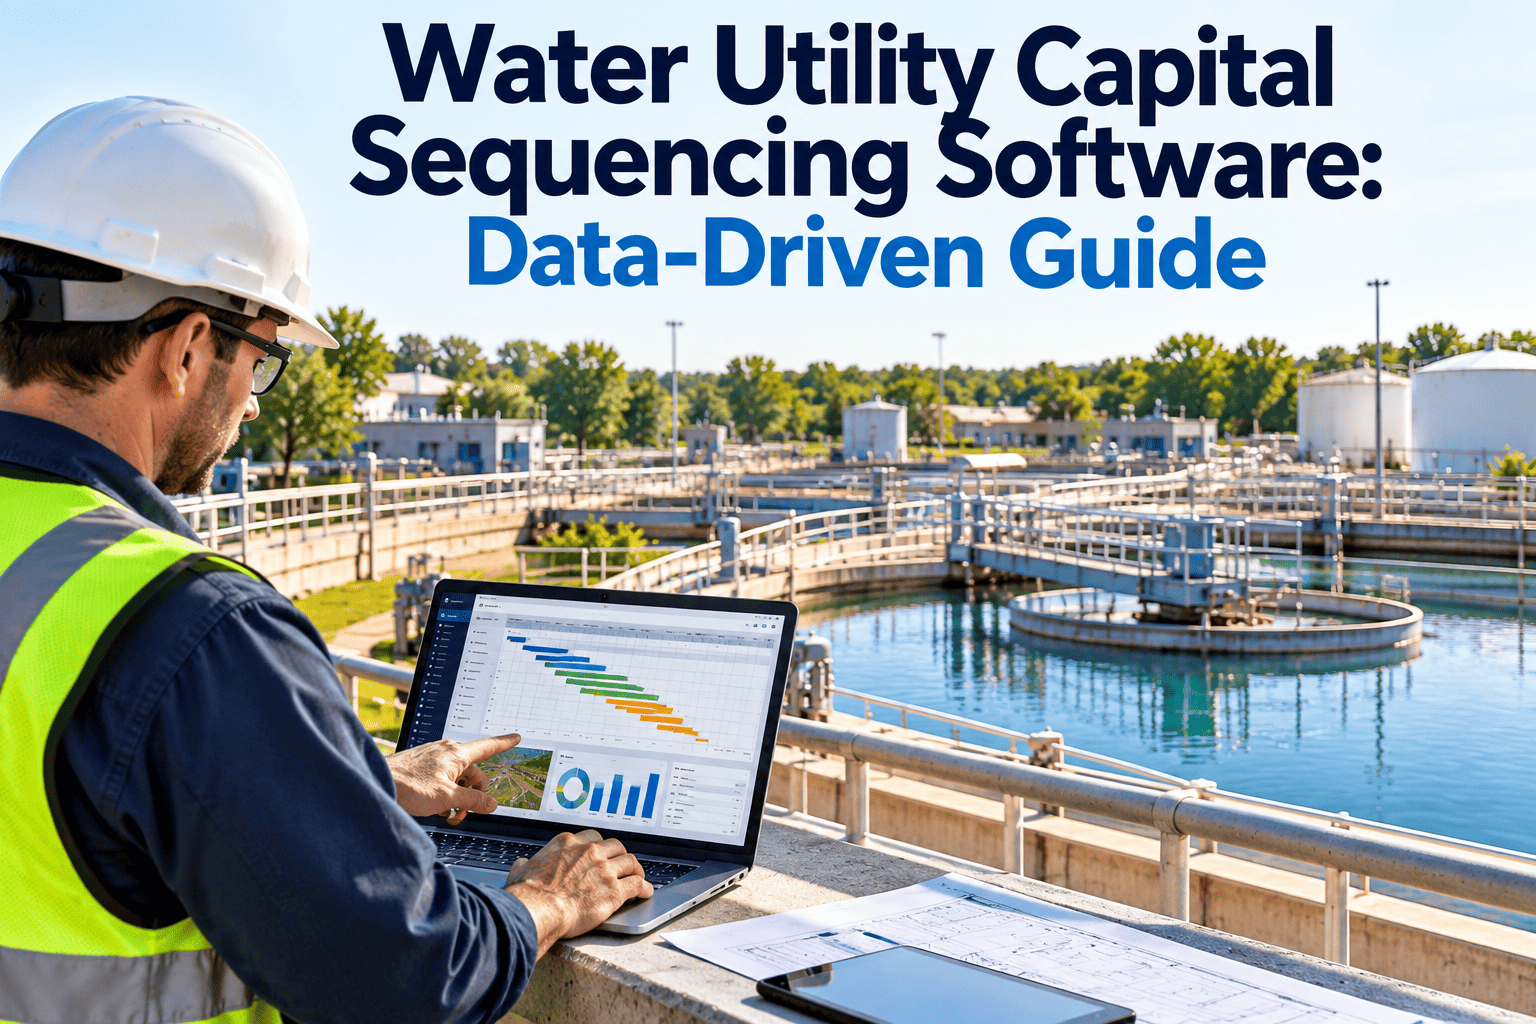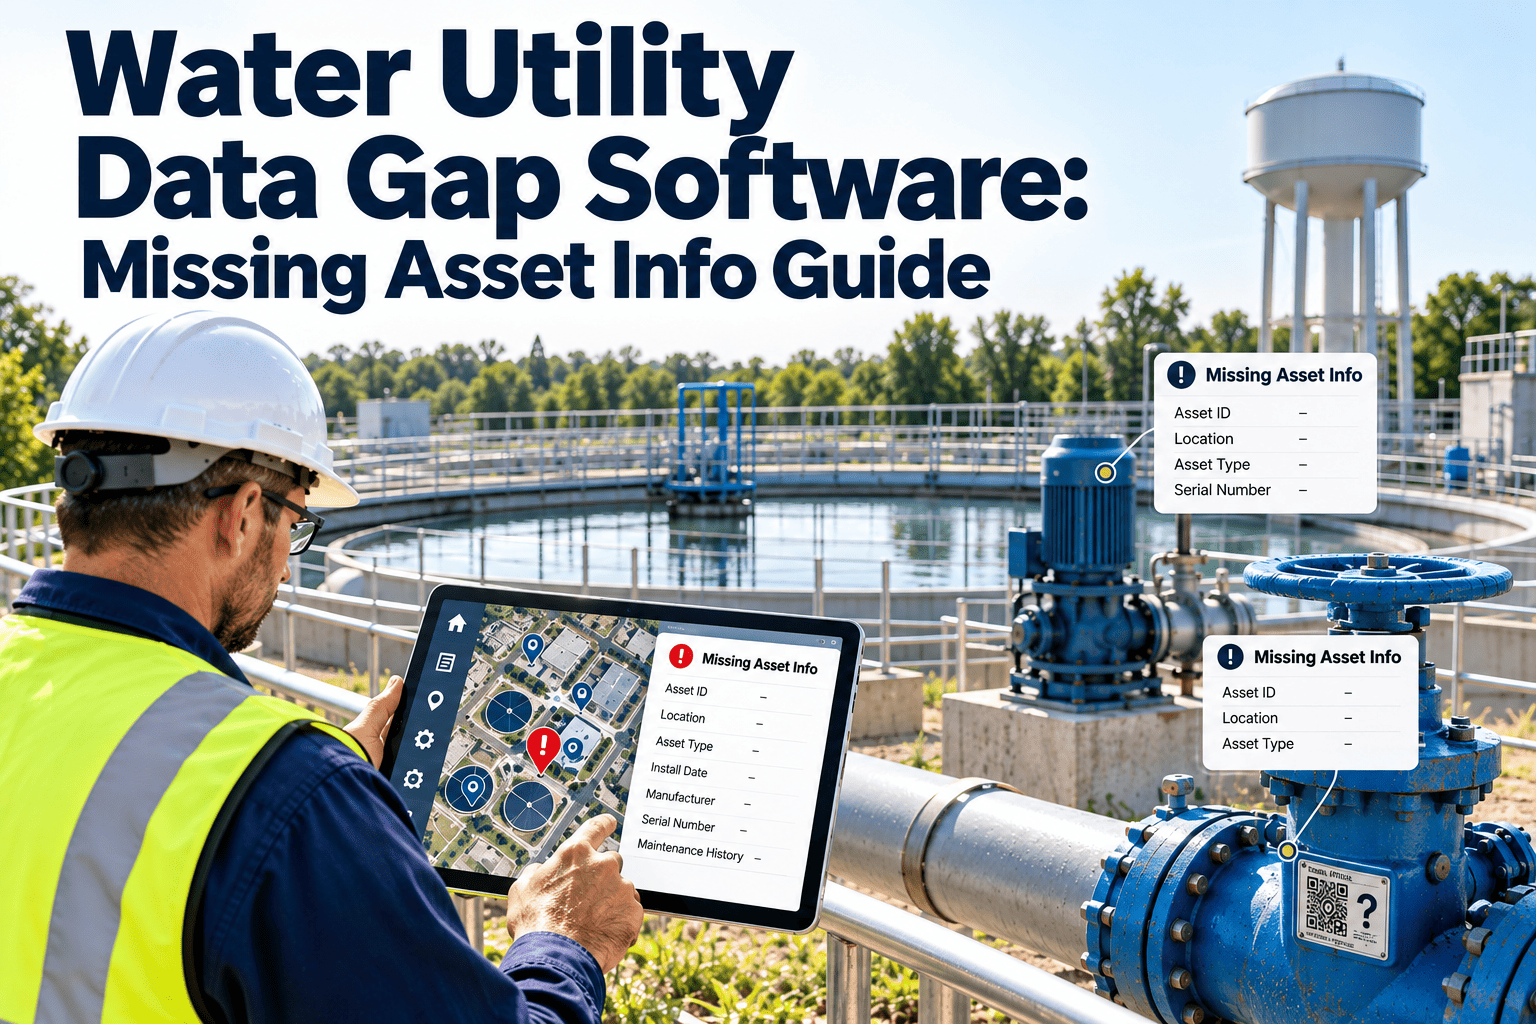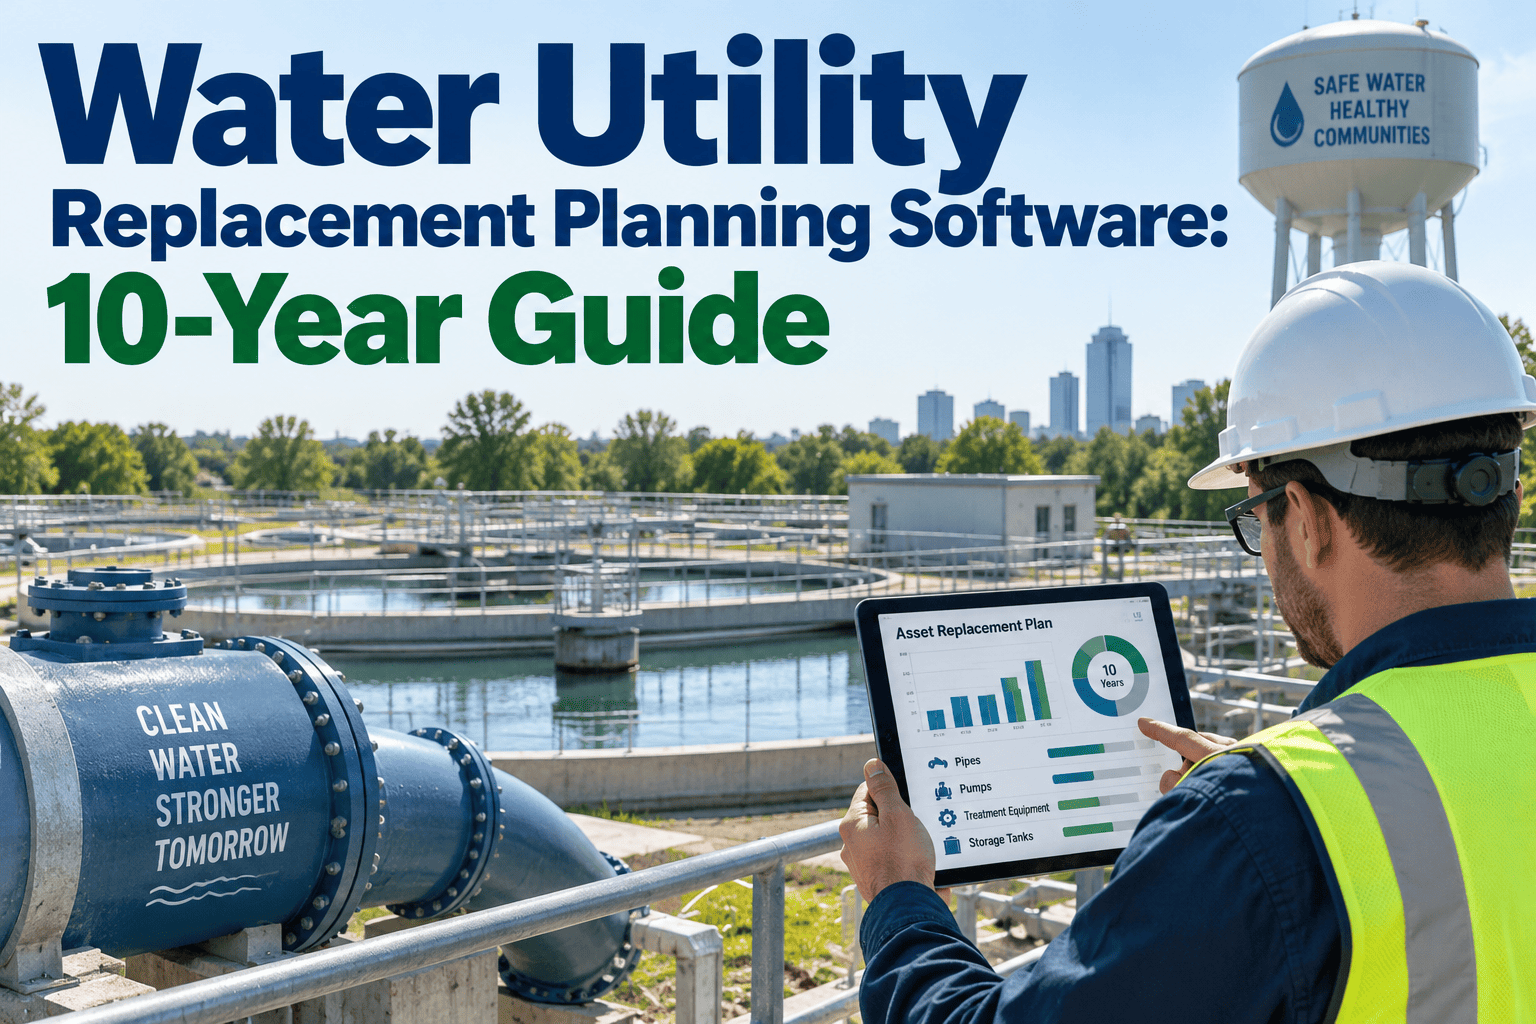
Every water and wastewater utility eventually faces the same spreadsheet problem: a long list of pipes, pumps, valves, and treatment assets that are all aging out around the same time, and a rate case hearing where a commissioner will ask exactly how that list was prioritized. Ten-year replacement planning is the discipline that turns "almost everything is old" into a defensible, year-by-year sequence that regulators can approve and a field crew can actually execute without guesswork. Utilities that get this right spread capital spending evenly across a decade instead of lurching between years of deferred maintenance and years of emergency spending. Utilities that get it wrong learn the hard way that a pipe segment costing a few hundred thousand dollars to replace on schedule can cost several million dollars once it fails in the ground and takes a road, a boil-water advisory, and a legal claim with it. This guide walks through how water and wastewater utilities build a ten-year replacement plan that survives regulatory review, and how a CMMS like OxMaint turns everyday maintenance data into that plan automatically.
The 10-Year Replacement Planning Guide for Water Utilities
Sequence pipes, pumps, valves, tanks, and treatment assets into a capital plan your rate commission approves on the first pass — built from the same data your maintenance team already collects.
Why a 10-Year Horizon Is the Right Planning Window
Most water and wastewater rate cases run on three-year cycles, which means a ten-year replacement plan typically spans three rate case filings. That window is long enough to smooth out the cost of replacing an entire pump station or a mile of transmission main across several budget years, and short enough that the underlying condition data does not go stale before it gets used. Utilities that plan only one rate case at a time end up re-litigating the same pipe segment every three years, while utilities with a ten-year sequence can show a commission exactly which nine or ten projects are coming, in what order, and why.
Six Asset Classes Every Replacement Plan Has to Sequence
A complete ten-year plan does not stop at pipes. Every asset class deteriorates on its own curve, and a plan that ignores the above-ground assets will look complete on a map while quietly missing the pump station that is actually closest to failure.
Distribution & Collection Pipes
Transmission mains, distribution lines, and sewer collection pipe. Material, soil conditions, and break history matter far more than installation year alone.
Pump & Lift Stations
Pumps, motors, and controls that fail suddenly rather than gradually, making runtime hours and vibration history the leading condition indicators.
Treatment Plant Equipment
Filters, clarifiers, blowers, and chemical feed systems, where replacement sequencing has to line up with permit and compliance deadlines.
Valves & Hydrants
Low unit cost but high operational consequence — a stuck valve can turn a routine repair into an unplanned outage across an entire zone.
Storage Tanks
Coating condition and structural inspections drive the replacement clock far more than the year the tank was originally commissioned.
SCADA & Instrumentation
The shortest replacement cycle in the plan, and the one most often forgotten because it is invisible compared to a pipe or a pump.
Age-Based vs Condition-Based vs Risk-Weighted Sequencing
Most utilities start with age-based replacement because it is the easiest sequence to build from a records system. It is also the easiest sequence for a rate advocate to challenge, because age alone does not prove that an asset actually needs the money this year rather than next year.
| Sequencing Method | Basis for Ranking | Rate Case Defensibility | Best Fit |
|---|---|---|---|
| Age-Based | Installation year only | Weak — easily challenged as arbitrary | Early-stage utilities with no condition data yet |
| Condition-Based | Inspection scores, break history, corrosion data | Moderate — needs consistent scoring records | Utilities with an active inspection program |
| Risk-Weighted | Condition score x consequence of failure | Strong — ties dollars to documented risk | Utilities preparing for commission review |
| Reactive Only | Whatever failed most recently | None — cannot be presented as a plan | No utility that wants to pass a rate case |
Building the Sequencing Model, Step by Step
A defensible ten-year plan is built from five data layers, and each layer is something a CMMS already collects as a byproduct of running daily maintenance operations rather than a separate paperwork exercise.
Build the Complete Asset Registry
Every pipe, pump, valve, hydrant, tank, and treatment component gets a record with material, size, installation year, GIS location, and replacement cost — the foundation everything else is layered on top of.
Score Condition, Not Just Age
Inspection results, break and repair history, corrosion readings, and maintenance frequency get converted into a standardized condition grade per asset class.
Rank by Consequence of Failure
A small distribution line under a farm road and a transmission main under a hospital carry very different failure consequences, even at identical condition scores.
Model Lifecycle and Replacement Cost
Total cost of ownership per asset class — acquisition, maintenance, energy, and repair spend — turns a rough replacement estimate into a number finance can defend.
Sequence Into Ten Annual Budgets
The ranked, costed list gets distributed across ten fiscal years so no single rate case carries an unreasonable spike, and every project has documented justification attached.
Stop Rebuilding Your Replacement Plan From Scratch Every Rate Case
OxMaint keeps the asset registry, condition history, and cost data connected year-round, so the next ten-year sequence is a report, not a project.
The Cost of Skipping the Plan
The clearest argument for structured replacement planning is not theoretical — it shows up in emergency repair budgets. A pipe segment left off a capital plan until years past its condition threshold does not quietly wait its turn; it fails, and the utility pays the difference between a planned project and an emergency response.
Scheduled excavation, single crew mobilization, no service disruption, budgeted a rate case in advance.
Emergency repair crews, road reconstruction, boil-water advisory response, and an unplanned rate impact.
Frequently Asked Questions
Do small water systems really need a 10-year replacement plan?
Any community water system serving 3,300 or more people falls under AWIA asset management requirements, and smaller systems benefit just as much from spreading capital costs evenly. Start with a free asset registry and build the plan around it.
How is a replacement plan different from a capital improvement plan (CIP)?
A CIP is the budget document; the replacement plan is the sequencing logic underneath it. The replacement plan explains why a project sits in year three instead of year seven, which is exactly what a rate commission asks about.
Can we build this in spreadsheets before moving to a CMMS?
Most utilities start there, but spreadsheets and GIS layers drift apart within a year because nothing keeps the condition, cost, and inspection data connected. A short walkthrough shows how that connection stays current automatically.
What data do rate commissions actually want to see?
Commissions respond best to condition evidence and consequence-of-failure scoring tied to dollar figures, not age lists alone. Documented inspection history is the single strongest defense against a challenged capital request.
How long does it take to get a first sequenced plan out of OxMaint?
Utilities typically import an existing asset list from spreadsheets or GIS exports and see a first risk-ranked sequence within days. Start free to try it against your own asset data.
Your Next Rate Case Should Not Start From a Blank Spreadsheet
Build the asset registry, condition scores, and risk-weighted sequence once, and let every future ten-year plan pull from the same living dataset instead of a fresh reconstruction project.