Every public agency capital committee has heard the same appropriation request before: a facilities director walks in with a spreadsheet, a photo of a failing roof, and a dollar figure that sounds large but explains nothing. Finance staff and elected officials cannot approve what they cannot verify, and a request built on urgency alone gets tabled for the next budget cycle while the underlying asset keeps deteriorating. Deferred maintenance backlogs across U.S. public agencies now exceed one trillion dollars combined, and the agencies that succeed in appropriation season are not the ones with the greatest need — they are the ones who arrive with Facility Condition Index scores, Repair Priority Index rankings, and cost avoidance projections a finance committee can defend to a legislature. Book a demo to see how OxMaint turns raw maintenance data into the appropriation package your agency has been missing.
Budget Strategy · Public Sector CMMS · Capital Appropriations
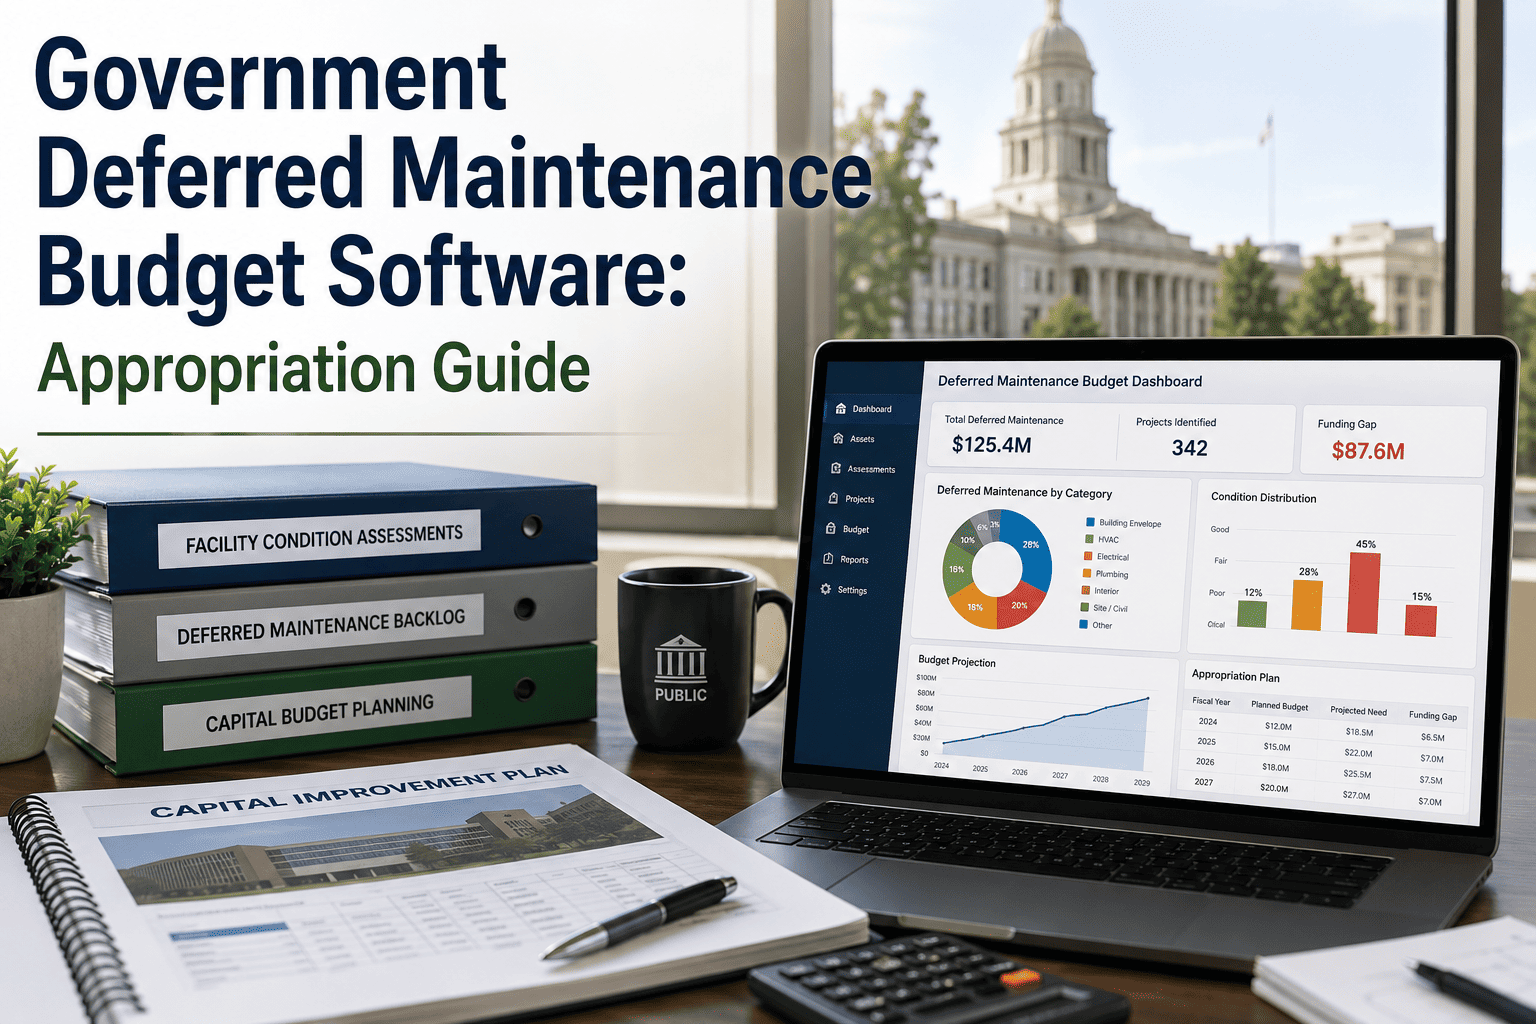
Government Deferred Maintenance Budget Software: The Appropriation Guide
A structured method for turning asset condition data into budget requests that survive finance committee review — built around the three numbers every appropriations reviewer actually asks for: FCI, RPI, and cost avoidance.
$1T+
Combined deferred maintenance backlog across U.S. federal, state, municipal, and school facilities
$8.6B
Minimum annual state shortfall for road and bridge maintenance alone, per Pew research
4-8x
Typical cost multiplier when a deferred repair becomes an emergency replacement
<5%
FCI threshold most public agencies target as "good" condition under APPA benchmarks
Why Deferred Maintenance Requests Get Denied Before They're Read
Budget officers reviewing a stack of capital requests are not evaluating need — every department believes its need is urgent. They are evaluating evidence. A deferred maintenance line item that shows up as a lump sum with no supporting data is the easiest line on the page to cut, because cutting it produces no immediate, measurable consequence in the year it is denied. The agencies that consistently win appropriations have replaced the lump sum with a documented case, and the pattern of what fails is remarkably consistent across nearly every jurisdiction, from small municipal public works departments to state facilities divisions managing hundreds of buildings.
Reviewers at the appropriations stage are almost never facilities professionals. They are finance staff, legislative analysts, or elected officials working through dozens of competing requests in a compressed review window, and they default to whichever request is easiest to evaluate against a standard. A packet that shows condition scores, a prioritized list, and a cost trajectory gives them exactly that standard. A packet that shows a narrative and a total dollar figure gives them nothing to compare it against, and requests that cannot be compared are the ones most often deferred to "next year" — which is precisely the cycle that built the backlog in the first place.
01
No condition data behind the number
A request describes symptoms — a leaking roof, a failing chiller — instead of a scored deficiency tied to a current replacement value. Reviewers cannot compare an unscored request against anything else on the docket.
02
No prioritization logic across the backlog
Every project in the request reads as equally urgent because nothing ranks life-safety risk against routine wear. Without a ranking method, the committee applies its own — usually the loudest complaint, not the highest risk.
03
No visible cost of waiting
Deferral is free in the current budget year and expensive later, but if the request does not model that trajectory, the committee has no reason to weigh this year's ask against next year's larger one.
The Three-Metric Defense Package
A defensible deferred maintenance budget request rests on three numbers, each answering a different question a reviewer will ask. Together they convert an appeal for funding into a data-backed proposal that stands on its own in a finance committee packet.
Condition
Facility Condition Index (FCI)
FCI = Deferred Maintenance Cost ÷ Current Replacement Value
FCI answers "how bad is it, relative to what it would cost to replace." A building at 3% FCI needs routine upkeep; one at 12% or higher is in the range most public frameworks flag for priority capital action. Reported consistently across a portfolio, FCI lets a committee rank buildings against each other instead of debating anecdotes.
Priority
Repair Priority Index (RPI)
RPI = Weighted score across risk, impact, and urgency factors
RPI answers "what gets funded first when the request is only partially approved." It scores each deficiency against life-safety risk, operational disruption, compliance exposure, and the rate at which the repair cost is growing — giving reviewers a ranked list instead of a flat one.
Trajectory
Cost Avoidance Projection
Cost Avoidance = Future Reactive Cost − Current Planned Cost
Cost avoidance answers "what does saying no cost us." It models what a deferred repair is projected to cost if it becomes an emergency replacement in two, five, or ten years, reframing the request from a spending decision into a debt-avoidance decision.
Appropriation Season Prep
Stop Rebuilding Your Budget Justification From Scratch Every Cycle
OxMaint calculates FCI and RPI automatically from your maintenance and asset data, and generates the cost avoidance projections your finance committee expects to see attached to every capital request.
Scoring the Repair Priority Index: What Goes Into the Ranking
RPI is only credible if the scoring criteria are consistent and documented. The table below shows the weighting structure most public agencies use to rank a deferred maintenance backlog, and where the underlying data for each factor should come from.
| Scoring Factor |
Weight |
What It Captures |
Data Source |
| Life-safety risk |
30% |
Fire, structural, electrical, or code-related risk to occupants if the repair is deferred another cycle |
Inspection records, code compliance flags, incident history |
| Operational impact |
25% |
Degree to which the deficiency disrupts core services — a closed wing, a failed HVAC zone, a shut lift station |
Downtime logs, service interruption records |
| Cost escalation rate |
20% |
How quickly the repair cost is projected to grow if deferred another year, based on deterioration curve |
Historical work order cost trends, condition assessments |
| Compliance exposure |
15% |
Regulatory, ADA, or grant-condition requirements tied to the asset that create audit or funding risk |
Compliance tracking module, grant condition records |
| Asset criticality |
10% |
How essential the asset is to the mission of the facility or system relative to redundant or minor assets |
Criticality classification set at asset record creation |
What Waiting Actually Costs: A Deferral Trajectory Model
The single most persuasive chart in an appropriation packet is not the current repair estimate — it is what that estimate becomes if the request is denied again. Deterioration compounds, and construction and material costs have climbed 40 to 50 percent over the past decade in many regions, so a delayed repair rarely stays flat. The illustrative model below reflects the kind of escalation public sector capital planners commonly see between an initial planned repair and the eventual reactive replacement.
Year 1 — Planned Repair
Baseline cost
Year 3 — Deferred Once
~1.5–2x baseline
Year 5 — Deferred Twice
~3x baseline
Year 10 — Reactive Replacement
~5–6x baseline
This is the model reviewers respond to: a modest planned repair this cycle against a multiple of that cost if the request is deferred through two or three more budget years. Presenting both numbers side by side reframes deferred maintenance funding as debt service rather than discretionary spending.
From Maintenance Data to a Finance-Ready Request
1
Score every asset for FCI
Every logged deficiency and its estimated cost to cure rolls up into an FCI per building and per system, calculated against a current replacement value rather than an outdated purchase cost.
2
Rank the backlog by RPI
The weighted scoring model applies automatically across every open deficiency, producing a ranked list rather than a flat inventory of equally-urgent items.
3
Model the cost avoidance curve
Each top-ranked item is projected forward using its deterioration and escalation history, producing the year-over-year comparison that makes the case for funding now instead of later.
4
Export the appropriation package
FCI, RPI rankings, and cost avoidance projections compile into a report format finance committees and legislative budget offices already recognize, ready to attach to the capital request.
Reviewing capital requests for two decades taught me one thing: committees do not deny deferred maintenance funding because they don't believe the need is real. They deny it because the request does not give them anything to defend when a colleague asks why this building over another. An FCI score, a ranked repair list, and a cost avoidance number turn a plea into a case. That is the entire difference between a request that gets tabled and one that gets funded on the first pass.
Diane Castellano, CGFM
Certified Government Financial Manager · 16 years in public sector capital budget review and appropriations analysis
Frequently Asked Questions
What is the difference between FCI and RPI in a budget request?
FCI scores overall building or portfolio condition as a percentage of replacement value, useful for ranking facilities against each other. RPI ranks individual deficiencies within the backlog by risk and urgency, useful for deciding what gets funded first if the full request is not approved. Most finance committees expect both.
Start free to see them calculated together.
How often should an agency recalculate FCI before submitting a request?
Annually at minimum, and ideally continuously as work orders close. A static FCI calculated once every three to five years understates current backlog, since replacement value should be adjusted for construction inflation each year and deferred items keep accumulating in the interim.
Can cost avoidance data really change a legislature's funding decision?
It changes the framing of the decision. A request positioned as "fund $500,000 now or face a $2.5 million reactive replacement in five years" gives reviewers a fiscal argument rather than a maintenance argument, which is the language budget committees are built to evaluate.
Do smaller municipalities need software for this, or can it be done in a spreadsheet?
A spreadsheet can hold the numbers for one budget cycle, but FCI, RPI, and cost avoidance are only credible when the underlying data — inspections, work orders, condition updates — stays current year over year.
Book a demo to see how that data collection stays automatic rather than a manual rebuild each cycle.
What documentation do grant-funded and federally reviewed projects typically require?
Beyond FCI and RPI, grant reviewers commonly expect documented condition assessments, a maintenance history per asset, and evidence that the requesting agency has a preventive maintenance program in place — not just a one-time repair ask.
Government Capital Planning · OxMaint
Your Next Appropriation Request Should Defend Itself
OxMaint turns your maintenance and asset data into the FCI scores, RPI rankings, and cost avoidance projections that finance committees and legislative budget offices expect — so every deferred maintenance request goes in backed by evidence, not urgency alone.