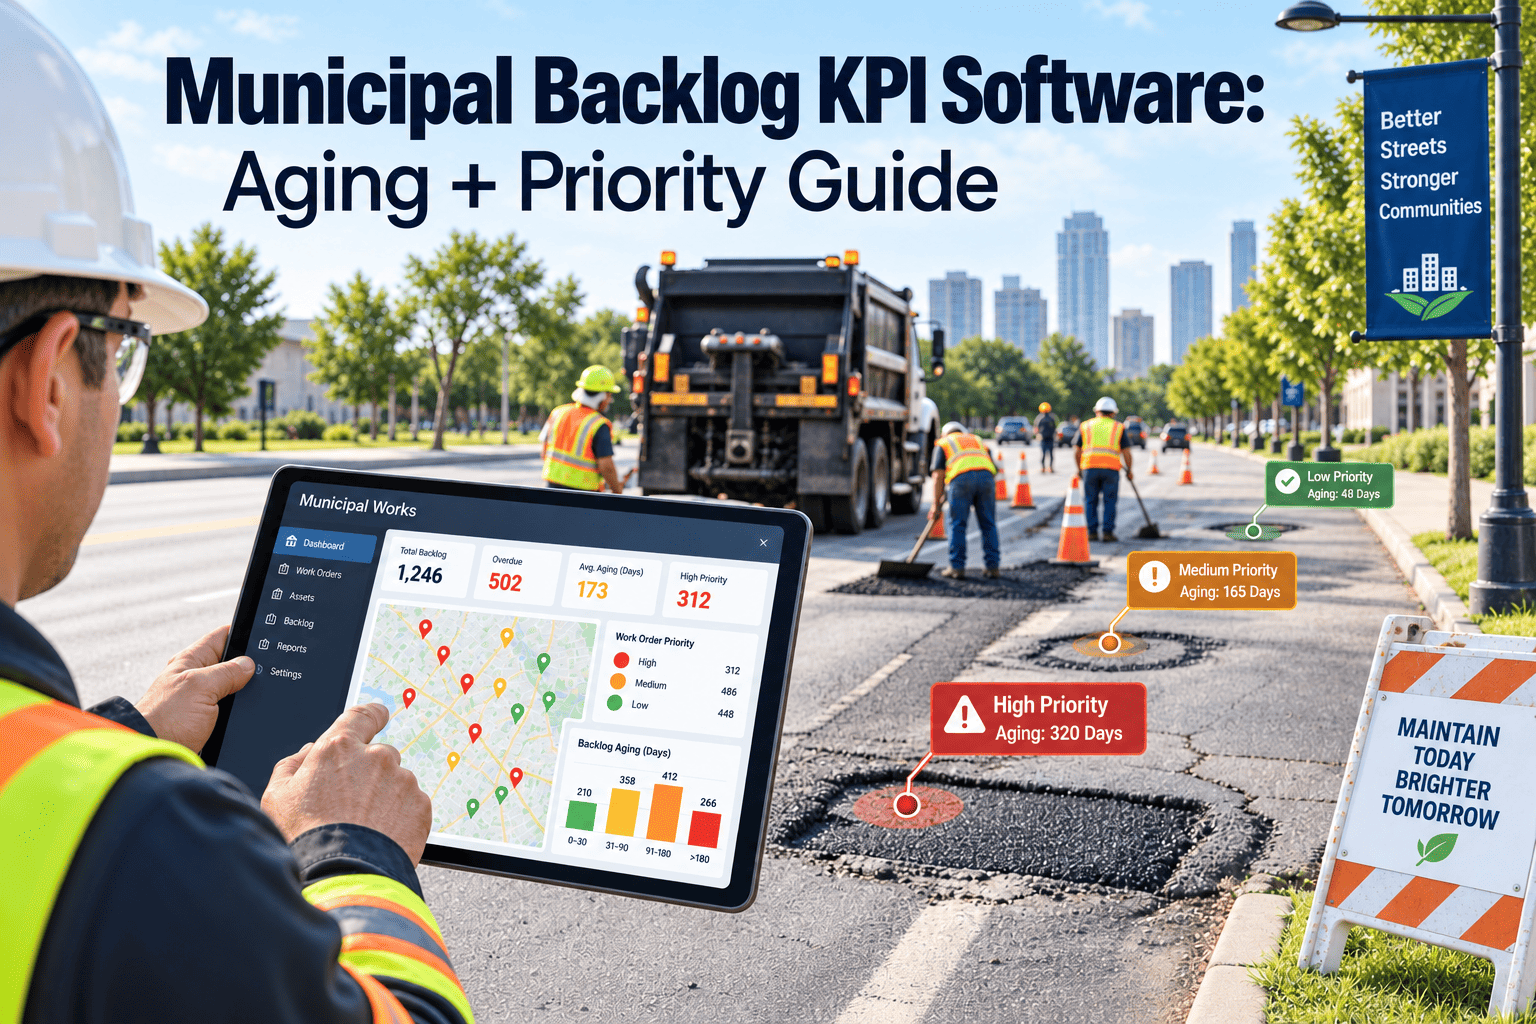
Every public works director inherits a backlog on day one, and the number itself rarely tells the full story. A department can report "412 open work orders" and that figure alone says nothing about whether those are mostly two-day-old pothole reports or six-month-old sidewalk repairs sitting behind a budget freeze. What actually matters is the shape of the backlog — how it is aging, how it breaks down by priority, and how fast the team is closing work relative to how fast new requests arrive. Most municipal teams track total open orders and monthly closures, but neither number explains whether the backlog is stable, shrinking, or quietly turning into a liability the council will ask about at the next meeting. OxMaint turns raw work order data into an aging distribution, a priority mix, and a closure velocity trend that a director can actually act on.
See Your Backlog by Age and Priority, Not Just by Total Count
OxMaint breaks every open work order down by how long it has been waiting and how urgent it actually is, so leadership sees the real operational risk hiding behind a single flat backlog number on a monthly report.
What a Backlog KPI Actually Needs to Measure
A backlog KPI worth reporting to a city council needs three things layered together: how old each open item is, how urgent it was rated when it came in, and whether the total is trending up or down relative to new requests arriving. A single "open work orders" count fails all three tests at once — it treats a same-day pothole report the same as a six-month-old drainage complaint, and it says nothing about direction, only a snapshot at one moment in time.
Priority without age hides risk just as badly as age without priority. A high-priority water main concern sitting open for three days is a normal part of daily operations. The same priority level sitting open for three weeks is a very different problem, and a backlog report that only shows priority counts, without an aging layer underneath, will never surface that distinction until a resident or council member does it for you.
Direction matters just as much as the snapshot itself. A backlog of 200 open items that was 250 last month is trending in a very different place than a backlog of 200 that was 140 last month, even though both departments would report the identical total today. Without a closure velocity figure sitting next to the aging and priority breakdown, a director is left comparing two single numbers a month apart and guessing at what changed in between.
Why Aging Distribution Beats a Flat Backlog Count
A flat backlog count answers one question — how many things are open right now — and nothing else. It cannot tell a director whether the department is falling behind or simply carrying a stable, healthy volume of in-progress work. Two departments can both report 300 open orders, but one has 80 percent of that backlog closing within two weeks while the other has a third of it sitting untouched for two months, and those are two entirely different operational realities wearing the same headline number.
An aging distribution changes the conversation from a single scary number into a shape that leadership can actually respond to. A backlog that is front-loaded with recent requests and thins out quickly in the older bands is healthy, even if the total looks large. A backlog with a long tail stretching past ninety days is the one that deserves a resourcing conversation, regardless of how the total count compares to last quarter.
What Happens When Backlog Aging Goes Untracked
Without an aging view, the oldest items in a backlog tend to become invisible by default. New requests arrive every day and naturally pull attention toward themselves, while a request that has already been open for two months has no built-in mechanism to resurface itself — it simply sits, sorted somewhere below the newer, more urgent-looking items, until a resident calls to ask why nothing has happened. By the time that call comes in, the item has often aged well past the point where a simple fix would have resolved it.
The reputational cost compounds the operational one. A council member fielding a constituent complaint about a request that has sat open for four months is not going to be satisfied by a total backlog count that looks stable. They want to know why that specific item aged out, and a department without an aging report has no good answer beyond a general sense that the team has been busy, which rarely lands well in a public meeting.
There is a quieter cost too, felt inside the department rather than at the council podium. Crews working from a queue with no visible aging signal tend to focus on whatever feels most urgent today, which means the same handful of stale, unpleasant items get passed over repeatedly by whoever is assigning work. That pattern erodes morale over time, since the team ends up aware that a few requests keep aging further without anyone being told clearly whose job it is to finally close them out.
From Reactive Assignment to Proactive Backlog Management
Most crews work the queue in roughly the order it arrives, which feels fair on any given day but quietly disadvantages older items that have already slipped behind newer, more visible requests. Without an aging view actively surfacing the oldest tickets, a request can sit untouched for weeks simply because nothing in the daily workflow forces anyone to look at it again once it scrolls past the first page of the queue. The item was never deprioritized on purpose — it just stopped being visible.
Proactive backlog management flips that default. Instead of waiting for the oldest items to surface themselves, a weekly review actively pulls them forward and assigns them directly, regardless of when they happen to sit in the raw queue order. This does not mean abandoning priority levels — a genuine emergency still jumps the line — but it does mean the routine, lower-urgency items that make up most of a backlog's aging tail get resolved on a predictable cadence instead of by chance.
A department sitting consistently in the critical band is not simply short-staffed for a week — it usually reflects a structural gap between incoming request volume and crew capacity that needs a resourcing decision, not another push to clear tickets faster. Reviewing this scale monthly alongside seasonal trends keeps the target realistic rather than arbitrary.
Root Causes Behind a Growing Municipal Backlog
A backlog rarely grows for one single reason, and treating every increase the same way leads to the wrong fix. Identifying which cause is actually driving the trend is what separates a useful KPI review from a generic call for the team to work faster.
Know Whether It's Volume, Priority, or Capacity Driving the Backlog
OxMaint separates backlog growth into aging trends, priority mix, and closure velocity, so leadership can target the actual root cause instead of applying the same generic fix to every increase in the queue.
Backlog by Department — Sample Breakdown
Comparing departments side by side, rather than reporting one citywide backlog figure, is what actually shows a director where to focus limited resources. A citywide total of 6 percent aged past 30 days can hide one department running clean and another quietly falling behind every week.
| Department | Open Orders | Aged 30+ Days | Aged Rate | Status |
|---|---|---|---|---|
| Streets & Roads | 146 | 9 | 6.2% | Healthy |
| Water & Sewer | 98 | 21 | 21.4% | Watch |
| Parks & Facilities | 112 | 38 | 33.9% | Critical |
| Fleet & Equipment | 74 | 5 | 6.8% | Healthy |
A Weekly Backlog Review Workflow
The value of a backlog KPI comes from reviewing it on a consistent cadence, not from generating one report before a budget hearing and setting it aside for another year. A short weekly review keeps small aging problems from turning into the kind of number that shows up in a council meeting.
We used to report one backlog number and hope it looked flat compared to last month. Now we see the aging bands every week, and our Parks team caught a growing tail of requests before it ever became a council question. That visibility alone changed how we staff seasonal work.
Where This Fits Into an Existing Work Order System
A department does not need to replace the work order system crews already use every day to get an aging and priority view on top of it. The goal is to take the fields that already exist — created date, priority, department, and status — and layer aging bands and closure velocity calculations on top, so the same data crews are already entering produces a KPI view without any extra data entry on their end.
For most municipalities, this starts with a single department as a pilot, usually the one with the most visible backlog complaints, before expanding citywide once the aging bands and priority mix prove useful in an actual weekly review. Crews keep logging work the same way they always have — the aging distribution and closure velocity trend simply update automatically underneath that existing process, ready for the next leadership review without anyone building a report by hand.
Frequently Asked Questions
Track Aging, Priority, and Closure Velocity in One View
OxMaint turns your existing work order data into a live aging distribution and closure velocity trend, so your next council report starts with a clear picture instead of a guess built from memory and a rough monthly total.