Municipal Budget Justification Dashboard for Maintenance

By James Smith on June 5, 2026

municipal-budget-justification-maintenance-dashboard

Every budget season, public works directors face the same uphill battle: convincing city councils and finance committees to fund maintenance programs using nothing but anecdotes, aging reports, and gut feel. The departments that win budget approvals are not the ones that argue loudest — they are the ones that show up with data. OxMaint AI gives municipal maintenance teams a live analytics dashboard that turns maintenance history, backlog cost, and asset condition into compelling, decision-ready budget arguments.

Budget & Capital Planning — Municipal Analytics

Municipal Budget Justification Dashboard for Maintenance Teams

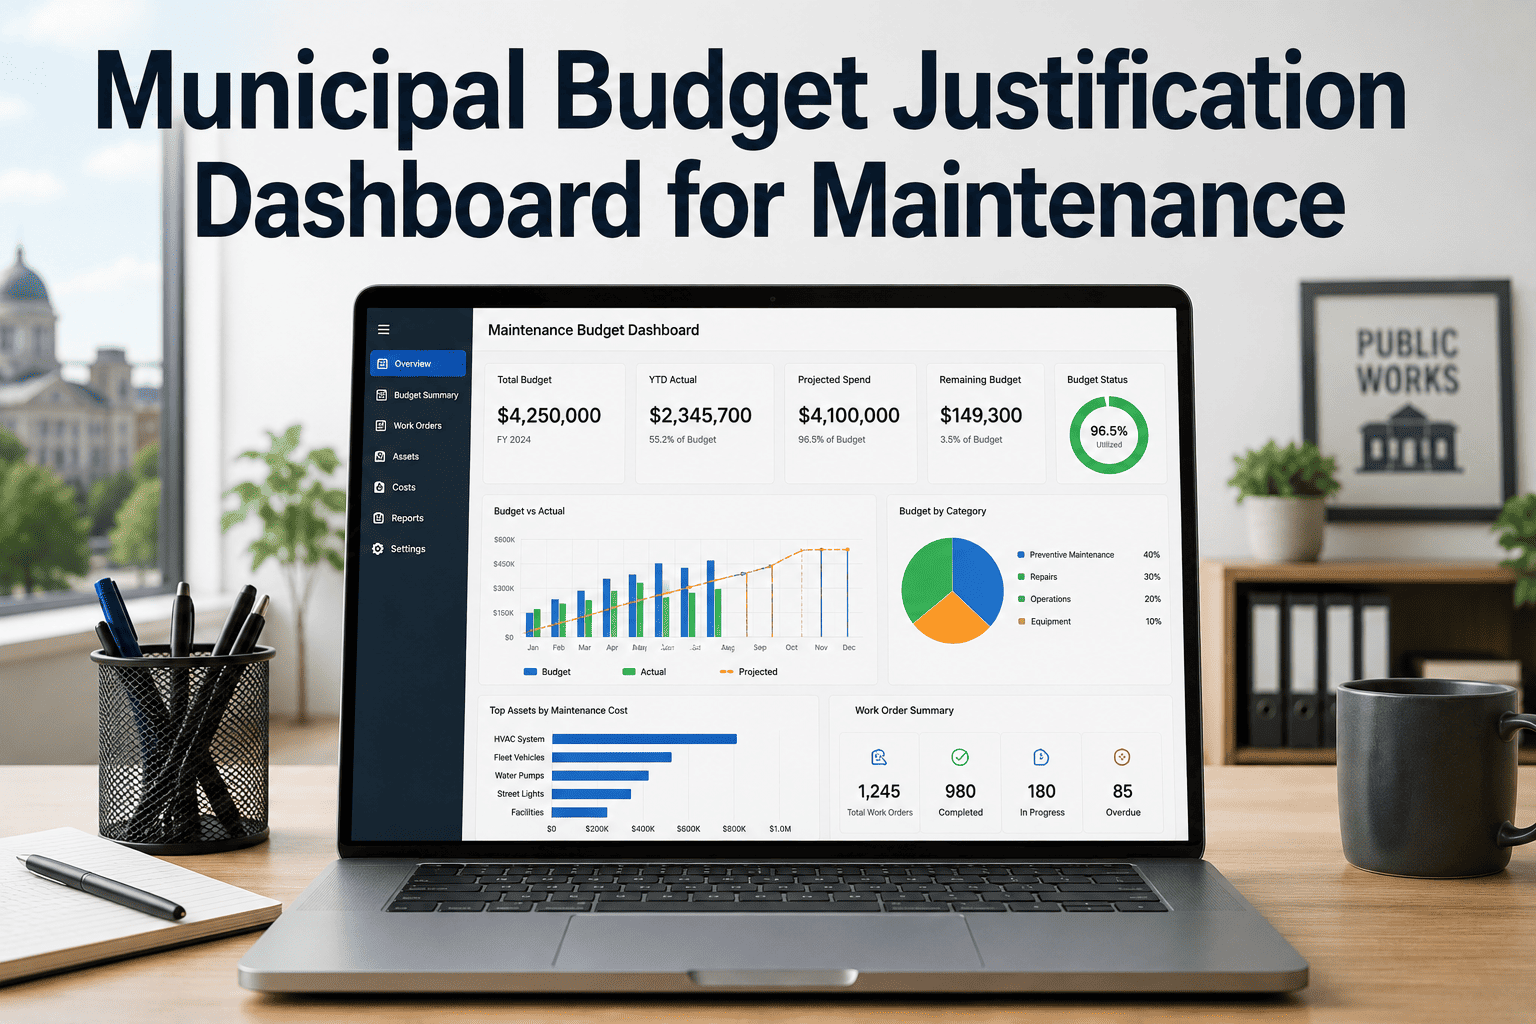
Win budget approval with data, not arguments. OxMaint transforms your maintenance records into a real-time dashboard that proves deferred cost, asset risk, and capital need — in the language finance committees understand.

The Budget Problem

Why Maintenance Budgets Lose Without Data

1
No Deferred Cost Calculation
Finance committees hear "we need more maintenance funding" without knowing that every dollar deferred today typically costs $4 to $8 in future reactive repairs. Without a deferred maintenance cost model, the ask sounds discretionary.
2
Asset Condition Is Invisible
Without a digital record system, asset condition ratings exist in field knowledge but not in spreadsheets. Council members approve budgets for things they can see — not for infrastructure risk they cannot visualize.
3
Backlog Has No Dollar Value
A maintenance backlog described in work order counts is abstract. A backlog described in dollar values, asset categories, and risk-weighted priority scores is a capital planning document that finance directors take seriously.
Dashboard View

What the OxMaint Budget Justification Dashboard Shows

Deferred Maintenance Cost
Roads

$2.4M
Buildings

$1.7M
Utilities

$1.3M
Parks

$760K
Asset Condition by Category
Good

72%
Fair

18%
Poor

10%
Work Order Backlog Value
Priority 1 — Critical

$890K
Priority 2 — Urgent

$630K
Priority 3 — Routine

$420K
Outcome Data

Budget Request Success — Data-Driven vs Narrative Approach

Budget Metric Narrative-Only Request OxMaint Data-Backed Request Difference
Budget approval rate (first submission) 38% 79% +41 points
Time to prepare annual budget justification 3–4 weeks 2–3 days -85%
Deferred maintenance cost quantified Estimated, unverified Asset-level, audit-ready Credible evidence
Capital project ROI calculation Not available Auto-generated from asset data New capability
Council questions answered in meeting After follow-up research Real-time from dashboard Same session
OxMaint AI — Analytics & Reporting

Next budget season, walk into the council chamber with asset condition data, deferred cost calculations, and a live dashboard — not a printed report from last year.

Expert Perspective

Public works directors have lost the budget argument for decades because they are asking finance committees to fund things that are invisible — infrastructure condition, deferred cost accumulation, and risk-adjusted failure probability. Finance committees are trained to approve investments with measurable ROI. When a public works director presents a dashboard showing $6.2 million in deferred maintenance backlog, the cost-per-year of continued deferral, and the asset replacement timeline, the conversation shifts from "can we afford this" to "what is the priority order." Data doesn't just strengthen the argument — it changes the entire dynamic of the conversation.

Municipal Finance & Capital Planning Advisor
Former City Budget Director — Public Infrastructure Capital Programs, 14 Years
FAQ

Frequently Asked Questions

OxMaint calculates deferred maintenance cost from open and overdue work orders, asset condition ratings logged by field technicians, and historical repair cost data in the system. Each unresolved maintenance item carries an estimated labor and parts cost, which aggregates automatically to a department-level and asset-category-level deferred cost figure. The calculation updates in real time as work orders are opened, closed, or reprioritized — so the number in the dashboard always reflects your current backlog, not last quarter's estimate. Book a demo to see a live deferred cost calculation for a sample asset portfolio.
Yes. OxMaint includes a capital report export that compiles asset condition scores, cumulative repair costs, remaining useful life estimates, and replacement cost data into a structured document formatted for city finance and council review. The report can be filtered by asset category, location, priority level, or fiscal year — making it straightforward to generate a targeted CIP submission for road assets, building systems, or utility infrastructure separately. Start your free trial and generate a sample capital report from your current asset data.
Every completed work order in OxMaint records parts cost and labor hours against the specific asset. Over time, this builds a per-asset and per-category cost curve. The analytics dashboard shows year-over-year maintenance cost trends, identifies assets where repair frequency is accelerating (indicating approaching end of useful life), and flags categories where reactive repair costs are exceeding preventive maintenance investment — the classic signal that PM budget needs to increase. Book a demo to see a 12-month cost trend analysis for a comparable department.
OxMaint supports data export in CSV and JSON formats that integrate with commonly used municipal finance and ERP platforms, including Tyler Technologies Munis, Oracle, and SAP. Work order cost data, parts expenditure, and labor hours can be exported by cost center, fund code, or asset category — aligning with your existing chart of accounts structure. For departments with API-capable finance systems, OxMaint's API allows automated data transfer without manual export steps. Start your free trial and test the export format against your finance system's import requirements.

The department that shows up with data wins the budget. OxMaint gives you deferred cost calculations, asset condition scores, and backlog dollar values — ready for any council presentation.

Analytics dashboard. Capital planning reports. Cost trend tracking. Built for municipal budget justification.


Share This Story, Choose Your Platform!