Most public works departments already own every piece of a digital twin — they just live in separate boxes that never speak to each other. The asset registry sits in a spreadsheet, GIS in another platform, inspection photos on a field tablet, SCADA and sensor feeds in a control room, and work orders in a fourth system entirely. A practical digital twin is not a glossy 3D city model; it is those operational layers fused into one live record per asset, so a sensor reading, a condition score, and a work order all describe the same pipe at the same time. This case study shows how a representative municipality builds that twin from data it already has, using OxMaint GIS, IoT, and Analytics integration to move from reactive break-fix to predictive operations. Book a demo to map your own assets onto a working twin.
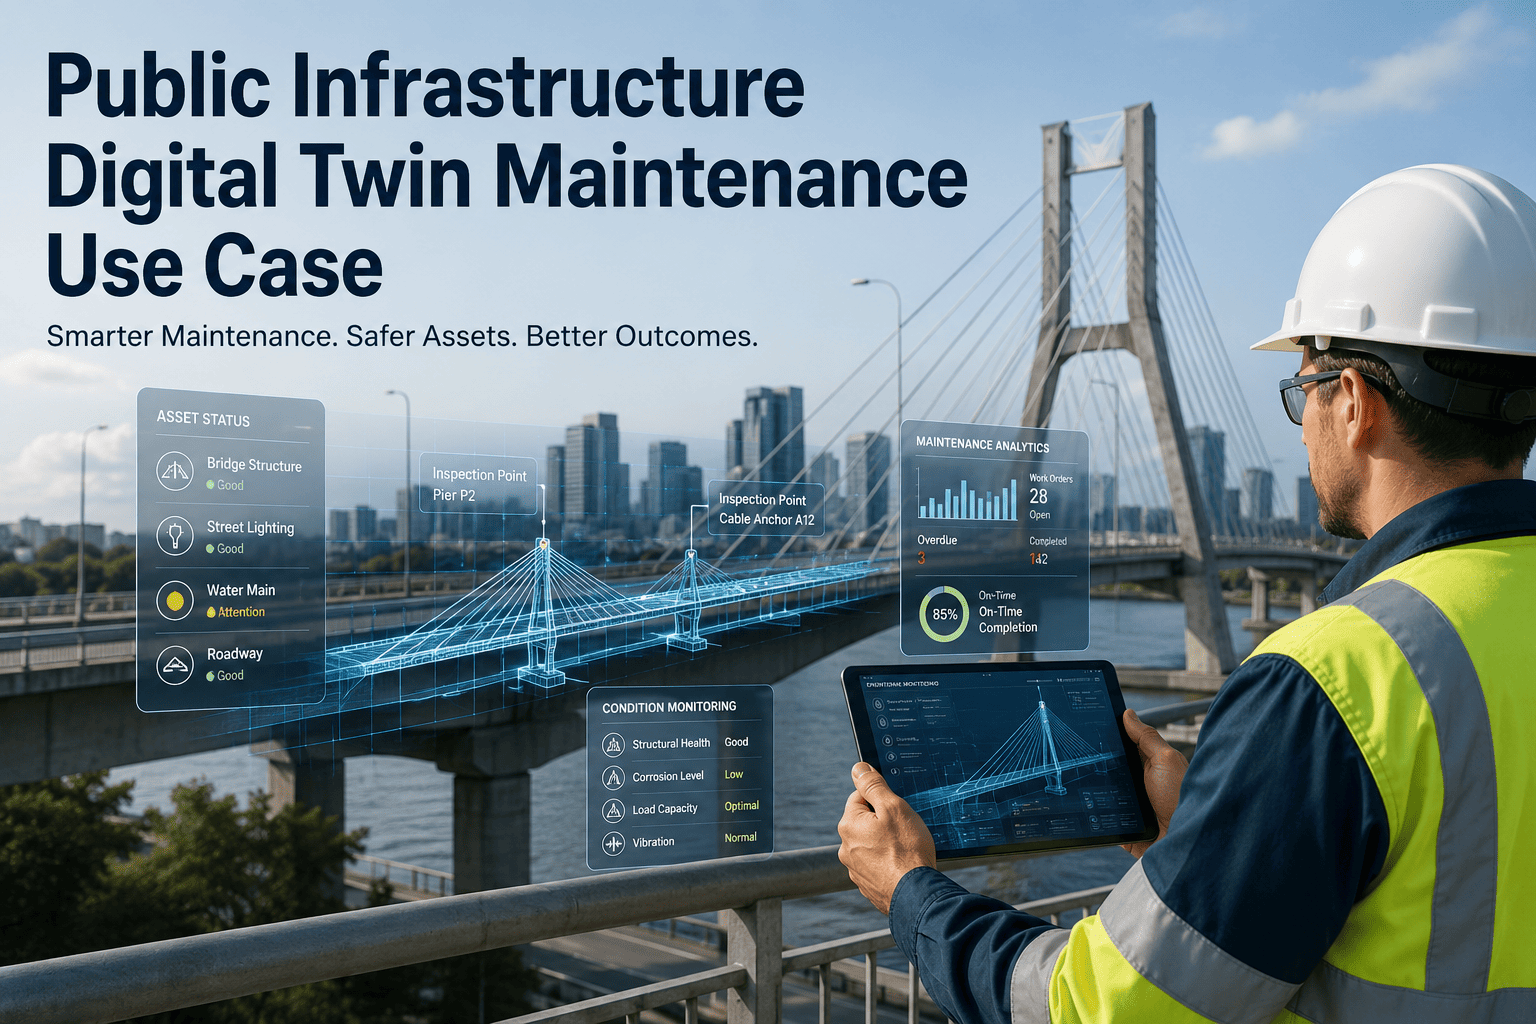
Public Infrastructure Digital Twin Maintenance Use Case
How a mid-size public works department turns asset data, GIS, sensors, inspections, and work orders into a practical digital twin — and shifts from chasing failures to predicting them across water, stormwater, bridges, and streetlights.
The Data Exists — It Just Doesn't Connect
Traditional inspection and maintenance still lean on manual surveys and isolated sensing campaigns, which leave behind fragmented datasets, high costs, and delayed interventions. The department in this case managed roughly 12,000 assets across four networks, but answering a simple question — what condition is this asset in, and when did we last touch it — meant opening five systems and reconciling them by hand.
Each box held real value; the cost came from the gaps between them. A digital twin closes those gaps by making one record the single source of truth for each asset.
Six Layers That Make a Practical Twin
A working twin is built from operational data, not from a render. Each layer adds context to the asset record, and the analytics layer turns the combined picture into foresight.
From Spreadsheets to Foresight in Four Moves
The department did not boil the ocean. It connected what it had, instrumented only the assets where failure was expensive, and let the analytics layer earn its keep on the highest-consequence networks first.
Linked the asset inventory to GIS so every pipe, pump, bridge, and light had a verified location and network position.
Added IoT sensors to high-consequence assets — water main pressure, lift-station levels, and bridge accelerometers — not the entire network.
Mobile inspections wrote condition scores and photos straight to the asset record, replacing PDFs scattered across tablets.
A pressure anomaly flagged a likely main break ~72 hours out; the twin auto-raised a work order and the crew repaired it before it failed.
OxMaint connects your GIS, sensor feeds, inspections, and work orders into one asset record — then its analytics surface the deviations that precede failure, so your crews schedule the repair instead of racing the emergency.
Reactive Model vs. Twin-Enabled Operations
The figures below reflect outcomes documented across comparable smart-infrastructure deployments — the direction and scale a connected twin makes realistic, not a guarantee for every system.
| Measure | Reactive Break-Fix | Twin-Enabled |
|---|---|---|
| Failure warning lead time | None — found at failure | Up to 72 hours ahead |
| Unplanned maintenance events | Baseline | Down ~78% |
| Service downtime | Baseline | Down ~45% |
| Asset data retrieval | Hours across 5 systems | Seconds in one record |
| Capital planning basis | Age estimates | Condition + sensor data |
Where Your Program Sits Today
A digital twin is the top of a ladder most departments are already climbing. You do not jump to the top — you connect one more layer at a time, and each rung pays for the next.
What Public-Asset Professionals Say
People hear "digital twin" and picture an expensive 3D render of the city. That is the marketing, not the value. The value is your operational data finally talking to itself — GIS, inspections, sensors, and work orders describing the same asset in one place. Start with asset data, location, and work-order history; add sensors only where a failure actually hurts. That sequence is affordable and it works.
Public Works Asset Manager · 19 Years Municipal InfrastructureA twin is only as smart as the maintenance history feeding it. Sensors tell you something changed; the work-order record tells you what that change has meant before and what to do about it. Departments that bolt sensors onto a system with no maintenance data get alarms they cannot interpret. Connect the work orders first, then the predictions actually mean something.
Infrastructure Data & Analytics Lead · 15 Years GIS and Asset SystemsFrequently Asked Questions
Do we need a full 3D model to start a digital twin?
No — a practical twin starts with the operational layers you already own: asset registry, GIS location, inspections, and work orders. A 3D or BIM model is optional richness you can add later for specific assets like bridges. Book a demo to see a data-first twin in action.
Which assets should get IoT sensors first?
Instrument by consequence of failure, not by convenience — the assets whose failure causes overflows, outages, or public-safety risk earn sensors first, while low-risk assets stay on inspection cycles. This keeps cost down and impact high. Start free to prioritize by criticality.
How does a twin strengthen capital planning and grant applications?
It replaces age-based guesses with condition and sensor evidence, producing risk-ranked, defensible capital plans that score higher with funding reviewers. The same fused data supports both daily operations and long-term investment cases. Book a demo to see the analytics outputs.
Your Digital Twin Is Mostly Built — It Just Needs Connecting
OxMaint fuses the asset, GIS, sensor, inspection, and work-order data you already have into one live record per asset — turning scattered systems into a predictive operations platform for water, stormwater, bridges, and streetlights alike.