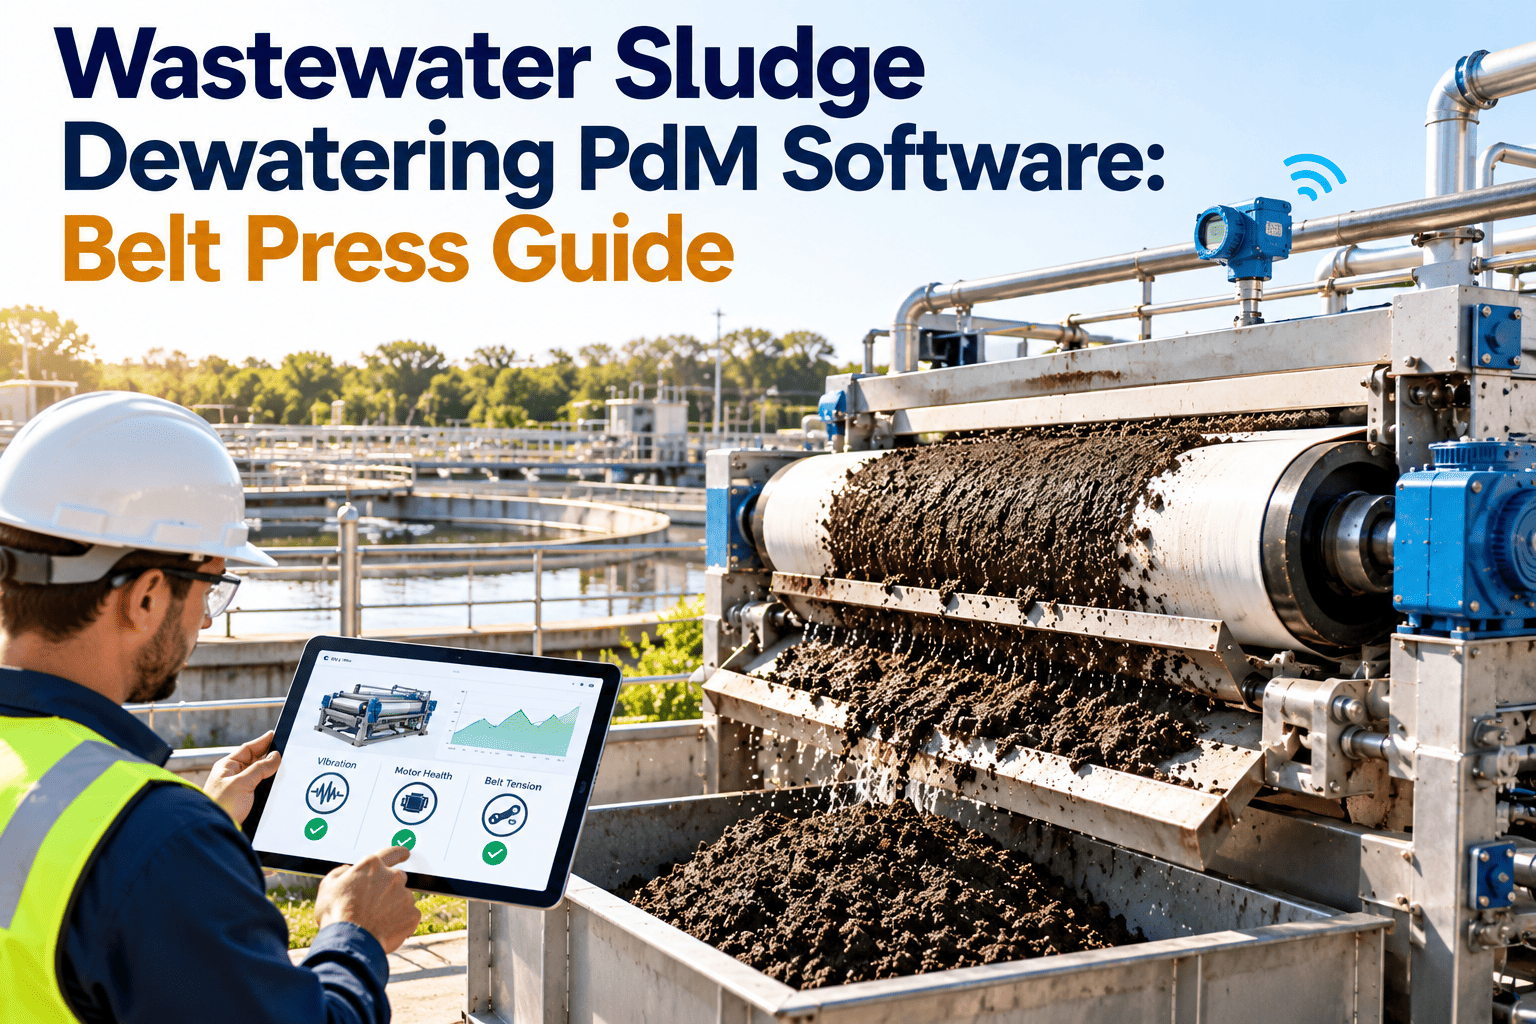
Sludge dewatering is where a wastewater plant either recovers value from its solids or quietly pays for every wet ton it hauls away. Belt presses, centrifuges, and screw presses work in abrasive, corrosive conditions, and small wear problems show up as wetter cake, rising polymer use, and unplanned stops. Predictive maintenance replaces surprise breakdowns with planned repairs based on vibration, torque, wear, and performance trends. This guide covers the critical components on each machine and how a wastewater CMMS turns those signals into scheduled work and dependable biosolids records.
Sludge Dewatering PdM Software for Wastewater Plants: A Belt Press, Centrifuge, and Screw Press Guide
Wear inside a dewatering unit rarely announces itself. Track the components that control cake solids, polymer cost, and uptime, and send every finding straight into a work order.
Why Dewatering Reliability Sets Your Biosolids Cost
Nearly every dewatering problem ends the same way: more water in the cake. Water is heavy, and you pay to move it.
Wear or misadjustment
Scroll wear, a damaged belt, a blinded screen, or drifting alignment.
Weaker separation
Solids escape into the filtrate or centrate and return to the plant.
Chemical compensation
Operators raise polymer dose to protect cake quality.
Wetter cake, more trips
More wet tons are hauled for every dry ton produced.
Disposal exposure
Rejected loads, tight storage, and extra records to explain gaps.
Three early cost signals worth trending
- Cake solids from routine samples, logged against the unit and the shift
- Polymer used per dry ton of solids, not only total polymer consumed
- Solids in filtrate or centrate, which shows capture rate slipping
None of these proves a mechanical fault alone. Together with condition data, they show whether to adjust the process or open the machine.
Three Machines, Three Wear Profiles
Belt presses, centrifuges, and screw presses remove water differently, so they wear and fail differently. Plan monitoring around the machine, not around a generic pump template.
| Question | Belt press | Centrifuge | Screw press |
|---|---|---|---|
| How it removes water | Conditioned sludge drains by gravity, then is squeezed between belts over rollers | A rotating bowl separates solids by centrifugal force while a scroll moves cake out | A slowly turning screw compresses sludge against a cylindrical screen |
| Most wear-prone parts | Filter belts, roller bearings, tracking and tensioning parts, wash nozzles | Scroll flights and wear tiles, bowl surfaces, main bearings, gearbox | Screw flights, screen surfaces, seals, drive gearbox |
| Early warning | Belt wandering, cloudy filtrate, weaker wash spray, frayed edges | Rising vibration, bearing temperature, torque changes, poorer centrate | Rising motor current, blinded screen, more wash demand, solids in filtrate |
| Failure that stops the unit | Torn belt, seized roller, failed tracking | Bearing failure, imbalance trip, gearbox damage | Damaged screw or screen, seal leak, gearbox failure |
| Main maintenance demand | Frequent inspection and consumable replacement | Condition monitoring and periodic specialist rebuilds | Screen cleaning, wear checks, and drive care |
| Spares to plan for | Spare belt, roller bearings, wash nozzles | Bearing sets, gearbox parts, wear components on exchange | Screen sections, seals, wash spray parts |
Separating Mechanical Faults From Process Problems
A common and expensive mistake is replacing parts to fix a problem that began upstream. Check the cheap explanations first, and record what you found.
| Symptom | Mechanical suspects | Process suspects | Check first |
|---|---|---|---|
| Cake is wetter than usual | Worn scroll, lost belt pressure, blinded screen, damaged belt | Feed solids changed, polymer dose or mixing off, sludge type changed | Feed solids and polymer dose compared with the last good week |
| Filtrate or centrate is cloudy | Belt edge leak or tear, scroll wear, screen damage | Under-dosed polymer, weak floc formation | Floc quality, then belt or screen condition |
| Vibration is climbing | Uneven wear causing imbalance, bearing wear, loose mounts | Uneven feed or product build-up | Trend against baseline, then mounts and lubrication |
| Torque or current keeps rising | Worn gearbox, dragging bearing, packed flights | Higher feed solids or higher feed rate | Feed rate and solids before any teardown |
| Polymer use is creeping up | Worn parts forcing more chemical | Sludge characteristics, aged polymer, make-down problems | Polymer concentration and pump calibration |
| Frequent short stops | Sensor faults, sticking actuators, interlock trips | Feed surges causing overload | Alarm history and interlock logs |
Put Every Dewatering Unit on a Maintenance Schedule
Build the asset hierarchy for each press, centrifuge, and screw press, then link PMs, inspections, and spares to it.
The PM Ladder: From Every Shift to Every Overhaul
These intervals are starting points. Follow the manufacturer's manual, then adjust using your own run hours and failure history.
One Symptom, Two Outcomes
Consider a centrifuge whose vibration rises slowly over several weeks. What happens next depends on whether anyone is watching the trend.
Without condition tracking
- Vibration creeps up and nobody trends it
- Cake solids drift lower, and polymer dose is raised to compensate
- The unit trips on high vibration during a busy week
- Solids back up in thickening while a repair is arranged
- Parts are ordered at emergency lead times and labor is paid as overtime
With condition tracking and a CMMS
- A monthly vibration route shows a rising trend against baseline
- A work order is created with an inspection task and a parts check
- The outage is scheduled when storage capacity allows
- Bearings or wear parts come from stock or a planned order
- Findings go on the asset record and adjust the next PM interval
Illustrative scenario for planning purposes, not a customer result.
Spare Parts in Three Tiers
Dewatering spares range from cheap consumables to assemblies that take months to arrive. Stock each by how badly a wait would hurt.
Wash nozzles, doctor blades, filters, fuses and sensors, small seals, polymer pump diaphragms and hoses. Inexpensive, quick to fail, quick to change.
Filter belts, roller bearings, screen segments, gearbox seals and kits. Keep a defined minimum and know each supplier's lead time.
Centrifuge scroll and bowl assemblies, gearboxes, main bearing assemblies. Agree exchange terms and service response with the manufacturer before you need them.
Set minimum quantities from lead time and criticality, not from habit.
Biosolids Records Start in the Maintenance Shop
Where biosolids are land applied, surface disposed, or incinerated, 40 CFR Part 503 sets pollutant limits, pathogen and vector attraction reduction requirements, monitoring, and recordkeeping. Landfills apply their own acceptance criteria, and many require cake to pass a paint filter liquids test.
State programs often add stricter rules, and scrutiny of contaminants such as PFAS in biosolids continues to reshape disposal options. Confirm current requirements with your regulator.
Scorecard: The Dewatering KPIs Worth Tracking
Pick a small set, define each one in writing, and review them monthly with operations.
| Metric | How to calculate it | What it tells you |
|---|---|---|
| Cake solids | Dry solids mass divided by wet cake mass, from a sample | Whether the unit delivers the dryness hauling plans depend on |
| Solids capture | (Feed solids minus filtrate or centrate solids) divided by feed solids | Separation performance and wear on belts, screens, or scroll |
| Polymer per dry ton | Polymer used divided by dry tons processed | Chemical efficiency and early signs of wear or feed changes |
| Wet tons per dry ton | Wet tons hauled divided by dry tons produced | The direct link between dewatering and hauling cost |
| Availability | Hours available to run divided by hours required | Whether maintenance protects solids handling capacity |
| Planned work share | Planned work order hours divided by total maintenance hours | Whether PdM is displacing breakdown repair |
| MTBF by unit | Operating hours divided by number of failures | Whether repeat failures are being eliminated |
Building the Dewatering Asset Tree in Oxmaint
A parent and child hierarchy keeps costs, failures, and readings attached to the component that caused them.
- Dewatering building
- Belt press
- Filter belts and tracking
- Rollers and bearings
- Wash system and nozzles
- Drive and gearbox
- Centrifuge
- Bowl and scroll
- Main bearings
- Gearbox and back drive
- Feed tube and discharge
- Screw press
- Screw and flights
- Screen and wash system
- Drive and gearbox
- Support systems
- Polymer make-down and dosing
- Cake conveyors and hoppers
- Scales and flow meters
- Belt press
What each part of the workflow uses
- Preventive maintenance by calendar or run hours
- Mobile inspection rounds with readings and photos
- Corrective work orders created from abnormal findings, with parts and labor recorded
- Inventory minimums and reorder points for belts, bearings, and screens
- Reports and dashboards for downtime, cost, and PM compliance
Frequently Asked Questions
What is the best PdM method for a centrifuge?
Vibration and bearing temperature trending, plus torque and gearbox oil checks, give the earliest warning. Log them against the unit in a CMMS.
How do I tell wear from a process problem?
Compare feed solids and polymer dose with your last good period first. If they match and performance is still down, inspect the machine.
How often should belts and screens be replaced?
Follow manufacturer guidance, then adjust using recorded run hours and wear measurements from your own units.
Can a CMMS help with biosolids audits?
Yes. Maintenance events, calibrations, and downtime are stored by asset with dates, so they are easy to retrieve.
Can I test this with my own equipment list?
Yes. Book a demo and bring your dewatering asset list.
Keep Solids Moving and Cake Dry
Give your dewatering building planned maintenance, clear records, and fewer surprise stops.