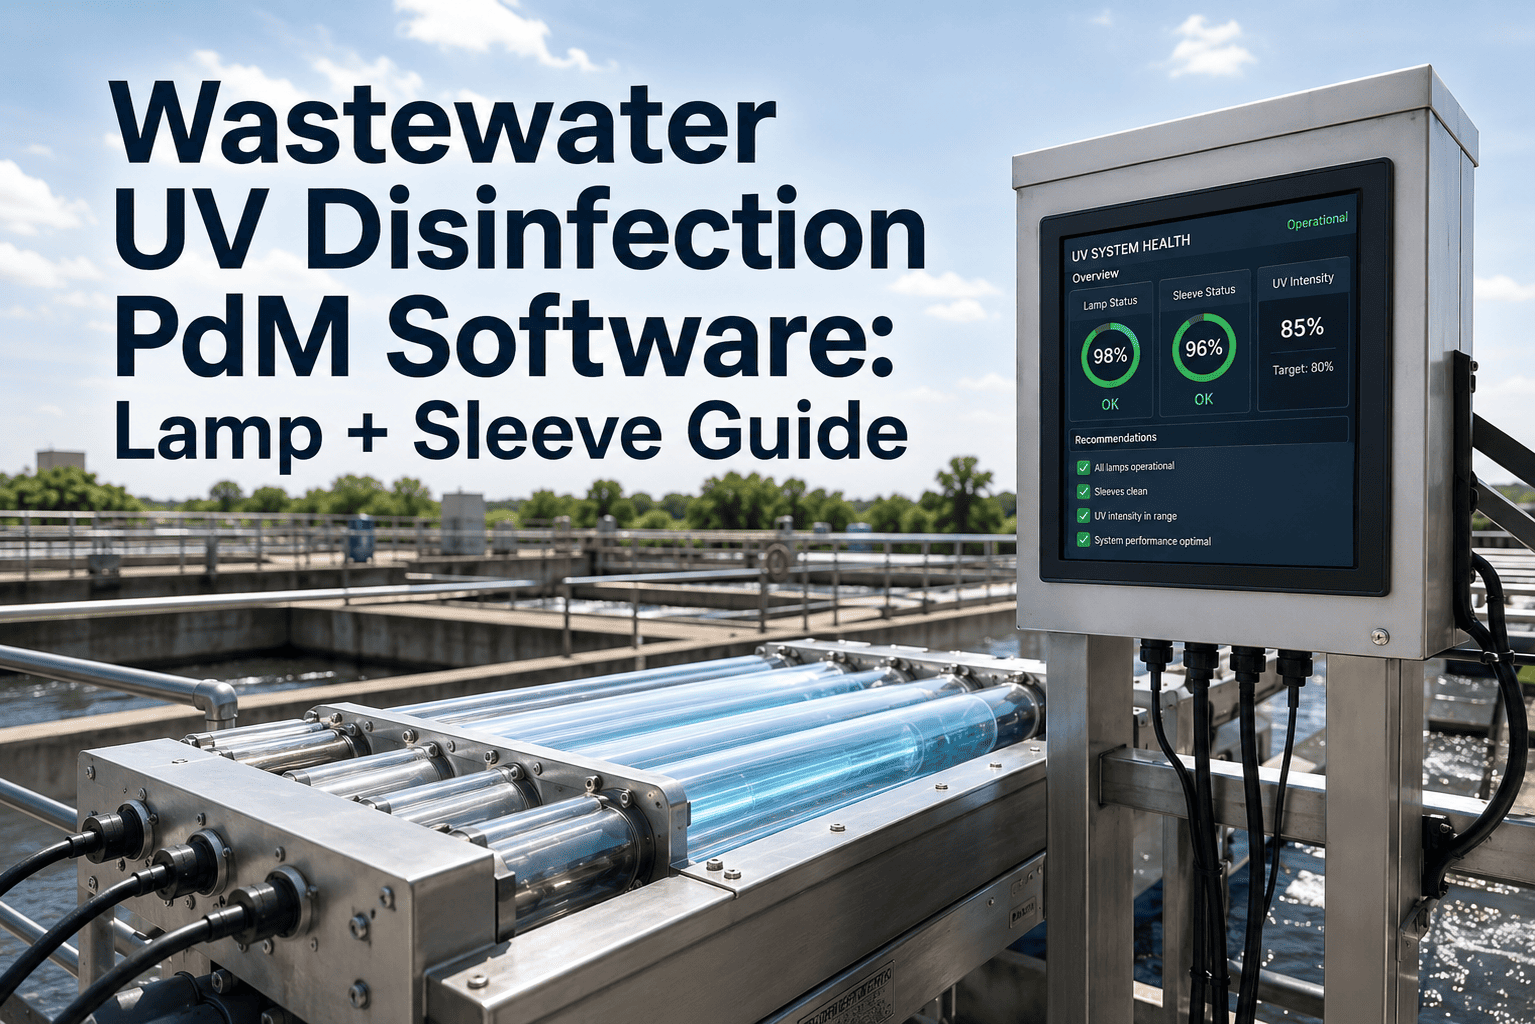
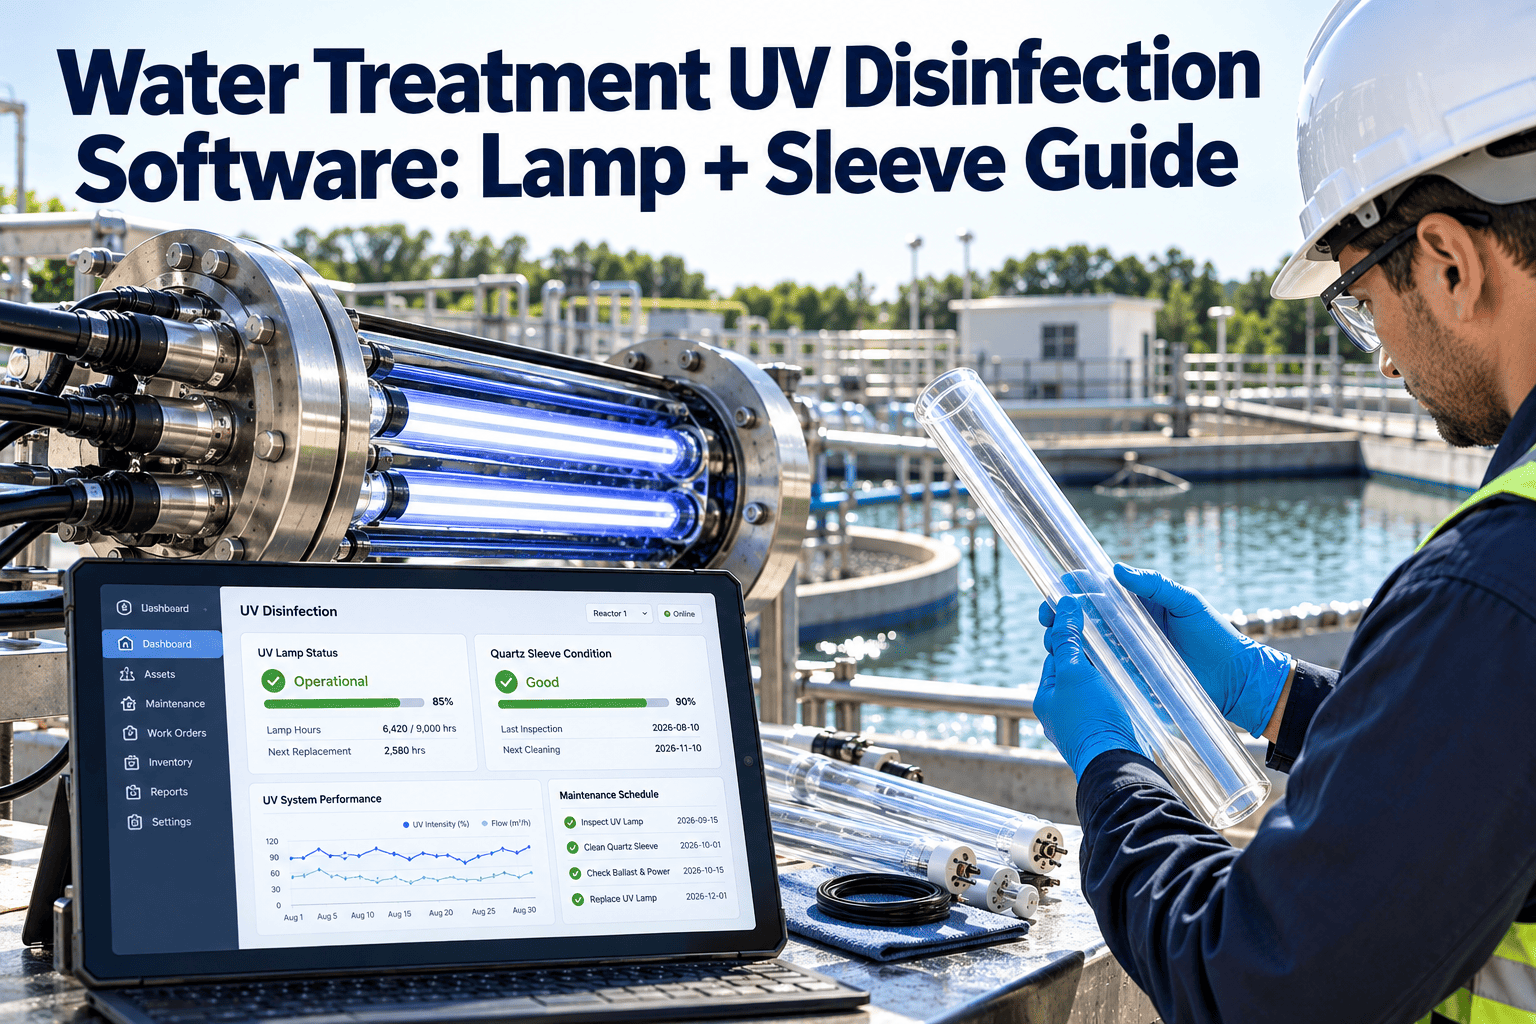
A wastewater treatment plant's UV disinfection system can look perfectly normal on the control panel — lamps lit, flow steady, no active alarm — while the actual dose reaching the effluent has quietly dropped below what your NPDES permit requires. UV lamps lose germicidal output every hour they run, quartz sleeves collect a mineral film that blocks light before it ever reaches the water, and the intensity sensor reading that whole process can itself drift out of calibration without anyone noticing. None of those three failures trip a hard alarm the way a pump trip does. They show up weeks later as a fecal coliform exceedance on a discharge monitoring report, after the disinfection gap has already passed downstream. Predictive maintenance built specifically around lamp hours, sleeve fouling, and sensor drift is how plants close that gap before it becomes a permit violation, and utilities running it can book a demo to see UV PdM tracking live.
12,000-15,000
Operating hours before a typical low-pressure or amalgam UV lamp degrades past guaranteed output
55% to 65%
A modest UVT drop in this range can exponentially reduce the effective dose reaching the effluent
5-8 yrs
Typical service life of a quartz sleeve before scaling, etching, or scratching requires replacement
0.50-0.95
Combined lamp aging and sleeve fouling factor range engineers apply to derate the delivered dose
NPDES Reality Check
Fecal coliform and E. coli limits under your NPDES permit are measured at the point of discharge, not at the UV lamp. A control panel showing green status lights tells you the lamps are powered — it does not tell you the dose delivered was ever enough to hit your log-reduction target. The only way to know is to track lamp hours, sleeve condition, and sensor accuracy together, continuously, and act before the dose curve crosses your compliance threshold.
Three Ways UV Dose Drops Without Tripping an Alarm
UV disinfection failure is rarely a single dramatic event. It is almost always the slow, compounding overlap of three independent degradation curves, each invisible on its own and each worsening the others when left unmonitored.
01
Lamp Aging
Germicidal output falls steadily from the day a lamp is energized. The bulb keeps glowing at close to full visible brightness long after its UVC output — the part that actually inactivates pathogens — has fallen below the design dose, which is why hour-tracking matters more than a visual check.
Sleeve Fouling
02
Calcium, magnesium, iron, and organic matter precipitate onto the quartz sleeve as heat from the lamp interacts with wastewater. The film builds between automatic wiper cycles and blocks light before it reaches the channel, and hard or iron-rich influent can foul a sleeve in months.
Sensor Drift
03
The UV intensity sensor is the only instrument telling the control system what dose is actually being delivered. A dirty sensor lens or an uncalibrated reading can mask a real dose shortfall, or trigger nuisance alarms on a system that is actually performing within spec.
The UV Lamp Lifecycle — And Where PdM Steps In
Every UV lamp follows the same predictable output curve from installation to replacement. Predictive maintenance software tracks where each lamp bank sits on that curve in real time, instead of waiting for a manufacturer's calendar date or a visible failure.
0 hrs
Commissioned
New lamp and sleeve installed at full rated output; baseline intensity reading logged
4,000 hrs
Stable Output
Output tracking within expected decay curve; wiper cycle and sleeve inspection on standard interval
9,000 hrs
Watch Zone
Dose margin narrowing; PdM flags lamp bank for closer trending against UVT and flow conditions
12,000 hrs
Approaching EOLL
End-of-lamp-life factor applied; work order generated to schedule replacement before failure risk rises
15,000 hrs
Replace
Lamp and sleeve swapped on a planned outage window rather than an emergency after a permit exceedance
What to Monitor, and What It Should Trigger
A UV PdM program only works if every monitored signal is tied to a specific, pre-defined maintenance action. The table below is the minimum monitoring set for a rationalized wastewater UV disinfection program.
See Your Lamp Bank's Real Dose Margin
Connect lamp hours, sleeve fouling data, and sensor readings into one dashboard that flags dose risk before it reaches your discharge permit.
NPDES Compliance and UV Disinfection Recordkeeping
Fecal coliform and E. coli permit limits are only part of what a UV disinfection PdM program has to support. The compliance chain runs from lamp maintenance data all the way through to what appears on a discharge monitoring report.
NPDES Permit Limits
Fecal coliform, E. coli, or enterococci limits set the minimum dose the UV system must deliver at every flow condition the plant experiences, including peak wet-weather flow.
Discharge Monitoring Reports
Monthly DMR submissions should be supported by maintenance records showing lamp status, sleeve condition, and sensor calibration for the reporting period.
Bypass and Upset Reporting
Any period of reduced UV dose tied to a known lamp, sleeve, or sensor issue needs a documented cause and corrective action for regulator review.
Capital Planning Data
Lamp bank replacement history and sleeve degradation trends build the evidence base for reactor refurbishment and capital budget requests.
UV PdM Program KPIs Worth Tracking
100%
Lamp Bank Coverage
Share of installed lamp banks with tracked run hours and dose trending
0
Unplanned Lamp Failures
Emergency lamp replacements outside a scheduled maintenance window
< 30 days
Sensor Calibration Cycle
Maximum time between UV intensity sensor verification checks
0
Fecal Coliform Exceedances
Permit violations attributable to reduced UV dose delivery
Frequently Asked Questions
Why does a UV lamp need hour-based tracking instead of a fixed annual replacement?
Lamp decay depends on run hours, cycling frequency, and water quality, not the calendar. Tracking actual hours lets a plant replace a lamp exactly when its dose margin narrows rather than too early or dangerously late.
How often should quartz sleeves be inspected for fouling?
Automatic wiper systems reduce the interval, but sleeve condition should still be checked against intensity trend data regularly, since hard or iron-rich influent can foul a sleeve within months even with wiping in place.
Can a UV PdM platform connect to our existing SCADA and UV control panel?
Yes — lamp hour counters, intensity sensor tags, and wiper cycle data typically already exist in the UV control panel and can be pulled in without modifying the reactor.
Book a demo to review your specific UV vendor and panel type.
What happens if the intensity sensor itself is inaccurate?
A drifted sensor can hide a real dose shortfall or create nuisance alarms on a healthy system. Cross-checking sensor readings against lamp hours and known fouling factors catches drift before it misleads operators either way.
How does this reduce our fecal coliform exceedance risk specifically?
By flagging dose-margin risk from lamp aging, sleeve fouling, and sensor drift before it compounds, maintenance is scheduled ahead of the threshold rather than after a permit violation shows up on a DMR.
Sign up free to configure your reactor's thresholds.
Protect Every Discharge Monitoring Report
Track lamp hours, sleeve fouling, and sensor calibration together in one place, and turn UV dose risk into a scheduled work order instead of a permit exceedance.