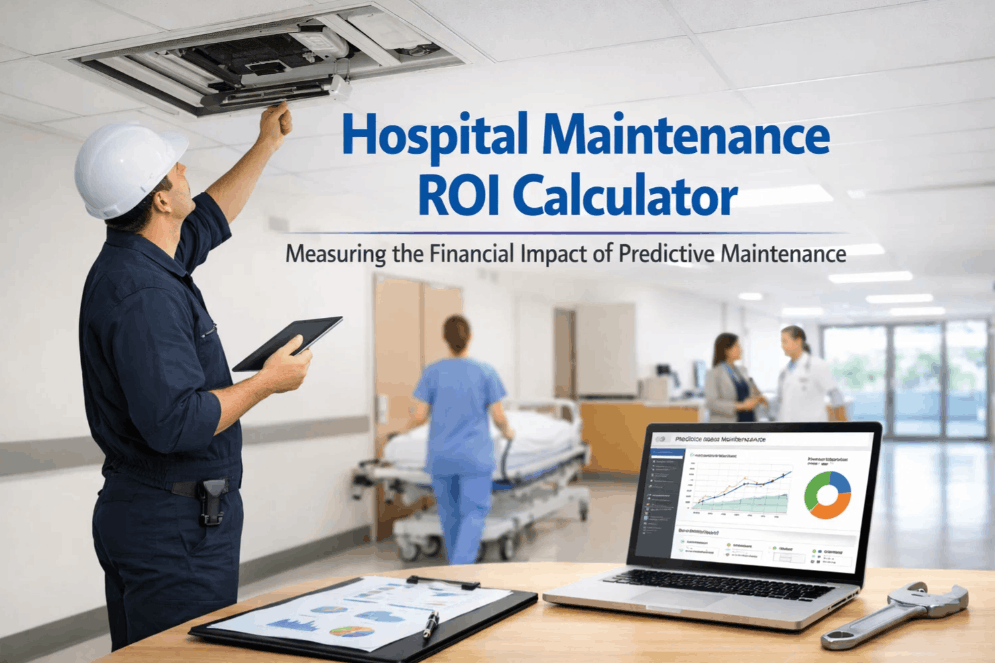
Hospital Maintenance ROI Calculator: Measuring the Financial Impact of Predictive Maintenance
By Josh Turley on March 10, 2026
For hospital executives and CFOs, maintenance has long been viewed as a cost center — a necessary expense to keep facilities running, not a strategic lever for financial performance. That perception is changing fast. As predictive maintenance technologies mature and healthcare margins tighten, forward-thinking health systems are discovering that a disciplined, data-driven maintenance program is one of the most powerful ROI generators available. This guide breaks down exactly how to measure that return, model the financial impact of downtime, and build the business case for upgrading your hospital's maintenance strategy in 2025 and beyond. Sign up for OxMaint to start tracking your maintenance ROI today.
Calculate Your Hospital's Maintenance ROI
OxMaint's predictive maintenance platform gives your team the data to quantify savings, prevent downtime, and generate audit-ready compliance documentation — all in one place.
Why Maintenance ROI Is a Board-Level Conversation in 2025
Hospital operating margins have compressed significantly since the pandemic, with many health systems operating at margins of 1–3%. In this environment, every department is under pressure to demonstrate value. Facilities and maintenance teams that can quantify their financial contribution — through uptime preservation, cost avoidance, and regulatory compliance — earn strategic investment instead of budget cuts.
Predictive maintenance shifts the economics entirely. Instead of waiting for equipment to fail (reactive) or replacing it on a fixed schedule (preventive), predictive maintenance uses real-time sensor data and analytics to intervene at exactly the right moment — before failure, but not a moment sooner than necessary. The result is fewer emergency repairs, longer asset life, and dramatically reduced downtime. The financial impact compounds across every department that depends on functioning equipment. Book a demo to see how predictive maintenance works in practice.
25–30%
Reduction in maintenance costs with predictive programs
$12,000+
Average cost per hour of OR downtime
70–75%
Reduction in equipment breakdowns reported by predictive adopters
The Hospital Downtime Cost Model: What Failure Actually Costs
Most hospitals dramatically underestimate the true cost of equipment failure because they only account for direct repair expenses. A comprehensive downtime cost model must capture five distinct financial dimensions.
Direct Revenue Loss
Cancelled procedures, diverted patients, and delayed discharges all generate immediate revenue shortfalls. A single failed MRI unit can cost $50,000–$100,000 per day in lost imaging revenue alone.
Emergency Repair Premium
Unplanned repairs carry a 3–5x cost premium over scheduled maintenance — including emergency labor rates, expedited parts shipping, and contractor callout fees that can easily reach $20,000–$50,000 per incident.
Regulatory & Compliance Risk
Joint Commission citations, CMS conditions of participation failures, and state health department violations carry direct fines, remediation costs, and the risk of reimbursement suspension that can exceed millions.
Clinical Impact & Liability
Equipment failures in critical care, surgical, or diagnostic settings carry direct patient safety risks. Adverse events linked to equipment failure generate malpractice exposure and settlement costs that dwarf maintenance budgets.
Accelerated Asset Degradation
Reactive maintenance cycles — run-to-failure, emergency repair, repeat — shorten asset lifecycles by 20–40%. Replacing a $2M imaging system 5 years early because of poor maintenance represents a massive hidden cost.
Staff Productivity Loss
Clinical staff idled by equipment failure, maintenance technicians pulled from scheduled work, and administrative overhead from incident management all generate soft costs that rarely appear in traditional maintenance budgets.
ROI Calculator Framework: The Five Variables That Matter
Building a credible ROI model for predictive maintenance requires capturing both the cost of the program and the value it generates. The following framework gives your finance team a defensible structure for calculating net return. Sign up for OxMaint to start capturing real data for your own ROI model.
ROI = (Total Value Generated − Program Cost) ÷ Program Cost × 100
V1
Downtime Avoidance Value
Calculate average revenue per operating hour for your highest-value service lines (OR, imaging, ICU). Multiply by the number of failure hours avoided annually through predictive intervention. For a 300-bed hospital with a 10-room OR, even 40 hours of avoided downtime can represent $480,000+ in preserved revenue.
Downtime Hours Avoided × Revenue per Hour = Downtime Avoidance Value
V2
Emergency Repair Cost Avoidance
Track the number of emergency maintenance events in your baseline year and their average cost. A predictive program typically reduces emergency events by 60–75%. Multiply avoided events by average emergency repair cost (including parts premium, emergency labor, and contractor fees) to quantify savings.
Identify your top 10 highest-value assets by replacement cost. Estimate the lifecycle extension (typically 20–35%) from predictive maintenance. Annualize the deferred capital expenditure to quantify the budget relief generated each year the asset remains serviceable.
(Asset Replacement Cost × Life Extension %) ÷ Extended Asset Life = Annual Capital Deferral
V4
Labor Efficiency Gains
Quantify the shift from reactive to planned maintenance. Planned maintenance tasks take 30–40% less time than equivalent reactive repairs because parts are pre-ordered, procedures are documented, and technicians arrive prepared. Multiply time savings by fully-loaded technician costs.
Hours Saved × Fully-Loaded Hourly Cost = Labor Efficiency Value
V5
Compliance Cost Avoidance
Estimate the cost of a Joint Commission or CMS citation — including remediation, legal review, and consulting fees — at $50,000–$500,000 depending on severity. Assign a probability reduction based on your improved documentation coverage. The expected value of avoided citations is often one of the largest line items in the ROI model.
Citation Probability Reduction × Average Citation Cost = Compliance Value
Benchmarking Your Maintenance Performance: Where Does Your Hospital Stand?
Before you can calculate ROI, you need a clear baseline. These industry benchmarks allow you to assess your current state and identify the highest-value improvement opportunities in your facility.
Metric
Reactive (Below Average)
Preventive (Industry Avg)
Predictive (Best-in-Class)
PM Compliance Rate
<70%
70–85%
>95%
Emergency Work Orders
>40% of total
20–40%
<10%
Mean Time Between Failures
Low / Unknown
Moderate
High / Optimized
Maintenance Cost % of Asset Value
4–6%
2.5–4%
1.5–2.5%
Audit Documentation Coverage
<60%
60–80%
>98%
Average Equipment Uptime
<90%
90–95%
>98%
Sample ROI Calculation: A 350-Bed Regional Hospital
To make the framework concrete, here is a sample ROI model for a mid-size regional hospital transitioning from a paper-based preventive maintenance program to a CMMS-enabled predictive maintenance platform. Sign up for OxMaint to build your own custom model.
Note: These figures are illustrative based on published industry benchmarks. Actual results vary by facility size, equipment mix, and baseline maintenance maturity.
Ready to Build Your Custom ROI Model?
OxMaint's team works with hospital CFOs and facility directors to build facility-specific ROI models using your actual maintenance data, asset registry, and downtime history.
High-Value Asset Categories: Where Predictive Maintenance Pays Most
Not all hospital equipment delivers the same ROI from predictive monitoring. Prioritize your program rollout around asset categories where failure has the greatest financial and clinical impact.
Critical Priority
HVAC & Air Handling Systems
Failure directly impacts OR, ICU, and isolation room pressurization — triggering mandatory shutdowns, procedure cancellations, and potential Joint Commission citations. Monitoring motor performance, filter loading, and airflow deviations can prevent catastrophic failures worth $500K+ in avoided downtime.
Critical Priority
Medical Imaging Equipment (MRI, CT, PET)
With replacement values of $1M–$3M and daily revenue of $30K–$80K per unit, imaging equipment has the highest combined downtime and capital risk of any hospital asset class. Predictive monitoring of cooling systems, RF shielding, and power supply health pays back rapidly.
High Priority
Surgical Sterilization & Autoclave Systems
Sterilizer failures halt OR schedules and trigger mandatory case postponements. Monitoring cycle integrity, chamber seal health, and steam generator performance prevents the $50K–$200K daily revenue impact of unplanned sterilization outages.
High Priority
Emergency Power & Generator Systems
CMS Conditions of Participation require documented testing and maintenance of emergency power systems. Failures during a power event create life-safety emergencies and immediate regulatory action. Predictive monitoring of fuel systems, transfer switches, and load bank performance is non-negotiable.
Moderate Priority
Elevator & Vertical Transport
In multi-story facilities, elevator failures disrupt patient transport, restrict emergency response, and trigger state elevator board violations. Monitoring drive motor performance and door mechanism health reduces costly emergency service calls by 50–60%.
Moderate Priority
Boiler & Central Plant Systems
Central plant failures affect heating, domestic hot water, and sterile processing across the entire facility. Predictive monitoring of heat exchanger efficiency, pump vibration, and water treatment chemistry extends asset life and reduces fuel waste — a dual financial benefit.
Building the Business Case: How to Present Maintenance ROI to Your CFO
Securing investment in predictive maintenance requires translating technical maintenance metrics into the financial language that CFOs and boards respond to. Here is a proven structure for making the case.
01
Quantify the Current State Cost
Pull your emergency work order rate, average response cost, and any documented downtime events from the past 24 months. This establishes your baseline cost of reactive maintenance — the number that makes the investment decision obvious.
02
Link Maintenance to Revenue Cycle
Map your highest-revenue service lines to the equipment and systems that support them. Show the CFO the direct dependency between OR uptime and surgical revenue, between imaging equipment availability and diagnostic revenue, between HVAC reliability and infection control compliance.
03
Model Three Scenarios
Present conservative, base, and optimistic ROI projections using the five-variable framework above. Boards respond to scenario modeling because it acknowledges uncertainty while demonstrating upside discipline. Even the conservative case should show a compelling payback period of 6–18 months.
04
Include Regulatory Risk Quantification
Express compliance risk in financial terms. A Joint Commission survey finding related to life safety equipment can trigger a 60-day Accreditation with Follow-Up Survey, consuming $150,000–$300,000 in consulting and remediation costs before the financial impact of any reimbursement risk is factored in.
05
Present a Phased Implementation Plan
CFOs respond better to staged investment with early proof points than to large upfront capital requests. Start with the highest-value asset categories, demonstrate results within 90 days, and expand the program from a position of demonstrated success rather than projected benefit.
What to Look for in a Hospital CMMS: Features That Drive Financial Outcomes
Not all maintenance management software delivers the same financial results. When evaluating a CMMS for your hospital, prioritize these capabilities that directly link to ROI generation. Book a demo to see how OxMaint delivers each of these features out of the box.
Real-Time Dashboards
Maintenance KPIs visible to leadership in real time — PM compliance rate, open work orders, equipment uptime, and overdue calibrations — enable proactive intervention before issues become expensive.
Automated Escalation
Work orders that auto-escalate to supervisors when approaching deadline prevent the compliance gaps that generate both regulatory citations and costly emergency repairs.
Mobile-First Interface
Technicians who can complete, document, and close work orders from a mobile device on the floor — without returning to a desktop — complete tasks 25–35% faster and with higher documentation compliance.
Audit-Ready Reporting
One-click compliance reports that satisfy Joint Commission, CMS, and state health department requirements eliminate the 40–80 hours of manual preparation that most facilities invest before each survey.
IoT Integration
Direct integration with building management systems and equipment sensors enables condition-based maintenance triggers — replacing calendar-based schedules with data-driven interventions that optimize both cost and reliability.
Cost Tracking Per Asset
Lifetime maintenance cost tracking per asset identifies when continued repair cost exceeds replacement value — enabling data-driven capital planning rather than reactive budget requests when equipment finally fails.
Turn Your Maintenance Program into a Financial Asset
OxMaint gives hospital facility teams the tools to document every maintenance activity, automate compliance workflows, and generate the financial reporting your CFO needs to see the real ROI of a disciplined maintenance program.
Everything you need to know about hospital maintenance ROI and predictive maintenance programs.
Most hospitals achieve full payback on their CMMS and predictive maintenance investment within 6–18 months, depending on baseline maintenance maturity and the asset mix being monitored. Facilities with high emergency work order rates and documented downtime events typically see payback within the first year. The ongoing annual ROI typically ranges from 300–1,400% once the program is fully implemented.
Start by identifying the revenue per operating hour for each affected service line. For ORs, calculate average surgical revenue divided by operating hours. For imaging, divide annual imaging revenue by scanner operating hours. Multiply hourly revenue by the hours of downtime experienced or projected. Add emergency repair costs, staff idling costs, and any regulatory response costs to get total downtime cost.
The most financially relevant maintenance metrics for CFO reporting include: PM compliance rate (target >95%), emergency work order rate (target <10%), mean time to repair for critical equipment, maintenance cost as a percentage of asset replacement value, equipment uptime by service line, and overdue calibration rate. A modern CMMS should produce these metrics automatically in dashboard and report formats.
Joint Commission surveys evaluate both physical equipment condition and documentation of maintenance activities. Predictive maintenance programs reduce survey risk in two ways: first, by keeping equipment in better condition through data-driven intervention; second, by producing complete digital audit trails that demonstrate a systematic, documented maintenance program. Surveyors can immediately access complete maintenance histories, calibration records, and corrective action documentation.
Preventive maintenance follows a fixed schedule — replacing filters, lubricating equipment, and performing inspections based on calendar intervals regardless of actual equipment condition. Predictive maintenance uses real-time sensor data, historical failure patterns, and condition monitoring to intervene only when equipment condition indicates an approaching failure. Predictive maintenance typically reduces maintenance costs by 25–30% compared to preventive programs.
Yes — and often more easily than large health systems. Community hospitals typically have leaner maintenance teams, less redundant equipment, and tighter margins, meaning a single critical equipment failure has proportionally greater financial impact. A community hospital with 150 beds losing its only CT scanner for 3 days faces a disproportionate revenue and clinical impact that a predictive maintenance program costing $40,000–$80,000 per year can easily justify preventing once per year.

.png)
.jpg)