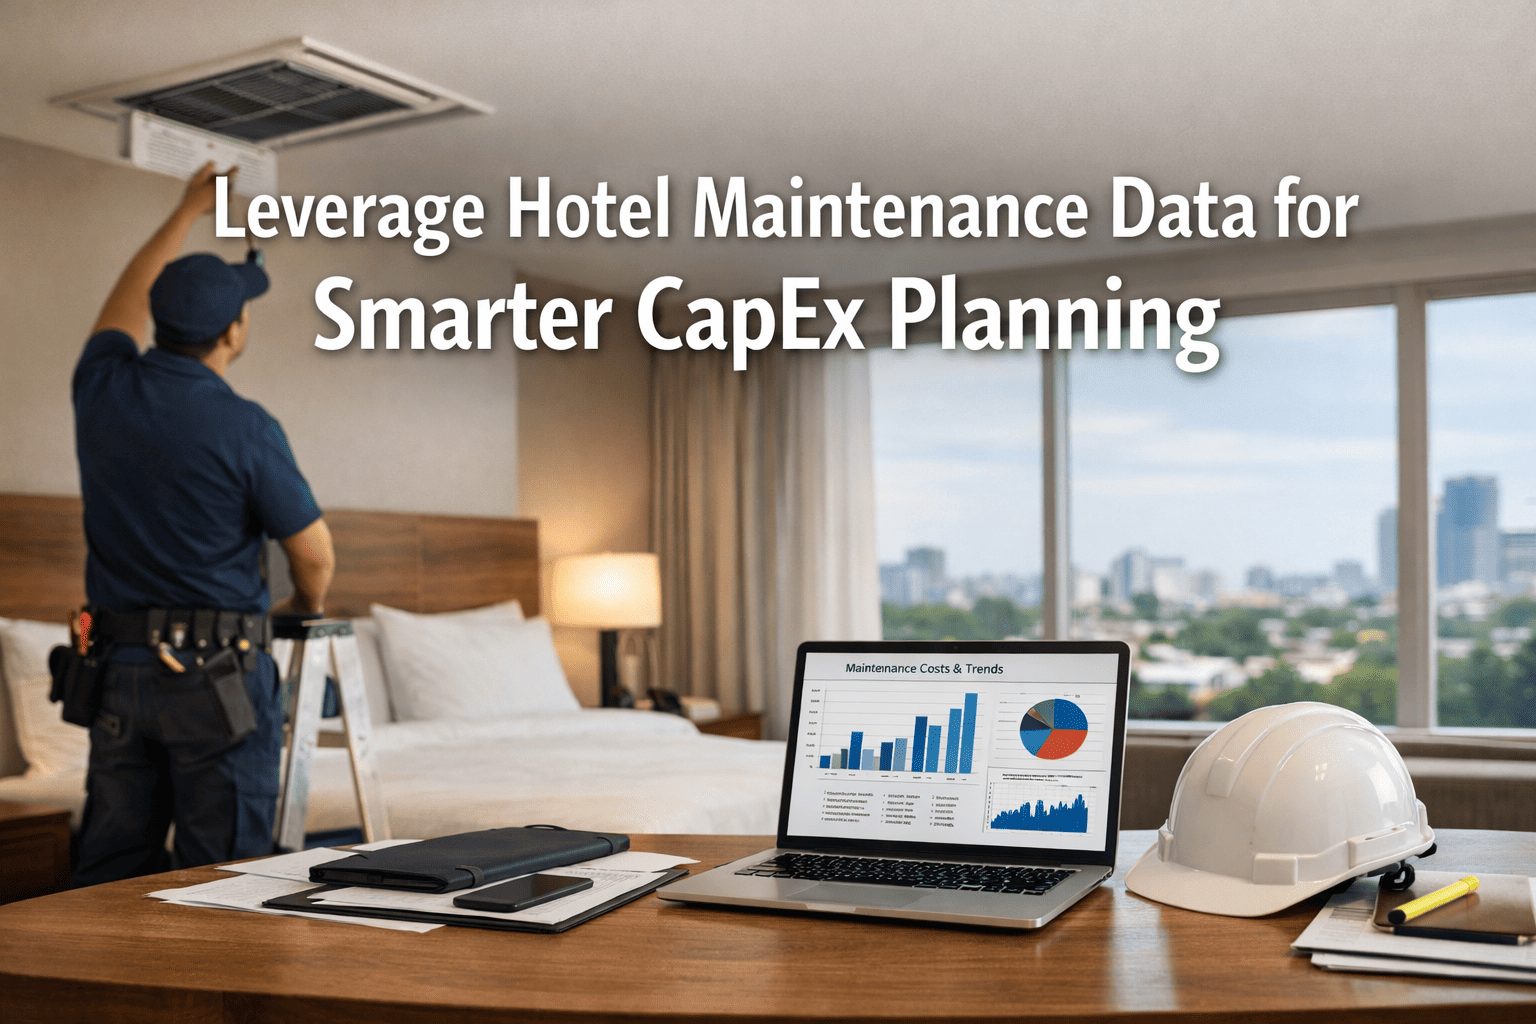
Hotel capital expenditure decisions made without maintenance data are, at best, educated guesses — and at worst, multi-million-dollar misallocations that accelerate asset failure, inflate operating costs, and defer the replacements that actually matter. General managers, asset managers, and ownership groups at forward-looking hotel properties are now treating their CMMS as the primary data source for CapEx planning — using repair cost accumulation, failure frequency trending, and asset health scoring to build capital budgets that are grounded in operational reality rather than OEM depreciation tables and gut instinct.
Turn Your Maintenance Records Into a CapEx Roadmap
OxMaint gives hotel asset managers repair cost tracking, failure trend analysis, and asset health scoring — the data infrastructure that makes capital investment decisions defensible and precise.
Why Hotel CapEx Planning Fails Without Maintenance Data
The traditional hotel capital planning process follows a familiar — and deeply flawed — pattern. Asset managers compile replacement schedules from OEM service life estimates, walking inspections that happen once or twice a year, and the accumulated opinions of department heads who advocate loudest for their own budget priorities. The result is a capital budget that systematically under-invests in failing assets that haven't visibly deteriorated yet, over-invests in assets with years of reliable service life remaining, and surprises ownership with emergency replacement costs that a functioning asset data system would have predicted 18–24 months in advance.
The Four CMMS Data Streams That Drive Smarter Hotel CapEx Decisions
Repair Cost Accumulation by Asset
Every work order closed in the CMMS carries a labor cost and a parts cost. Over months and years, this data builds a total cost-of-ownership record for every asset in the portfolio — enabling the repair-vs-replace threshold analysis that transforms CapEx conversations from opinion-based to evidence-based. When cumulative repair costs on an aging chiller approach 60–70% of replacement cost, the data makes the replacement case automatically.
- Running repair cost total updated with every closed work order
- Parts and labor tracked separately by asset and failure mode
- Repair-to-replacement cost ratio calculated automatically
- Multi-year cost trend exposed for budget forecasting
Failure Frequency Trending
An asset that fails once per year is a maintenance event. An asset whose failure frequency has doubled in 18 months is a capital replacement signal. CMMS failure frequency trending tracks the rate of change in breakdown patterns — surfacing assets whose reliability is degrading on a trajectory that leads to imminent replacement, even when individual failures are still being resolved quickly and cheaply.
- Failure count by asset tracked monthly and annually
- Frequency acceleration flagged when rate-of-change exceeds threshold
- MTBF decline charted against asset age for lifecycle modeling
- Trend data exportable for CapEx narrative and board presentations
Asset Health Scoring Across the Portfolio
Individual asset metrics tell part of the story. A portfolio-wide asset health score — aggregating condition ratings from inspection records, repair frequency, PM compliance history, and technician-assigned condition flags — gives asset managers and ownership groups a single-screen view of capital risk exposure across the entire property. Assets in the red zone across all dimensions rise to the top of the replacement prioritization queue with clear, data-backed justification. Structured PM programs for high-risk asset categories like automated pool and spa maintenance scheduling generate the inspection records that feed health scoring with reliable, consistent data.
- Composite health score by asset category and individual unit
- Red/amber/green classification for portfolio-level capital risk view
- Score trends over time for trajectory analysis
- Weighted scoring by asset criticality and guest impact
Deferred Maintenance Liability Quantification
Every PM task overdue, every corrective work order open beyond its target completion date, and every condition flag without a remediation work order attached represents a deferred maintenance liability — a future capital cost being incubated in the asset base. CMMS platforms that track deferred maintenance with cost estimates attached enable asset managers to present ownership with a real-time deferred liability figure: the capital exposure that exists if current maintenance gaps are not addressed. This single metric is among the most powerful tools available for securing maintenance investment approvals from ownership groups focused on capital preservation.
- Open PM overdue tasks valued at estimated remediation cost
- Deferred liability total updated in real time as work orders age
- Liability classified by asset category for prioritized remediation
- Historical deferred liability trend for board-level reporting
Hotel CapEx Planning Performance Benchmarks: Data-Driven vs. Traditional Methods
The performance difference between hotel properties using CMMS maintenance data for CapEx planning and those relying on traditional walkthrough-and-depreciation-table methods is measurable across every dimension of capital efficiency. The data below reflects outcomes from hotel and resort properties that have integrated CMMS asset data into their annual and multi-year capital planning processes.
| CapEx Planning Metric | Traditional Planning Baseline | CMMS-Data-Driven Performance | Improvement Range |
|---|---|---|---|
| Emergency CapEx Events per Year | 4–8 unplanned replacements | 1–2 unplanned replacements | 65–80% reduction |
| Emergency vs. Planned Replacement Cost Premium | 35–60% cost premium on emergency replacements | Premiums virtually eliminated | Full premium recovery |
| CapEx Budget Forecast Accuracy | ±25–40% variance from annual budget | ±8–15% variance from annual budget | 55–70% improvement |
| Asset Replacement Lead Time | 2–6 weeks (reactive identification) | 12–24 months (data-driven identification) | 10–18× improvement |
| Deferred Maintenance Liability Visibility | Unknown / estimated manually | Real-time quantified figure | Full visibility achieved |
| Total Maintenance + CapEx Cost per Asset | Baseline | 18–28% below baseline | 18–28% reduction |
| Time to Prepare Annual CapEx Justification | 4–8 weeks of manual data assembly | 2–5 days of report generation | 80–90% time reduction |
The total cost reduction figures above — 18–28% below baseline for combined maintenance and CapEx cost — reflect the compounding effect of planned replacements over emergency replacements, optimized PM programs that extend asset service life, and deferred liability management that prevents small maintenance gaps from becoming large capital failures. Book a demo to see how OxMaint builds this data asset from the first day of deployment.
Hotel Asset Categories: CMMS Data Signals and CapEx Replacement Triggers
HVAC & Chiller Plant
The highest single capital item in most hotel portfolios. CMMS replacement triggers include: cumulative repair cost exceeding 50% of replacement value, kW-per-ton efficiency decline of 15%+ from commissioning baseline (tracked via BAS integration), compressor failure frequency accelerating beyond two events per year, and refrigerant consumption increasing sharply due to leak frequency. These signals routinely provide 18–24 months of replacement planning runway.
- Efficiency ratio trending from BAS integration data
- Cumulative repair cost tracked to replacement threshold
- Compressor failure frequency acceleration flagged
Elevators & Vertical Transport
Elevator capital decisions involve both replacement and major refurbishment cycles — drive system upgrades, cab refurbishment, and control system modernization. CMMS replacement triggers include: callback rate exceeding regulatory thresholds, door mechanism failure frequency increasing quarter-over-quarter, and parts obsolescence flags on aging control systems where replacement components are no longer stocked by manufacturers.
- Callback rate tracking with regulatory threshold alerts
- Parts obsolescence flagging for end-of-life control systems
- Refurbishment vs. replacement cost modeling by asset age
Kitchen Equipment
Commercial kitchen equipment replacement in high-volume hotel F&B operations follows failure pattern trajectories that CMMS data makes predictable. Combi ovens, refrigeration systems, and dishwashers in sustained commercial use show statistically reliable failure frequency acceleration curves that, when tracked, provide 9–15 months of replacement planning lead time. Compliance-linked maintenance records for kitchen equipment safety and compliance maintenance also support health department inspection readiness as equipment ages.
- Failure frequency curves by equipment type and age cohort
- Repair parts availability flagging for discontinued models
- Compliance record continuity through end-of-life transition
Pool, Spa & Water Features
Pool and spa infrastructure combines equipment replacement cycles (pumps, heaters, filters) with structural refurbishment cycles (surface resurfacing, plumbing, decking). CMMS data tracks equipment replacement triggers independently from structural condition, enabling multi-year capital planning that sequences equipment and structural investments without forcing simultaneous closures that maximize revenue impact and construction disruption.
- Pump and heater replacement cycles tracked by run-hours
- Chemical consumption trends indicating filter and surface degradation
- Structural refurbishment sequencing from inspection records
Guest Room FF&E and Systems
In-room HVAC units, plumbing fixtures, electrical systems, and FF&E all follow replacement cycles that are heavily influenced by occupancy intensity — a room doing 85% annual occupancy degrades significantly faster than OEM depreciation tables (written for average use cases) project. CMMS work order frequency by room number and floor exposes clusters of deteriorating rooms before brand standard violations or guest complaint escalations force reactive replacement campaigns.
- Work order density mapped by room number and floor
- In-room HVAC unit replacement signals by failure frequency
- Plumbing and electrical repair clustering for block replacement planning
Backup Power & Critical Infrastructure
Generators, UPS systems, fire suppression, and emergency lighting represent life-safety capital — assets where failure has regulatory, liability, and insurance implications beyond operational disruption. CMMS tracks load bank test results against rated capacity over time, battery replacement cycles on UPS systems, and fire suppression inspection outcomes — providing the documented performance history that supports capital replacement arguments to ownership groups focused on liability risk management.
- Generator load test capacity trending over annual test cycles
- UPS battery replacement cycle tracking with capacity data
- Fire suppression inspection outcome history for compliance capital
How to Build a CMMS-Driven Hotel CapEx Planning Process
Establish Complete Asset Registry with Acquisition and Cost Data
The CMMS asset registry is the foundation of data-driven CapEx planning — and its value is only as good as its completeness. Every capital asset must be entered with acquisition date, original cost, current replacement cost estimate, OEM expected service life, and warranty status. Properties migrating from fragmented spreadsheet records or paper-based systems typically discover 15–30% of assets are not formally registered anywhere, existing only in the memory of long-tenured staff. The asset registry exercise itself — even before any maintenance data accumulates — produces the first meaningful output: a complete picture of the portfolio's age distribution and theoretical replacement liability over a 5–10 year horizon. This baseline, combined with actual maintenance data as it accumulates, becomes the foundation of the rolling CapEx forecast.
Capture Repair Costs Against Every Work Order From Day One
The repair cost accumulation data that drives CapEx analysis is only generated if the CMMS work order process captures parts cost and labor time on every closed work order — not just the major breakdowns that already attract management attention. Properties that capture costs on all work orders, including routine PM completions and minor corrective repairs, build the richest and most reliable total-cost-of-ownership records. Establish a cost capture protocol in the first week of CMMS deployment: every technician must log time against every work order, and every parts charge must be posted to the asset record rather than to a generic maintenance cost center. This discipline is the single most important data quality decision in the entire CMMS-to-CapEx pipeline.
Run Quarterly Asset Health Reviews Against Replacement Thresholds
Once sufficient repair cost and failure frequency data has accumulated — typically 6–12 months of complete capture — establish a quarterly asset health review process. For each asset category, define the specific data thresholds that trigger a replacement recommendation: cumulative repair cost as a percentage of replacement value, failure frequency per quarter vs. prior year same quarter, efficiency metric decline from baseline, and technician-assigned condition score. Run these metrics against every asset in the portfolio quarterly and surface all assets in or approaching red-zone status. The quarterly cadence is critical — annual reviews miss the failure frequency acceleration signals that provide the longest planning runway. The mobile-enabled inspection records generated through QR code work order systems make technician-assigned condition data consistent and time-stamped in a way that manual inspection rounds cannot match.
Build a Rolling 5-Year CapEx Forecast from Asset Health Data
Translate quarterly asset health review outputs into a rolling 5-year CapEx forecast that is updated each quarter as new data arrives. Assets in the red zone with failure data supporting 12–18 month replacement timelines populate years 1–2 of the forecast. Assets in amber zones with accelerating repair cost or failure frequency trends populate years 2–4, with replacement timing estimates refined quarterly as more data accumulates. Assets in the green zone with stable performance against historical baselines populate the theoretical end-of-life window from OEM service life data, adjusted upward or downward based on actual MTBF performance vs. OEM expectations. This rolling forecast replaces the static annual CapEx request with a continuously updated, data-grounded capital roadmap that ownership groups can rely on for multi-year financial planning rather than treating each year's request as an uncertain new input.
Present CapEx Requests with CMMS Data as the Justification Backbone
When CapEx requests are presented to ownership groups, asset managers, or brand capital review committees, CMMS data transforms the conversation from a negotiation to a briefing. A replacement request supported by a cumulative repair cost chart, a failure frequency trend graph, a deferred maintenance liability figure, and a comparison of planned vs. emergency replacement cost builds a case that is difficult to defer without accepting documented, quantified risk. Structure CapEx presentations around the data outputs the CMMS generates natively: total repair cost vs. replacement cost by asset, failure event timeline, condition score trend, and projected maintenance cost trajectory if replacement is deferred. Properties that bring this data to capital reviews consistently report faster ownership approval and more predictable multi-year funding commitments than those presenting qualitative assessments alone.
Refine Replacement Thresholds from Post-Replacement Outcome Data
Every completed capital replacement generates a validation data point for the thresholds that triggered it. When replacement of a chiller at 55% of replacement cost in cumulative repairs eliminates breakdown frequency and restores efficiency to near-new baseline, that outcome validates the trigger threshold. When a replacement triggered at 70% of replacement cost reveals that the asset had continued to fail at a rate that would have justified replacement 18 months earlier, the threshold is tightened. This learning loop — comparing the asset health data at the point of replacement decision against the post-replacement performance improvement — is what matures a CMMS-driven CapEx planning process from a data collection exercise into a genuine predictive asset management capability. Schedule a semi-annual threshold review that incorporates post-replacement outcomes from the prior 12 months and adjusts replacement criteria based on what the data shows.
Integrating CMMS CapEx Data with Hotel Finance and Ownership Reporting
The operational value of CMMS maintenance data for CapEx planning is maximized when it flows directly into the financial reporting structures that ownership groups and asset managers use to make capital allocation decisions. Properties that keep CMMS data siloed within the maintenance department — accessible to the chief engineer but not integrated into the GM's budget presentations or the asset manager's annual review — capture only a fraction of the available value. The data integration points below represent the highest-leverage connections between CMMS asset data and hotel financial decision-making.
CMMS Data in Monthly Owner Reports
Monthly owner reports that include a one-page asset health summary — red/amber/green status by category, top deferred maintenance liability items, and any assets that have crossed replacement thresholds since last report — build ownership awareness of capital risk between annual budget cycles. Properties that make this a standard monthly reporting element consistently report faster capital approval timelines because ownership groups have been tracking the data trajectory rather than receiving a surprise replacement request.
- Asset health summary as standard monthly reporting section
- Deferred liability figure updated monthly
- Replacement threshold crossings flagged immediately
CapEx Forecast Linked to PIP and Brand Standards
Hotel brand PIPs (Property Improvement Plans) generate mandatory capital requirements on renewal cycles — but CMMS asset data can identify which PIP-required replacements are being forced by brand standards on assets that maintenance data already flagged for replacement, and which replacements are being mandated on assets with remaining service life that represents genuine capital addition beyond operational necessity. This distinction is valuable in PIP negotiations and in allocating PIP capital vs. maintenance CapEx across reporting categories.
- PIP requirements cross-referenced against CMMS replacement flags
- Capital category allocation between operational and brand-compliance spend
Asset Acquisition Due Diligence Support
For hotel transactions — acquisitions, dispositions, and refinancings — CMMS asset health data provides the most defensible basis for deferred maintenance liability estimation available to either buyer or seller. Properties with mature CMMS programs can produce an asset-by-asset replacement liability schedule backed by actual repair cost history and failure frequency data — a document that carries substantially more credibility in transaction due diligence than visual inspection reports or generic depreciation-table estimates.
- Asset-by-asset replacement liability schedule with supporting data
- Repair cost history by asset for buyer due diligence packages
Choosing a CMMS That Generates CapEx-Ready Asset Data
Not every CMMS generates the asset data quality required for CapEx planning. Platforms built primarily for work order dispatch — where the primary output is technician task completion rather than asset performance records — produce maintenance logs that document activity but do not accumulate the structured cost, failure, and condition data that drives capital decision-making. When evaluating CMMS platforms specifically for hotel CapEx planning support, five capability dimensions separate systems that generate genuine capital intelligence from those that simply track maintenance tasks. Book a demo to see how OxMaint is built from the ground up to generate capital-planning-ready asset data.
Granular Cost Capture at the Asset Level
The platform must capture and accumulate labor and parts costs at the individual asset level — not at the department or cost center level. Without asset-level cost attribution, repair-vs-replace analysis is impossible. Every work order must generate a cost record attached to a specific asset ID.
Asset Lifecycle Reporting and Trending
The platform must generate asset lifecycle reports that show cumulative repair cost, failure frequency, and condition score trends over the full history of an asset in the system — not just current-period snapshots. Without historical trending, threshold analysis and replacement timing are guesswork rather than data-driven conclusions.
Configurable Replacement Threshold Alerts
Asset managers need the system to automatically flag assets when they cross user-defined replacement thresholds — whether that's a repair cost ratio, failure frequency rate, or condition score floor. Manual monitoring of hundreds of assets across a full hotel portfolio is operationally impossible without automated alerting.
Exportable CapEx Reporting Formats
CMMS data only drives CapEx decisions if it can be exported in formats that integrate with the financial reporting and presentation tools that ownership groups and asset managers actually use. Native export to Excel, PDF, and dashboard formats — with asset cost and condition data structured for direct use in CapEx presentations — is a prerequisite for the data-to-decision pipeline to function in practice.
Multi-Property Portfolio View
Hotel management companies and ownership groups with multiple properties need CapEx data consolidated across the portfolio — enabling capital allocation decisions that account for relative asset health across properties, not just individual property budget requests viewed in isolation. Portfolio-level asset health dashboards are essential for capital allocation efficiency at scale.
Build the Hotel Asset Data Foundation That Makes CapEx Planning Predictable
OxMaint captures repair costs, failure frequency, and asset health scores from day one — giving hotel asset managers and ownership groups the CMMS intelligence that turns capital planning from guesswork into a data-backed discipline. Book a 30-minute demo to see your portfolio's capital risk profile.
Frequently Asked Questions: CMMS Data and Hotel CapEx Planning
How long does it take to accumulate enough CMMS data to support CapEx planning?
The baseline asset registry and theoretical replacement liability schedule can be generated within the first 30 days of CMMS deployment, using acquisition dates, costs, and OEM service life estimates. Meaningful repair cost accumulation data for initial repair-vs-replace threshold analysis typically develops within 6–12 months of complete cost capture. Full failure frequency trending data, reliable enough to provide 12–18 month replacement planning runway, typically matures at 12–18 months post-deployment. Properties migrating from an existing CMMS with historical data can compress these timelines significantly if data quality from the prior system is sufficient to import into asset cost history records.
What repair-to-replacement cost ratio should trigger a replacement recommendation?
The repair-to-replacement cost threshold varies by asset class and criticality. For HVAC and chiller equipment, cumulative repair costs reaching 50–60% of current replacement value is a widely used trigger, particularly when combined with efficiency decline data. For kitchen equipment with shorter service lives, 40–50% is commonly used. For life-safety equipment like generators and fire suppression, the threshold is lower — typically 35–45% — because the compliance and liability risk of operating aging equipment outweighs the marginal cost savings of further repairs. Properties should calibrate these thresholds to their specific portfolio and refine them based on post-replacement outcome data over time.
How does CMMS data compare to third-party property condition assessments for CapEx planning?
Third-party property condition assessments (PCAs) provide a point-in-time snapshot of asset condition from an external perspective — valuable for transaction due diligence and periodic portfolio benchmarking, but fundamentally limited by their infrequency (typically every 2–5 years) and their reliance on visual inspection rather than performance data.
Can CMMS CapEx data be used to support hotel financing and refinancing applications?
Yes — and it is increasingly expected by sophisticated lenders and CMBS underwriters as part of hotel financing packages. A CMMS-generated asset health report with documented repair cost histories, replacement schedules with cost estimates, and deferred maintenance liability quantification provides lenders with a more reliable picture of the property's true capital requirements than visual inspection reports or generic reserve studies.
How should hotel CapEx data from CMMS be presented to ownership groups unfamiliar with maintenance metrics?
Ownership groups focused on financial returns respond most directly to three data presentations: total repair cost vs. replacement cost with a clear ratio and trend line, the cost comparison between planned and emergency replacement (showing the specific premium the property avoids by acting on data-driven signals), and the deferred maintenance liability figure expressed in dollar terms with a risk-weighted timeline.
How does CMMS-driven CapEx planning interact with FF&E reserve fund management?
FF&E reserve funds established in hotel management agreements are typically calculated as a percentage of gross revenue rather than from asset-specific data — a methodology that can dramatically over- or under-fund reserves depending on the property's actual asset age profile and maintenance history. .