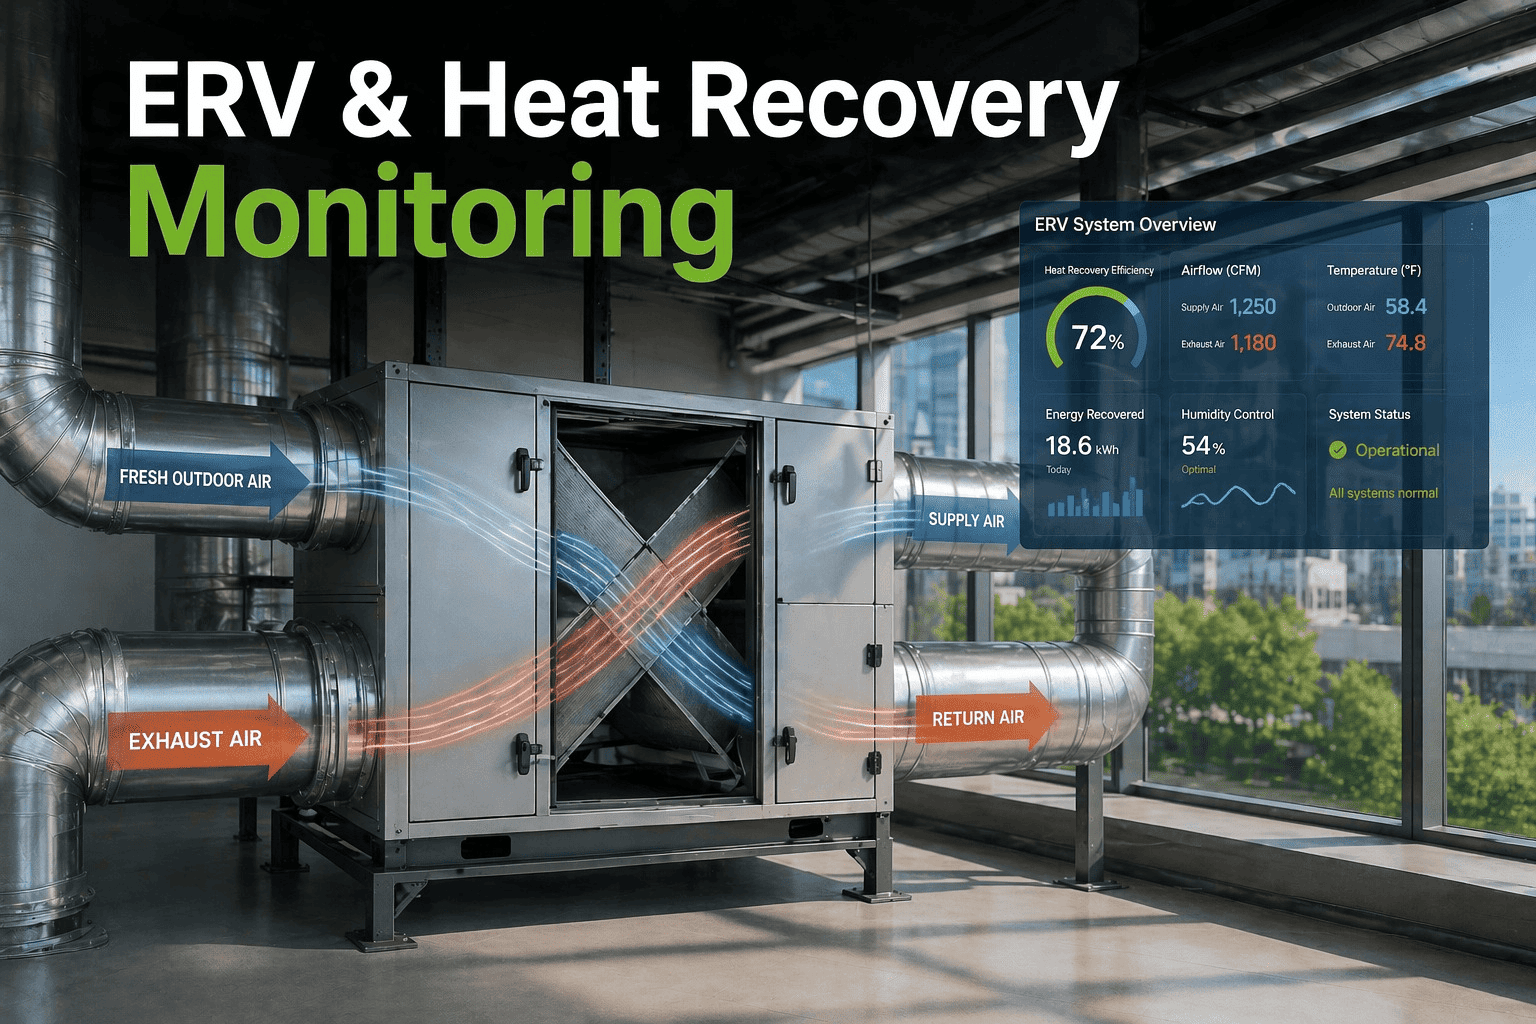
According to the global Energy Recovery Ventilator (ERV) market is projected to reach $14.2 billion by 2032, growing at a CAGR of 11.8% as commercial buildings prioritize ventilation efficiency and energy recovery. However, industry data indicates that 71% of installed ERV and heat recovery systems operate below design efficiency due to undetected motor degradation, wheel imbalance, and filter loading — costing commercial building owners an average of $0.18 to $0.42 per square foot annually in excess energy consumption. Unlike standard HVAC equipment with established monitoring protocols, ERV units typically operate without performance tracking until a stall alarm or indoor air quality complaint reveals the failure. OxMaint's Energy Recovery Module provides continuous monitoring of heat wheel speed, exhaust temperature differential, supply air temperature, airflow pressure, and motor current — generating predictive work orders when efficiency drops below 85% of design baseline. Book a demo to see how facility managers are recovering 8–18% of HVAC energy spend within 120 days of deployment.
01
Energy Recovery Ventilator (ERV) and Heat Recovery System Monitoring
Heat wheel efficiency · Airflow balance · Motor current · Temperature differential tracking · CMMS integration
71%Of ERV systems operate below design efficiency — undetected
$0.18–0.42Excess energy cost per square foot annually from neglected ERVs
8–18%HVAC energy spend recovered within 120 days of monitoring deployment
The ERV Efficiency Blind Spot
$14.2B
Global ERV market value by 2032
CAGR 11.8% — fastest growing ventilation segment
63%
Of commercial ERVs lack any form of real-time efficiency monitoring
Industry survey — facility managers 2025
85%
Design efficiency threshold — typical ERV baseline
Below 85% indicates maintenance required
Five Critical ERV Performance Indicators That Require Monitoring
01
Temperature Differential (Return vs. Supply)
The primary measure of energy recovery effectiveness. A properly functioning ERV transfers 65–80% of sensible heat from exhaust to supply air. A temperature differential drop of more than 15% from baseline indicates wheel degradation, bypass leakage, or airflow imbalance — detectable 4–8 weeks before energy bills reflect the loss.
02
Heat Wheel Rotational Speed
Fixed-speed ERV wheels are designed to rotate at 20–40 RPM depending on manufacturer and application. Speed variation of plus or minus 10% indicates motor wear, belt tension loss, or bearing degradation. A slowing wheel directly reduces recovery efficiency — each 5% speed reduction causes 3–4% efficiency loss.
03
Airflow Pressure Differential
Static pressure across supply and exhaust sides should remain within 15% of design. Rising pressure drop indicates filter loading, duct obstruction, or wheel matrix fouling. A 0.3 inch water column increase in static pressure increases fan energy consumption by 18–22% while reducing ventilation delivery.
04
Supply and Exhaust Fan Motor Amps
Motor current draw directly correlates with airflow and wheel load. Amps consistently 12% above nameplate indicate scroll fouling or bearing wear. Amps 15% below expected indicate belt slip, damper malfunction, or motor degradation — detection lead time of 3–8 weeks pre-failure.
05
Wheel Matrix Condition (via Differential Pressure)
Heat wheel media accumulates particulate over time, reducing open area and recovery efficiency. Pressure drop across the wheel matrix at fixed speed indicates fouling level. A 25% increase in wheel pressure drop triggers cleaning work order — restoring 8–14% of lost recovery efficiency.
ERV and Heat Recovery System Monitoring Checklist — Monthly & Quarterly Tasks
01
Log Temperature differential — Exhaust vs. Supply Air
Record both temperatures at full load. Calculate recovery efficiency. Decline of more than 5 percentage points from baseline initiates diagnostic work order for wheel or seal inspection.
Detects recovery loss early
02
Measure Wheel Rotational Speed (RPM)
Use tachometer or non-contact sensor. Compare to manufacturer spec. Variation beyond plus or minus 10% indicates drive system degradation requiring immediate inspection.
Prevents motor failure
03
Record Supply and Exhaust Airflow (CFM)
Measure at unit inlet/outlet using velometer. Supply and exhaust should be balanced within 10%. Imbalance indicates blocked duct or damper malfunction — corrects IAQ complaints.
Restores ventilation balance
04
Check Filter Pressure Drop
Measure static pressure across pre-filters and final filters. Replace when pressure drop exceeds 0.3 inches water column or per manufacturer limit. Log replacement date in CMMS.
Maintains airflow efficiency
05
Inspect Wheel Matrix for Fouling
Visual inspection via access panel quarterly. Measure pressure drop across wheel at fixed RPM. Increase exceeding 25% from clean baseline indicates cleaning required.
Restores heat transfer
06
Verify Bypass Damper Operation
Test economizer and bypass dampers through full stroke. Ensure seals close fully in recovery mode. Failed seals reduce effective recovery by 20–30% through air leakage.
Prevents cross-contamination
Monitoring Technology Comparison for ERV and Heat Recovery Systems
| Monitoring Method | Data Collected | Installation Cost | Detection Lead Time | Typical Application |
|---|
| OEM BAS/BMS Integration |
Fault codes, basic status — limited analog data$0–5,000 per system (existing)Fault code appears at or near failureLarge ERVs with factory controls Thermal Imaging (Periodic)Wheel surface temp, motor temp, duct leakage$200–500 per scanDays to weeksQuarterly diagnostic — single point in time Wireless Pressure + Temp SensorsStatic pressure, temperature differential, airflow estimate$180–350 per unit + gateway2–6 weeks pre-failureContinuous — detects degradation trends Motor Current Monitoring (CT Clamp)Fan and wheel motor amps, runtime, starts$80–150 per motor3–10 weeks pre-failureElectrical degradation and overload detection OxMaint Integrated SuiteTemp differential + speed + pressure + amps + automated work orders$250–450 per unit + software3–8 weeks pre-failureFull predictive + corrective workflow
Source: OxMaint commercial ventilation deployment data 2024–2025. Lead times vary by system size and operating load profile.
ROI Impact at a Glance — ERV and Heat Recovery Monitoring
8–18%
Reduction in total HVAC energy consumption
OxMaint customer data
$1,800
Average annual recovered value per 10,000 CFM ERV
Energy + avoided wheel/fan replacements
6–12 mo.
Payback period for monitoring hardware + software
Typical commercial deployment
“Heat recovery systems are the most monitored and least acted-upon equipment in mechanical rooms. I’ve reviewed trend logs from 200+ commercial buildings where ERW temperature differential was dropping for 6–12 months before any maintenance action was taken — not because the data wasn't there, but because no one connected the efficiency trend to a maintenance trigger. The buildings that outsource their ERV monitoring to a CMMS platform that auto-generates work orders at 88% of baseline efficiency see completely different outcomes: wheel cleaning happens at 25% pressure drop increase, not 50%; belt tension is corrected at 8% speed variation, not 20%; filter changes follow load-based pressure drop, not calendar guesses. OxMaint closes that loop — turning efficiency trends into maintenance actions before the building owner pays for the degradation on their utility bill.”
— Elena Vasquez, PE, LEED AP · Principal Mechanical Engineer, Ventilation & IAQ Specialist · 21 Years Commercial HVAC Optimization · ASHRAE Standard 62.1 Committee Member
Stop paying for heat recovery systems that aren't recovering. Start monitoring temperature differential, wheel speed, and airflow pressure today.
Frequently Asked Questions
What is the most cost-effective way to monitor an existing ERV without a BAS connection?
The most cost-effective approach combines wireless temperature sensors for supply/exhaust differential, a non-contact tachometer for wheel speed, and current transformers on fan motors — total hardware cost of $350–500 per unit. These sensors transmit to a gateway that aggregates data into the OxMaint dashboard. No BAS integration required. The system pays for itself through recovered energy within 6–12 months for any ERV operating more than 2,000 hours annually. For buildings with 5+ units, the per-unit cost drops to $220–300 through gateway sharing and volume pricing.
Sign in to configure sensor packages for your ERV portfolio.How often should ERV heat wheel matrix cleaning be performed?
Cleaning frequency depends on particulate load in the exhaust airstream. Standard office or retail: inspect quarterly, clean every 12–18 months. Restaurant kitchen exhaust (grease-laden air): inspect monthly, clean every 3–6 months. Healthcare or light industrial: inspect bimonthly, clean every 9–12 months. The most reliable trigger is pressure drop across the wheel at fixed RPM — a 25% increase from clean baseline pressure initiates cleaning regardless of calendar interval. OxMaint tracks pressure drop trends per unit and auto-generates cleaning work orders at configured thresholds.
Book a demo to see pressure-based cleaning triggers.What is the typical efficiency loss from a neglected ERV wheel or heat exchanger?
Efficiency loss accelerates non-linearly with neglect. A clean, properly operating ERV wheel achieves 65–80% sensible effectiveness (depending on design). With 12 months of no maintenance — assuming moderate particulate load — effectiveness typically drops to 55–65%, representing 15–20 percentage points of lost recovery. Annualized energy impact: $0.12–0.30 per square foot of conditioned space, or $1,200–3,000 per 10,000 CFM ERV. After 24 months without maintenance, effectiveness may fall below 50% — the wheel may require professional cleaning or matrix replacement ($2,500–8,000) rather than simple service.
Book a demo to calculate efficiency loss for your specific system type.Can OxMaint monitor both fixed-plate heat exchangers and rotary heat wheels?
Yes. OxMaint's monitoring framework supports both technologies with adjusted parameter sets. For rotary heat wheels, the platform tracks rotational speed, wheel motor amps, and pressure drop across the matrix. For fixed-plate exchangers, monitoring focuses on temperature differential across plates, cross-flow leakage (via CO2 or pressure differential), and fan motor currents. The alert engine uses technology-specific thresholds: plate exchanger efficiency below 75% of design triggers inspection; wheel speed variation beyond plus or minus 10% triggers drive system work order. Both report to the same portfolio dashboard.
Start a free trial to configure your mixed ERV portfolio.
Ready to recover the energy your ERV is wasting right now?