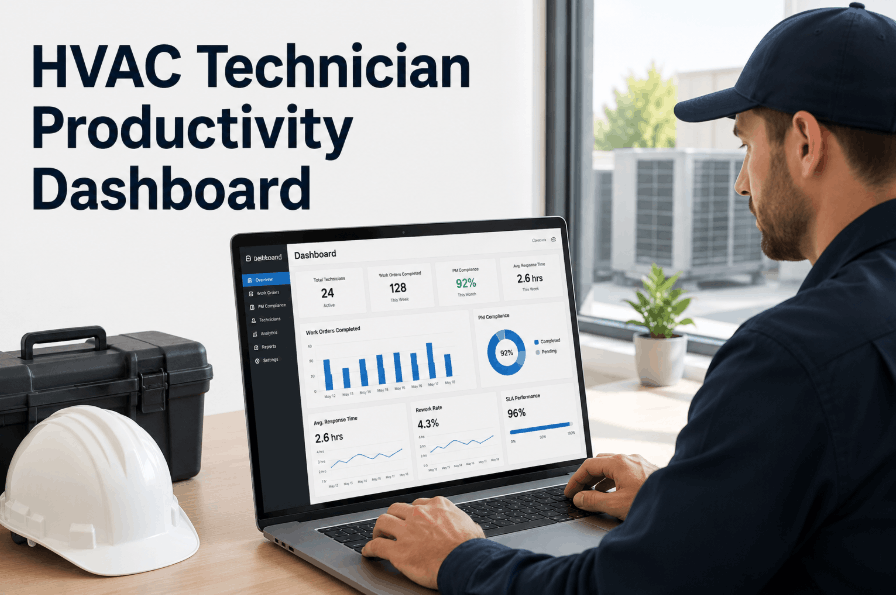
The productivity gap between top-performing HVAC companies and the rest of the industry is staggering. The top 10% of HVAC service companies generate $180,000-$280,000 in revenue per technician per year. The bottom 25% generate $80,000-$120,000 from the same technician working the same 40-50 hours per week. Same labor market, same customer base, same equipment brands — yet a 2-3x difference in output. The gap isn't about working harder. It's about systems, processes, and tools that eliminate waste from every hour of every technician's day.
After analyzing the operational practices of hundreds of HVAC companies using Oxmaint's workforce and maintenance platform, clear patterns emerge. Top-performing companies don't have secret formulas — they execute a set of specific, measurable, and replicable practices that any HVAC company can adopt. This guide breaks down the seven strategies that consistently separate the most productive HVAC operations from their competitors, with the exact metrics, implementation steps, and expected ROI for each.
Strategy 1: Eliminate Windshield Time With Zone-Based Dispatching
The average HVAC technician drives 45-90 minutes per day more than necessary because dispatchers assign calls based on availability rather than geography. Top companies divide their service territory into zones and assign technicians to zones, reducing average drive time between calls from 35-50 minutes to 15-25 minutes.
What Top Companies Do
Divide territory into 4-8 service zones based on call density. Assign 2-4 techs per zone. Dispatch within zone first, cross-zone only when no zone tech is available. Track average drive time per call as a weekly KPI. Use Oxmaint's GPS dispatch to auto-suggest the closest qualified tech for each call.
Measurable Results
25-40% reduction in average drive time per call. 1-2 additional calls per tech per day. $15,000-$30,000 additional revenue per tech per year. 15-25% reduction in fuel and vehicle maintenance costs. Reduced technician frustration from excessive driving.
Strategy 2: First-Visit Resolution Through Truck Stock Optimization
Every time a technician leaves a job site to get a part, 45-90 minutes of billable time evaporates. The industry average first-visit fix rate is 72-78%. Top companies achieve 88-95% by stocking trucks based on actual usage data rather than guesswork, and by maintaining a local parts depot for rapid replenishment.
What Top Companies Do
Analyze 12 months of parts usage data per technician to build individualized truck stock lists. Replenish trucks nightly from a central warehouse or through next-morning supplier delivery. Track parts-run frequency per tech as a KPI. Equip trucks with the top 50-80 parts that cover 90-95% of repair calls by frequency.
Measurable Results
First-visit fix rate improvement from 75% to 90%+. 60-80% reduction in mid-job parts runs. $8,000-$20,000 additional revenue per tech per year from recovered billable hours. 30-50% reduction in customer wait time. Higher CSAT scores from same-visit resolution.
Strategy 3: Digital Work Orders That Eliminate Paperwork
Paper work orders, handwritten invoices, and end-of-day data entry consume 30-60 minutes per technician per day. That's 2.5-5 hours per week of paid time producing zero revenue. Top companies have gone fully digital: work orders dispatched to mobile devices, completion reports submitted on-site, invoices generated automatically, and customer signatures captured on-screen.
What Top Companies Do
All work orders created, dispatched, and completed in Oxmaint's mobile app. Equipment history, customer notes, and previous service records available to the tech before arrival. Digital completion checklists ensure nothing is missed. Invoice generated from work order data — no manual entry. Customer pays on-site or receives digital invoice immediately.
Measurable Results
30-60 minutes per tech per day recovered. 50-70% reduction in invoicing errors. 15-25% faster payment collection (digital invoice sent immediately vs. mailed days later). Elimination of lost or illegible paper work orders. Complete service history available for every customer and equipment unit.
Strategy 4: Structured Diagnostic Protocols
Unstructured diagnostics are the hidden time killer. A junior tech spends 45 minutes troubleshooting what a senior tech diagnoses in 10 — not because of talent, but because the senior tech follows a systematic process while the junior tech guesses. Top companies codify their best technicians' diagnostic approaches into step-by-step protocols accessible on every tech's mobile device.
What Top Companies Do
Build diagnostic decision trees for the top 20 most common failure modes (which account for 80% of service calls). Embed these in the mobile work order so techs follow the tree during diagnostics. Include expected measurements, normal ranges, and "if this then that" logic. Update protocols quarterly based on new failure patterns and technician feedback.
Measurable Results
25-40% reduction in average diagnostic time for junior/mid-level techs. 30-50% reduction in callbacks from misdiagnosis. Higher average ticket from more thorough diagnostics (techs find more issues when following a complete checklist). Faster onboarding of new hires — productive in weeks instead of months.
Top HVAC Companies Don't Work Harder. They Work Smarter.
Oxmaint provides the digital infrastructure for every strategy on this page: zone-based dispatching, truck stock optimization, digital work orders, diagnostic protocols, performance dashboards, and incentive tracking — all in one platform.
Strategy 5: Real-Time Performance Visibility
You can't improve what you can't see. Bottom-quartile companies have no idea which techs are productive and which aren't until the end-of-month P&L shows a problem. Top companies track performance in real time and make it visible to both managers and technicians — creating a self-correcting feedback loop that improves behavior continuously.
What Top Companies Do
Deploy Oxmaint's performance dashboards showing daily utilization rate, revenue per tech, calls completed, average ticket, and callback rate. Techs see their own scorecards on their mobile app. Managers run 15-minute weekly 1-on-1 coaching sessions using the data. Team leaderboards drive healthy competition.
Measurable Results
15-30% improvement in average technician productivity within 6 months. Bottom-quartile techs improve the most (20-40% gains) because they finally see the gap. Top performers earn recognition and bonuses they can quantify. Manager coaching conversations become objective and productive instead of subjective and adversarial.
Strategy 6: Preventive Maintenance Programs That Create Capacity
Emergency demand calls are unpredictable, urgent, and disruptive to scheduling. PM visits are scheduled, predictable, and stackable into efficient routes. Top companies shift their revenue mix from 70% demand / 30% PM to 50% demand / 50% PM through aggressive service agreement sales — and their techs become more productive because PM visits are faster, more predictable, and generate higher average tickets through identified repair needs.
What Top Companies Do
Target 50%+ revenue from service agreements and PM contracts. Schedule PM visits in geographic clusters (6-8 PMs in a zone in one day). Use PM checklists that systematically identify repair needs, generating service recommendations on every visit. Track PM-to-repair conversion rate as a KPI. Aim for 35-50% of PM visits generating a follow-up repair or upgrade recommendation.
Measurable Results
PM visits average 45-75 minutes vs. 1.5-2.5 hours for demand calls. Techs complete 6-8 PMs per day vs. 3-5 demand calls. 35-50% of PM visits generate repair recommendations (additional revenue). Smoother scheduling reduces overtime by 20-30%. Customer retention rate increases from 60-70% to 85-95% with active agreements.
Strategy 7: Incentive Programs That Align Technician and Company Goals
The final strategy is the multiplier that amplifies all the others. When technicians have a direct financial stake in their own productivity — and can see exactly how their daily actions translate into earnings — every other improvement accelerates. Top companies spend $8,000-$22,000 per tech per year on incentives and earn $30,000-$75,000 per tech in return.
What Top Companies Do
Commission on repair revenue (3-6%). Spiffs on service agreement sales ($25-$75 each). Quarterly bonuses tied to utilization, first-visit fix rate, and CSAT score. Real-time earnings visibility on the tech's mobile app via Oxmaint's incentive tracker. Tiered bonuses with threshold/target/stretch levels. Annual top-performer recognition with meaningful rewards.
Measurable Results
20-40% revenue increase per tech. 30-50% improvement in service agreement conversion. 25-45% lower technician turnover (top performers stay when compensated for their value). $30,000-$75,000 additional revenue per tech per year. 186-370% return on incentive investment.
The Compound Effect: What Happens When You Implement All Seven
Each strategy delivers meaningful improvement on its own. But the real transformation happens when all seven work together as an integrated system:
Join the Top 10%. Start With One Strategy. Scale to All Seven.
Oxmaint is the platform that powers every strategy on this page. Start with the one that addresses your biggest productivity gap, prove the ROI, and expand from there.
Frequently Asked Questions
Which strategy should we implement first?
Start with Strategy 3: Digital Work Orders. It's the foundation that enables everything else — you can't track performance, optimize dispatch, or manage incentives without digital work order data. Implementation takes 1-2 weeks and delivers immediate time savings. Once digital work orders are flowing, add Strategy 1 (zone dispatching) and Strategy 5 (performance visibility) simultaneously — these build directly on the data from digital work orders. Strategies 4, 6, and 7 can follow in any order based on your biggest gaps.
How long does it take to see measurable productivity improvement?
Digital work orders and zone dispatching show results within 2-4 weeks (less paperwork time, shorter drive times are immediate). Truck stock optimization takes 4-8 weeks to analyze usage data and adjust inventory. Performance visibility drives behavior change within 30-60 days as techs start seeing their metrics. Diagnostic protocols take 2-3 months to build and deploy but show results immediately once in use. Incentive programs typically show full impact within one quarter. Most companies see 10-15% overall productivity improvement within 90 days and 25-40% within 12 months.
Do these strategies work for small companies (5-10 techs)?
Every strategy works at any size, but the implementation scales. A 5-tech company might have 2 service zones instead of 8. Their diagnostic protocols cover 10 failure modes instead of 20. Their incentive program is simpler. But the principles are identical: reduce wasted time, increase first-visit resolution, eliminate paperwork, make performance visible, and align incentives. In fact, small companies often see faster improvement because changes are easier to implement and the feedback loop is tighter. Many Oxmaint customers with 5-15 techs report the highest percentage improvement because they're starting from a lower baseline.
How does Oxmaint support all seven strategies in one platform?
Oxmaint is built as an integrated workforce productivity platform, not a collection of separate tools. GPS-verified dispatch feeds zone optimization (Strategy 1). Work order parts tracking feeds truck stock analysis (Strategy 2). Digital work orders are the core workflow (Strategy 3). Configurable checklists power diagnostic protocols (Strategy 4). Automated KPI dashboards deliver performance visibility (Strategy 5). PM scheduling and agreement management enable maintenance programs (Strategy 6). Commission and spiff calculators drive incentive programs (Strategy 7). Every piece shares the same data layer, so there's no duplicate entry and every insight connects to every other.
What's the ROI of implementing all seven strategies?
For a 20-technician HVAC company starting at $130K revenue per tech, implementing all seven strategies over 12 months typically achieves $200-250K revenue per tech — an increase of $70-120K per tech per year. Across 20 techs, that's $1.4M-$2.4M in additional annual revenue. The total investment (software, incentive payouts, truck stock optimization, training) runs $200K-$400K, delivering a 3.5-12x return. Most companies reach positive ROI within 60-90 days from the first two strategies alone and compound gains as they add the remaining five.