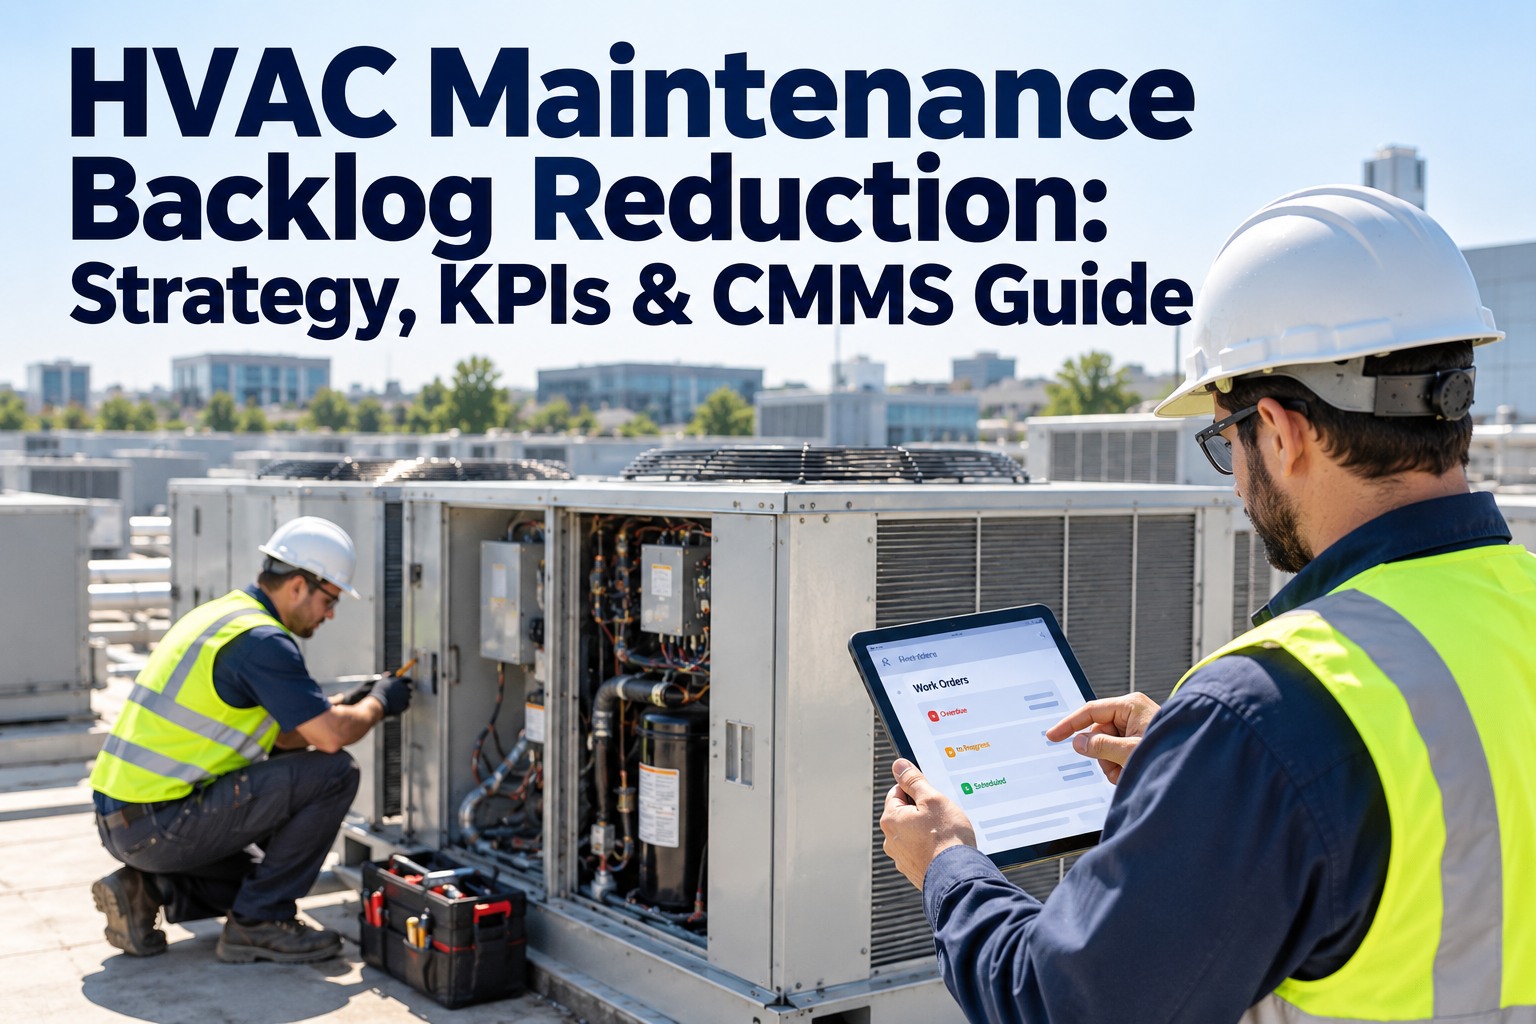
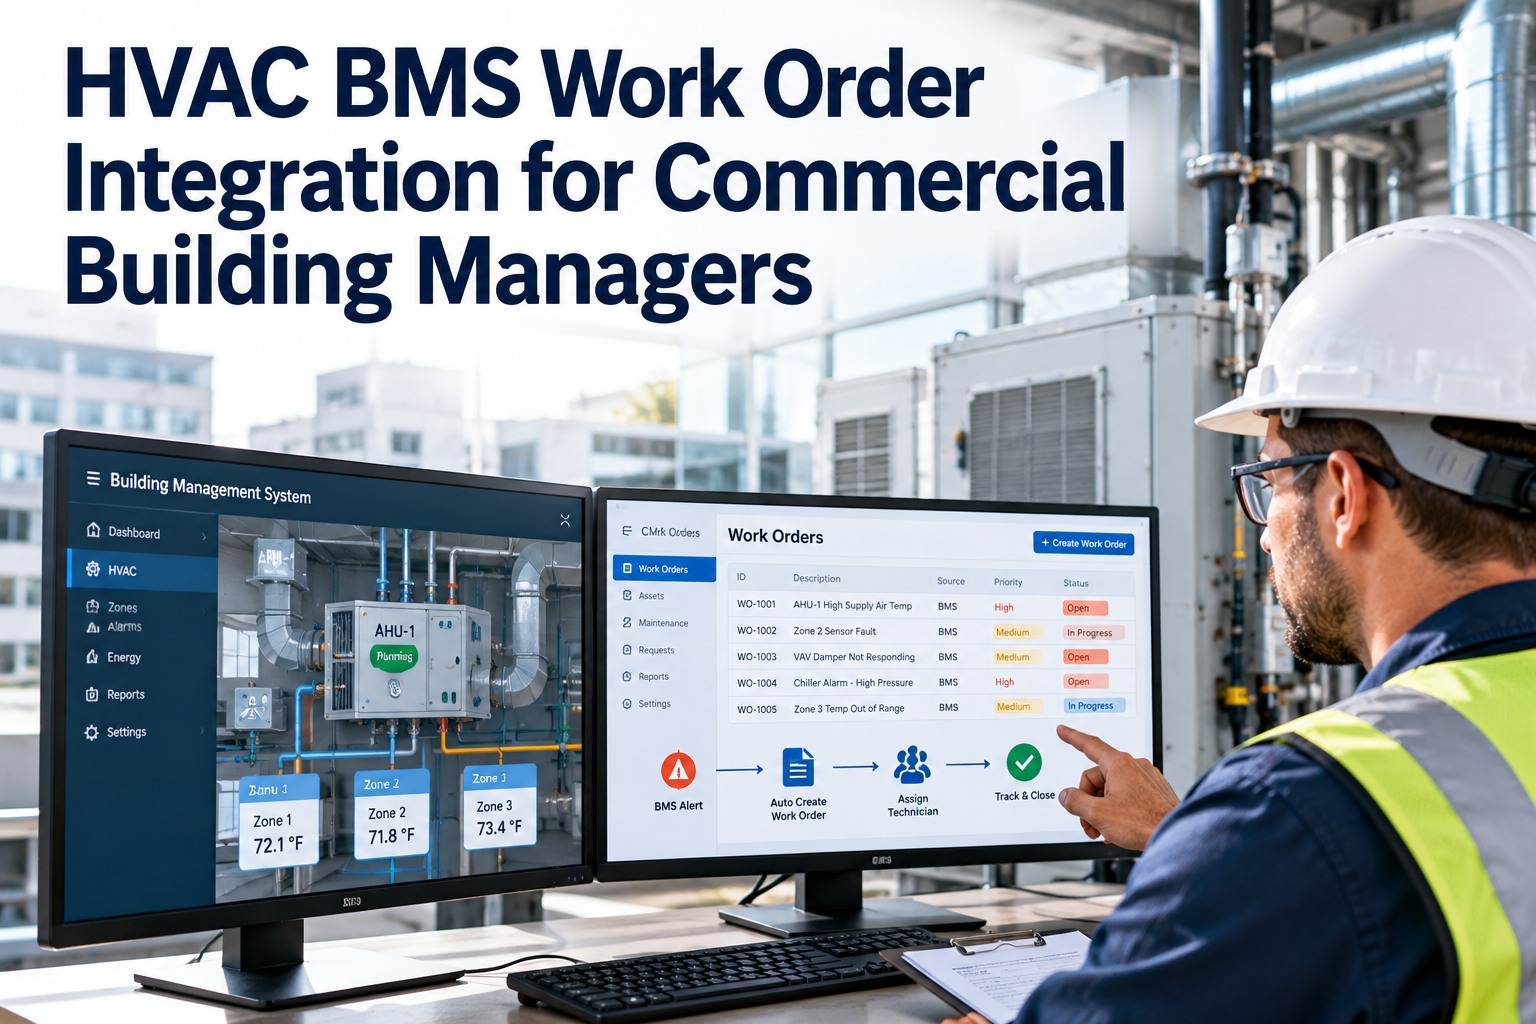
Commercial HVAC backlog never announces itself — the skipped filter, the "watch it" compressor, the rooftop unit limping since spring — it just grows until a $200 job becomes a five-figure emergency. Reducing it means stopping new work from piling up faster than you drain it, and proving in weeks and numbers that the pile is shrinking. This guide covers the strategy, KPIs and work-order discipline behind HVAC backlog reduction using OXMAINT AI, the AI-powered CMMS that turns every squawk, inspection and PM into a ranked, trackable work order.
Facility Operations · HVAC Maintenance · Backlog Reduction
HVAC Maintenance Backlog Reduction: Strategy, KPIs & CMMS Guide.
HVAC backlog reduction is a two-front job: stop new work from forming faster than you can close it, and drain the pile already waiting. OXMAINT AI runs both fronts on one platform — PM discipline that holds the line, ranked triage that sequences the drain, and a live backlog-in-weeks reading that shows the pile falling.
1 Measure in crew-weeks
2 Stop the inflow
3 Drain by priority
4 Prove it is falling
2–4 Weeks
the healthy backlog range for most teams — above it, risk starts compounding
90 Days
the age at which deferred HVAC work begins driving compounding failure risk
8–12% / yr
how fast an untracked backlog grows on its own, before a single new fault
~40%
share of building energy HVAC drives — so a deferred unit leaks money daily
First, Know What a Backlog Actually Is (and Isn't)
Backlog is not a sign of failure — a healthy HVAC program always carries some. The problem is not having a number for it and not knowing which direction it is moving. Backlog is all identified, approved work not yet finished, measured in crew-weeks: open-work hours divided by weekly crew capacity. Deferred maintenance is the slice you have consciously postponed — a subset, not the whole. A backlog of zero is a red flag, not a trophy; it usually means you have stopped looking. Start free and get a live backlog-in-weeks reading in OXMAINT AI.
Where Your Backlog Sits — Read It in Weeks
2–4 wks
HEALTHY
Enough to keep crews scheduled, not so much that priority work stalls
4–6 wks
STRESS
Work is aging faster than it closes — intervene before the tail grows
6+ wks
CRITICAL
Routine jobs now fail before they are reached — you are running reactive
Ranges vary by operation — pharma and food teams often target the tighter 2–4 weeks; some process settings run 4–6. The point is to pick a target and trend against it.
The Two-Front Model — Stop the Inflow, Drain the Backlog
Picture the backlog as water in a tub. New work pours in from the top — squawks, failures, PMs coming due, inspection finds. Completed work drains out the bottom at the rate your crew can close it. The level only falls when the drain beats the tap. Working harder on the drain while the tap runs wide open is why so many backlog pushes stall. OXMAINT AI measures both flows and the gap between them, so you manage the number, not the panic.
THE TAP · INFLOW
New Work In
- Breakdown calls & squawks
- PMs coming due
- Inspection finds
- Deferred items re-surfacing
→
THE LEVEL · BACKLOG
Crew-Weeks Waiting
Open hours ÷ weekly capacity = the level you are managing down
→
THE DRAIN · OUTFLOW
Work Closed Out
- Crew capacity per week
- Ready, planned work
- Contractor overflow
- Batched PM visits
Recovery velocity = work closed − work opened, per week. Positive means the level is falling. Reduce backlog on both fronts at once: narrow the tap with PM discipline, widen the drain with ranked triage.
Front 1 — Narrow the Tap: Stop New Backlog Forming
Most backlog is self-inflicted. Routine work that fires late becomes corrective work; a missed filter becomes a fouled coil becomes a compressor. Planned maintenance done on cadence is the cheapest backlog reduction there is — the Department of Energy puts structured programs at roughly half the total maintenance cost of running to failure. Front 1 is about making sure routine work never ages into the pile. Book a demo to see automated PM scheduling in action.
A
Automated PM Scheduling
PMs fire on date and on runtime hours — not on someone's memory. Routine filters, belts and inspections close before they can become backlog.
B
Seasonal Readiness Waves
Pre-cooling and pre-heating PM waves get units ready before peak load — so you are not closing emergency calls during the one week the equipment matters most.
C
Squawk to Ranked Work Order
Every technician find becomes a prioritized, tracked work order the moment it is logged — not a sticky note on a clipboard that quietly ages into next quarter.
D
Catch Small Before Big
Filters, drain pans, belts and coils handled on cadence stop the cascade into compressor failures and full replacements — the jobs that bloat a backlog fastest.
Front 2 — Widen the Drain: Triage What's Already Waiting
A pile of waiting work is not one problem — it is four, and treating them the same is why burndowns stall. Attack it oldest-first and you waste the crew on low-risk jobs; attack it loudest-first and you never get ahead. The faster path sorts every open item into one of four lanes, then works the lanes in parallel: clear ready quick-wins to build visible velocity, and take down one critical item every week so risk falls alongside volume. Sign up free and sort your open HVAC work into triage lanes.
LANE A
Do Now
Safety, indoor-air-quality or season-critical units with occupants affected. These clear first, every week, no exceptions.
Failed unit on an occupied floor · gas or refrigerant safety · peak-season outage
LANE B
Schedule It
Plannable corrective work with parts and labor available. Sequence it into the calendar and protect the slot — this is the bulk of a healthy drain.
Economizer repair · sensor replacement · motor on a watch list
LANE C
Batch Into PM
Small items grouped into the next scheduled visit to the same unit or roof. One trip, many jobs closed — the cheapest hours in the whole backlog.
Minor leaks · worn grommets · labeling · belt tension on the same rooftop run
LANE D
Defer to Replace
Repairs on end-of-life assets — commercial HVAC degrades hard after about year 18. Route these to the capital plan instead of re-queuing good money after bad.
Repeat failures on a 20-year unit · obsolete parts · repair cost nearing replacement
What a Burndown Actually Looks Like
Reduction is not a one-time cleanup — it is a trend line pointed down and held there. Clear the ready quick-wins first and the number drops fast; the real test is whether recovery velocity stays positive once the easy work is gone. The panel below is illustrative, but the shape is what you are managing toward: out of the critical zone in the first month, into the healthy band and holding. Book a demo to see your own backlog trend live.
Illustrative 12-Week Backlog Burndown — Crew-Weeks
Critical 6+
Stress 4–6
Healthy 2–4
Velocity turns reliably positive once Front 1 narrows the tap — otherwise the line flattens the moment the quick-wins run out.
The 4 Numbers That Prove the Backlog Is Shrinking
You cannot manage a backlog you cannot see, and a single number lies. Depth without direction hides a pile that is quietly growing; direction without depth hides a long tail of aging risk. Track these four together and the whole picture is honest. Start free and put these four KPIs on one screen.
01
Backlog — Crew-Weeks
Open-work hours ÷ weekly crew capacity. This is the depth. Target the 2–4 week band and defend it.
Good: steady inside 2–4 weeks
02
Recovery Velocity
Work closed minus work opened, each week. This is the direction. Positive means the level is falling.
Good: positive and holding
03
Aged-Backlog %
Share of open work older than 60 days. A short tail means nothing critical is quietly rotting on a roof.
Good: small and falling tail
04
PM-to-CM Ratio
Planned hours vs corrective hours. Rising means you are getting ahead of failures — the surest leading sign the tap is narrowing.
Good: trending toward planned
Report depth and direction side by side: four weeks and falling is a healthy program; four weeks and climbing is an early warning you still have time to act on.
The Drain Is Only as Wide as Your Crew
Every backlog plan runs into the same wall: capacity. HVAC hiring is tight nationwide, and you rarely get to solve a backlog by adding headcount. Three levers widen the drain without it:
1 Size the queue to real capacity — commit only the hours the crew can actually close, so the plan stays honest.
2 Push ready, planned overflow to contractors — Lane B work that is fully scoped is the safest to hand off.
3 Reclaim wrench time — PM automation gives technicians back the hours lost to chasing paperwork and parts.
Stop Guessing How Big the Pile Is. Watch It Shrink Every Week.
OXMAINT AI reads your backlog in crew-weeks, sorts it into triage lanes, and trends recovery velocity — so the drain beating the tap is something you can see, not hope for.
How OXMAINT AI Helps You Reduce the Backlog
Every strategy above comes down to one platform doing six jobs at once — holding the number, catching the intake, firing the schedule, ranking the triage, proving the trend, and handing off what should be replaced. This is the maintenance management software behind an HVAC backlog that actually falls week over week. Book a demo to watch OXMAINT AI run an HVAC backlog end to end.
SEE IT
Live Backlog in Crew-Weeks
Open hours ÷ real crew capacity, trended weekly and split ready vs not-ready. The one number that turns a budget argument into a fact you can point at.
CATCH IT
Every Squawk Becomes a Ranked WO
Inspection finds and operator reports turn into prioritized, tracked work orders the moment they are logged — so nothing ages quietly on a clipboard into next quarter.
PREVENT IT
PM That Fires on Time and Runtime
Date- and runtime-based preventive schedules close routine filters, belts and coils on cadence — so they never age into the backlog in the first place.
SORT IT
HVAC Triage That Sequences the Drain
Priority scoring sorts open work into do-now, schedule, batch and defer-to-replace — so the crew always knows the single right job to pick up next.
PROVE IT
Proof the Pile Is Falling
Recovery velocity and aged-backlog % trended week over week — so you can show the line bending down, and catch it flattening before it climbs again.
HAND IT OFF
Deferred Work Routed to Capital
End-of-life units that no longer earn a repair are handed to a funded replacement plan with full asset history attached — not re-queued into the backlog forever.
"
We always knew the backlog was bad — we just never had a number for it, so every budget conversation was a shouting match about feelings. Putting it in crew-weeks changed the whole conversation. The first month we cleared the ready work and the line dropped fast; the part that mattered was month three, when the quick-wins were gone and the number kept falling because the PM side had finally caught up. We stopped reacting to the loudest building and started working the lanes.
Director of Facilities Operations · Multi-Site Commercial Portfolio
Frequently Asked Questions
What is the difference between HVAC maintenance backlog and deferred maintenance?
Backlog is all identified, approved work not yet finished, measured in crew-weeks. Deferred maintenance is the portion you have deliberately postponed — a subset of the backlog, not the whole thing. Reducing backlog means closing work faster than it arrives; reducing deferred maintenance means clearing the postponed tail before it fails.
Sign up free to see both in OXMAINT AI.
What is a healthy HVAC maintenance backlog?
For most teams, 2–4 crew-weeks is the healthy band — enough to keep technicians scheduled without priority work stalling. Four to six weeks is a stress signal; above six, routine jobs start failing before they are reached. A backlog of zero is a warning sign, usually meaning you have stopped identifying work.
How do I decide which backlog items to tackle first?
Sort every open item into four lanes — do-now (safety and season-critical), schedule (plannable corrective), batch into the next PM visit, and defer-to-replace for end-of-life assets. Then work the lanes in parallel: clear ready quick-wins for visible velocity and take down one critical item each week so risk falls with volume.
Won't reducing backlog just mean hiring more technicians?
Rarely, and rarely possible given the HVAC labor shortage. The bigger wins come from narrowing the inflow with PM discipline, handing fully-scoped planned work to contractors, and reclaiming the wrench time technicians lose to paperwork and parts chasing. Capacity is a lever you tune, not just a number you buy.
How does a CMMS actually help reduce backlog?
It makes the backlog a live number instead of a guess, turns every find into a ranked work order so nothing ages silently, schedules PMs automatically so routine work never piles up, and trends recovery velocity so you can prove the level is falling week over week.
Two Fronts. Four Numbers. One Backlog, Falling Every Week.
Move your HVAC backlog reduction onto OXMAINT AI — PM discipline that narrows the tap, triage lanes that widen the drain, and a live crew-weeks reading that proves the level is dropping. Stop reacting to the loudest building and start working the number down.