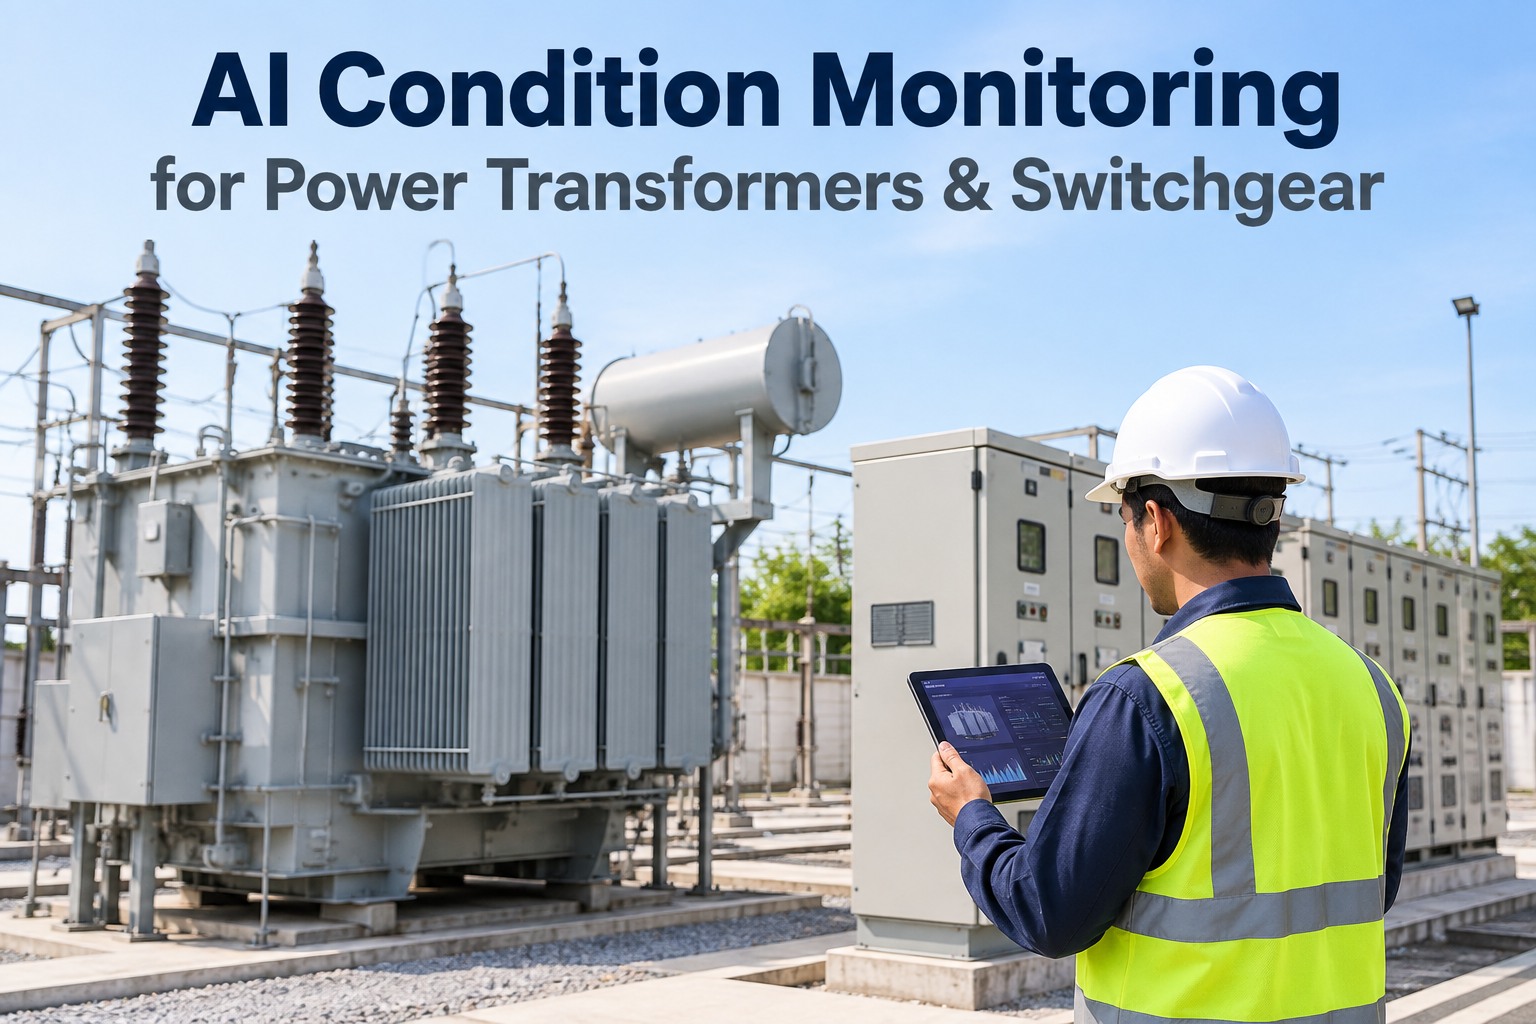
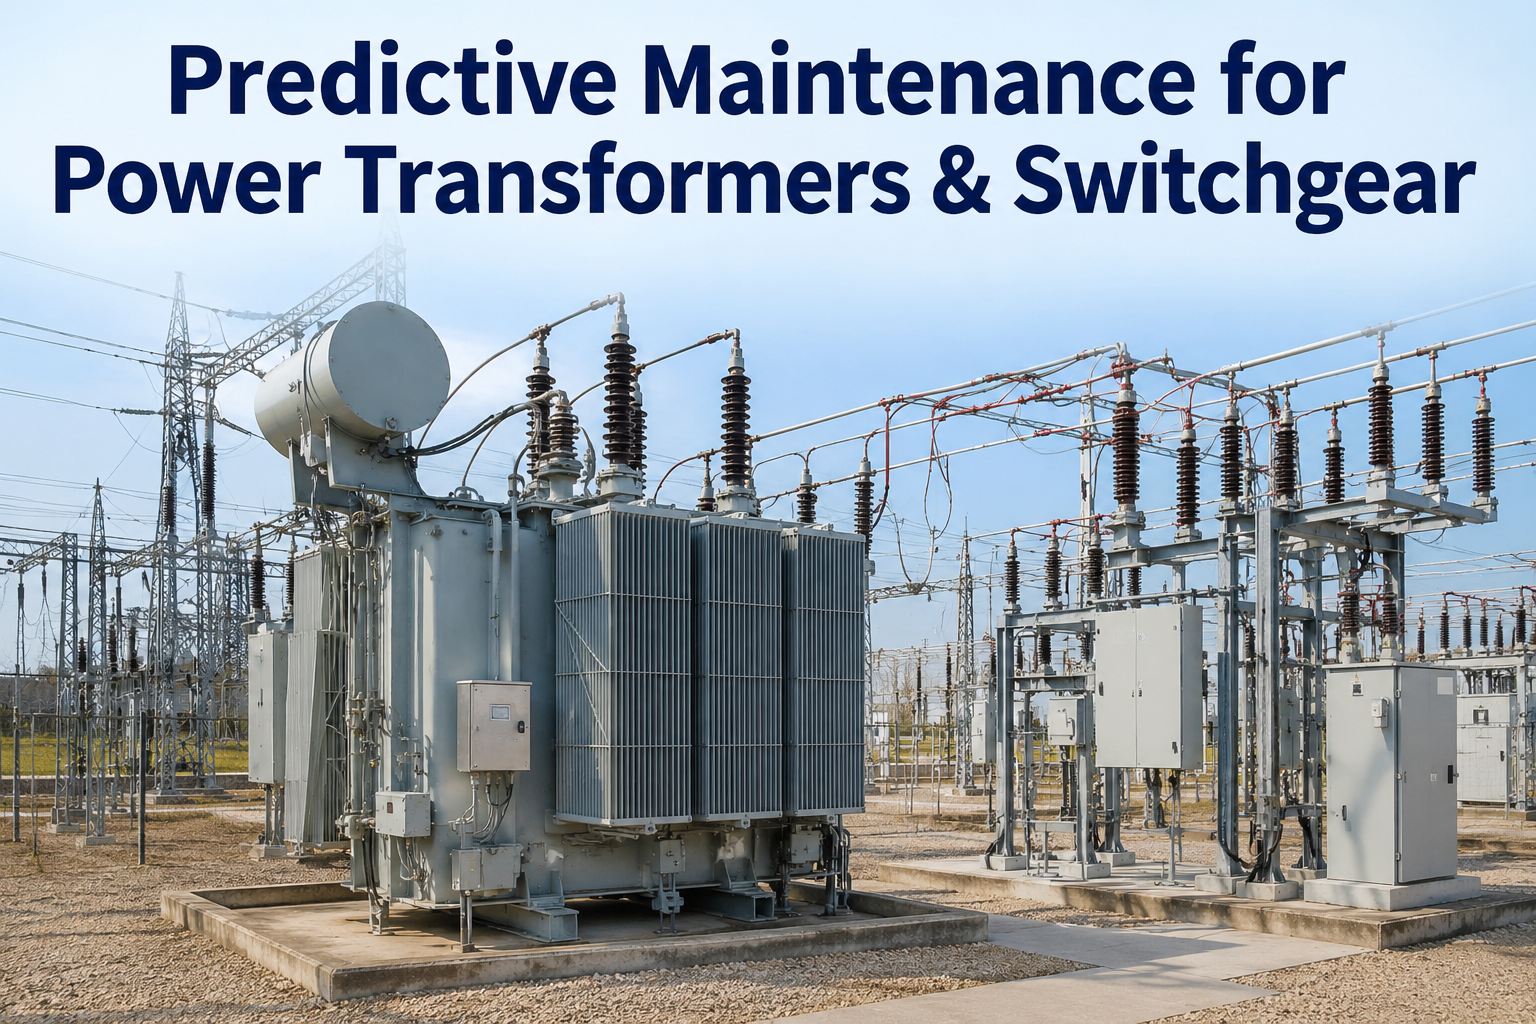
A power transformer almost never fails without warning — it fails without anyone watching the warning. Dissolved gases climb, partial discharge activity rises in a bushing, a hot-spot creeps up in the windings, and the fault is written in the data days to weeks before the SCADA alarm ever trips. AI condition monitoring for power transformers and switchgear reads those signals continuously and turns them into a work order while there's still time to act. This guide maps the failure origins, the sensing layers that catch each one, the diagnostic standards behind them, and how the whole chain closes into maintenance. Start free on OxMaint to connect your fleet, or schedule a demo.
DGA · Partial Discharge · Thermal · Bushing · OLTC
AI Condition Monitoring for Power Transformers & Switchgear
The fault is in the data before it's on the alarm panel. Read every layer, cross-validate the signature, and route it to a work order — weeks early.
30–90d
Advance warning dissolved-gas trends commonly give before a fault becomes critical
3
Failure origins behind most transformer faults — windings, bushings, tap changer
Multi
Cross-validated diagnosis (Duval + IEC 60599 + IEEE C57.104) beats any single gas reading
~15 min
Online DGA sampling cadence now common on larger units — vs a quarterly lab draw
Start With the Failure, Not the Sensor
Most monitoring pitches lead with sensors. That's backwards. The right starting point is how a transformer actually fails — because the failure origin dictates which sensing layer you need and which standard interprets it. Nearly all transformer faults trace to three origins, and each degrades on its own physics and its own timeline.
Origin 01
Windings & Core
Insulation aging, hot-spots, and mechanical looseness inside the tank. The slowest-burning and often the most expensive — a single undetected winding hot-spot can escalate an oil sample's worth of warning into a full replacement.
Origin 02
Bushings
Exposed to weather and electrical stress; dielectric flashover of bushing insulation is one of the most frequent failure causes. Partial discharge activity here often appears weeks before breakdown.
Origin 03
On-Load Tap Changer
The OLTC performs thousands of switching operations a year — mechanical wear and contact coking accumulate far faster than in the main tank, giving it a failure clock all its own.
The Sensing Layers · Each Origin Has Its Signal
Once you know the origin, the sensing layer follows. This is the diagnostic stack for transformers and switchgear — what each layer measures, and the failure origin it covers earliest. AI's role is not to replace any layer but to watch them all continuously and flag the correlated drift a human reviewing one chart a quarter would miss.
DGA
Dissolved Gas Analysis
Windings · Core
Tracks hydrogen, acetylene, ethylene, methane, ethane, and carbon oxides dissolved in the oil. Rate-of-change trending is the single richest early signal for thermal and electrical faults inside the tank.
PD
Partial Discharge
Bushings · Insulation
UHF, acoustic, or HFCT sensors detect insulation weak-spots. A rapidly rising PD trend — even from a low base — warrants investigation regardless of absolute level.
TMP
Thermal / Hot-Spot
Windings · Cooling
Top-oil temperature is the baseline; fiber-optic probes read winding hot-spots directly. Rising thermal trend with cooling-system context reveals overload and cooling loss.
MST
Moisture-in-Oil
Insulation health
Insulation dryness is critical at high voltage; moisture trending protects the paper insulation that determines transformer life.
OLTC
Tap-Changer Monitoring
Mechanical wear
Motor current, drive torque, timing, and contact-temperature signatures catch OLTC mechanical wear and coking on its faster wear clock.
SWG
Switchgear PD & Thermal
Switchgear · Cable
PD and thermal sensing on switchgear, bus, and cable terminations — the same insulation physics, caught with RFCT and ground-path sensors on the gear side.
Turn Every Sensing Layer Into One Work-Order Pipeline — Free Forever
DGA, PD, thermal, moisture, and OLTC data are only worth the sensors if the anomaly becomes an action. Connect your monitors to OxMaint and let each layer's threshold fire a diagnostic work order against the right asset. No card, no time limit.
Why Single-Signal Reading Fails · The Cross-Validation Rule
The defining discipline of transformer diagnostics is that no single reading is trusted alone. Elevated acetylene with normal hydrogen means something entirely different from the same acetylene alongside rising hydrogen and carbon monoxide. This is exactly where AI earns its place — cross-validating the gas ratios against the recognized interpretation methods instead of tripping one threshold at a time.
Duval Triangle
Maps the ratio of three key gases into fault zones — thermal vs electrical, and the severity band. The visual workhorse of DGA interpretation.
IEC 60599
Ratio-based gas interpretation for oil-filled equipment — an international anchor for classifying fault type from gas patterns.
IEEE C57.104
Gas concentration and generation-rate framework — the reference for whether a level and its trend warrant action.
Honest framing matters here: online monitoring does not guarantee prevention. Some faults develop fast, some modes give no clear DGA signature in time, and monitor coverage varies by device and calibration. What AI condition monitoring reliably delivers is earlier, better-organized review — turning a stream of raw readings into a cross-validated case an engineer can act on. That's the real value, and it's worth being straight about.
From Signal to Closed Repair · The Chain That Pays Back
A monitor that raises an alarm nobody actions is a cost. The payback lives in the chain from a gas trend to a closed work order — and every link has to hold.
01
Ingest & Normalize
Online DGA, PD, thermal, and OLTC feeds pulled in, timestamps and units normalized, tied to the asset ID.
→
02
Detect & Classify
Rate-of-change and multivariate models flag drift; gas ratios cross-checked against Duval / IEC / IEEE to classify the fault.
→
03
Route the Work Order
A diagnostic WO opens against the transformer or switchgear with the evidence package and recommended next check attached.
→
04
Act & Retain
Crew acts, closes with evidence, and the record feeds the reliability history and the ISO 55000 audit trail.
The Reliability Numbers Worth Tracking
A transformer monitoring program proves itself on a small set of numbers — the ones that show the AI is buying lead time and avoiding failures, not just filling a dashboard.
Fault Lead Time
Days from first flag to intervention
The headline metric — how much warning the program bought. Dissolved-gas trends commonly give 30–90 days when watched continuously.
Forced Outage Rate
Unplanned events per unit / year
The bottom-line reliability number. Integrated DGA + PD programs benchmark materially lower than unmonitored fleets.
DGA Trend Coverage
% critical units on online DGA
How much of the fleet is actually watched continuously vs sampled quarterly — the coverage that makes lead time possible.
Alarm-to-WO Ratio
Actionable vs noise
Whether alarms become work orders or get ignored. Cross-validation keeps this healthy by suppressing single-signal false positives.
How OxMaint Runs Transformer & Switchgear Monitoring
Ingestion, cross-validated detection, work-order routing, and the retained reliability record all live on one platform — every transformer and switchgear line carried as an asset with its sensing layers, diagnostic history, and audit trail in one place.
Ingest
DGA · PD · Thermal · OLTC
Online monitor feeds and lab DGA pulled into one asset record, timestamps and units normalized against the unit.
Detect
Multivariate + Rate-of-Change
Trend acceleration and correlated drift flagged across layers — the pattern a single quarterly chart never shows.
Classify
Duval / IEC / IEEE Cross-Check
Gas ratios validated against recognized interpretation methods so an alert arrives as a classified fault, not a bare number.
Route
Evidence-Packed Work Order
A diagnostic WO opens with the gas trend, PD data, and recommended next step attached, routed to the right crew.
Track
Reliability Dashboard
Lead time, forced-outage rate, and DGA coverage across the fleet in one reliability-director view.
Audit
ISO 55000-Ready Records
Every alert, action, and closure retained as an audit-ready reliability trail for internal and asset-management programs.
Catch the Fault While It's Still an Oil Sample, Not a Replacement
Free forever plan — no card, no time limit. Connect one transformer's DGA and PD feeds, let the cross-validated detection run, and turn every trend into a routed, evidence-packed work order. Or book 30 minutes and we'll map your substation fleet onto the platform end to end.
Frequently Asked Questions
What does AI condition monitoring actually watch on a power transformer?
The core layers are dissolved gas analysis (gases in the oil that reveal thermal and electrical faults in the windings), partial discharge (insulation weak-spots, especially in bushings), thermal and hot-spot sensing, moisture-in-oil, and on-load tap-changer monitoring. Switchgear adds PD and thermal on the gear, bus, and cable side. AI's job is to watch all of them continuously and flag correlated drift, not to replace any single measurement.
How much early warning does dissolved gas analysis give?
When trended continuously, dissolved-gas signatures commonly provide 30–90 days of advance warning before a fault becomes critical — which is why online DGA monitors sampling roughly every 15 minutes have become common on larger units. A quarterly manual lab draw routinely misses the rate-of-change shifts that continuous sampling catches. The warning is only useful, though, if it's connected to a maintenance workflow.
Why can't we just alarm on a single gas threshold?
Because single-parameter interpretation is unreliable. Elevated acetylene with normal hydrogen has a different diagnosis than the same acetylene with rising hydrogen and carbon monoxide. Accurate fault classification cross-validates gas ratios using the Duval Triangle, IEC 60599, and IEEE C57.104 together. A single threshold produces both false alarms and missed faults — which is exactly the noise that trains crews to ignore the system.
Book a demo to see cross-validation in the platform.
Does online monitoring guarantee we won't have a transformer failure?
No, and any vendor claiming otherwise is overselling. Some failures develop quickly, some modes give no clear DGA signature in time, and monitor coverage and accuracy vary by device and calibration. What AI condition monitoring reliably delivers is earlier and better-organized review — converting raw readings into a cross-validated case with enough lead time to plan an intervention. That's a large, real benefit without the false promise.
How does this connect to our CMMS and maintenance workflow?
Through the work order. An anomaly on any sensing layer, once cross-validated, auto-generates a diagnostic work order against the specific transformer or switchgear line, with the evidence package and recommended next check attached and routed to the right crew. The closure feeds the reliability history and the ISO 55000 audit trail. Without that link, a monitor is just another screen.
Start free to wire the chain from sensor to closed repair.