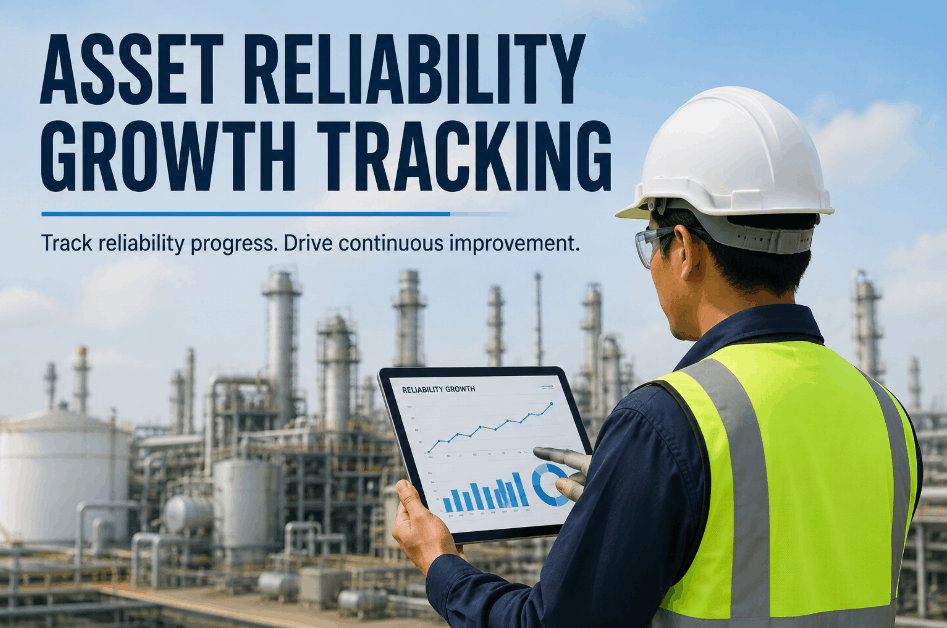
Reliability improvement programs fail not because the maintenance actions are wrong but because teams cannot see whether those actions are producing measurable results over time. Without asset reliability growth tracking, PM program changes, overhaul investments, and root cause corrections all disappear into the general maintenance backlog — with no way to validate that uptime actually improved. Sign Up Free to see how OxMaint gives industrial maintenance teams the asset history, failure interval records, and PM outcome data needed to track reliability growth across individual assets and the full equipment portfolio.
Track Whether Your Reliability Improvements Are Actually Working
OxMaint connects asset failure history, PM completion records, and inspection findings to give maintenance teams a measurable view of reliability progress — and the data to justify where to invest next.
Why Asset Reliability Growth Tracking Requires Structured Maintenance Records
Reliability growth is not a trend that reveals itself in utility meters or production dashboards — it appears in maintenance records: MTBF intervals lengthening, corrective work order frequency declining, PM completion rates holding above target. Facilities that Book a Demo with OxMaint see how work order history, inspection completion records, and failure interval tracking combine into a reliability growth picture that a maintenance manager can present in a weekly review without pulling data from three different systems. Tracking the right metrics consistently is what turns a reliability initiative into a documented improvement program rather than an activity the organization eventually abandons.
OxMaint calculates failure intervals from work order timestamps — tracking whether the time between failures on a specific asset is growing or shrinking over the improvement program period.
A declining corrective work order rate on a target asset is the most direct signal that reliability is improving. OxMaint tracks corrective WO frequency by asset over configurable time periods for trend comparison.
PM completion rate correlates with reliability improvement for most assets. OxMaint tracks PM compliance over time, enabling teams to validate whether improved PM discipline is producing measurable failure reduction.
Reliability growth programs that close deficiencies faster produce better asset performance. OxMaint tracks the rate at which inspection findings progress to closed corrective work orders — measuring follow-through as a reliability driver.
Effective root cause analysis reduces the same-fault recurrence rate on target assets. OxMaint tracks fault code recurrence per asset over time, making RCA effectiveness measurable through the work order history.
Declining maintenance cost per asset period over period is a financial validation of reliability growth. OxMaint tracks cumulative labor, parts, and contractor cost per asset — making cost trend reporting available without manual data extraction.
Key Asset Reliability Growth Metrics for Industrial Maintenance Programs
MTBF growth rate measures how the average interval between failures on a specific asset is changing over successive quarters — the most direct quantitative indicator of whether a reliability improvement program is working at the asset level. A 20% MTBF improvement over two quarters on a previously high-frequency failure asset confirms that PM changes, overhaul investment, or RCA actions produced the intended result. OxMaint calculates failure intervals from work order timestamps and tracks MTBF by asset over configurable periods, making quarterly MTBF comparison available without a separate reliability database. Facilities that Sign Up Free can begin tracking MTBF trend on target assets from existing work order history immediately.
A reliability-improving maintenance program shifts the work order mix from reactive correction toward planned prevention over time. Tracking the ratio of corrective to preventive work orders by asset class provides a portfolio-level view of whether the maintenance program is maturing toward a proactive posture. A program moving from a 70/30 corrective-preventive split toward 40/60 over 18 months is demonstrating structural reliability improvement — not just short-term failure reduction. OxMaint tracks work order type distribution by asset and period, enabling ratio trend analysis across the maintenance program. Teams that Book a Demo can see how OxMaint's work order type reporting supports maintenance mix trend analysis.
Sustained PM compliance above 90% is a precondition for reliability growth in PM-dependent improvement programs — and compliance below 75% over multiple quarters usually explains failure frequency that looks random but is actually driven by deferred maintenance accumulation. Tracking PM compliance rate quarterly by asset class shows whether the improvement program's execution discipline matches its design intent. OxMaint tracks PM scheduled versus completed by asset over time, making quarterly compliance trend analysis available in the standard reporting view. Facilities can Sign Up Free and track PM compliance trend on target assets from their first PM cycle in OxMaint.
If root cause analysis is producing durable corrective actions, the same fault codes should appear less frequently on the same asset over successive quarters. Repeat fault recurrence rate measures whether closed escalated failures are staying closed — validating whether investigation and corrective action work is actually eliminating the root cause or temporarily suppressing the symptom. A declining recurrence rate on previously escalated fault codes is the most direct validation that RCA actions are working. OxMaint tracks fault code recurrence per asset from work order history, making repeat fault trend analysis available without a separate reliability database.
Declining maintenance cost per asset per quarter is the financial validation of reliability growth — combining the labor savings from fewer corrective events, reduced emergency parts consumption, and lower contractor call-out frequency into a single trend that management can evaluate. Cost-per-asset trending also identifies reliability improvement programs that are reducing failure frequency but increasing PM labor spend in a way that offsets the savings. OxMaint tracks cumulative labor, parts, and contractor costs per asset over time, enabling quarter-over-quarter cost trend analysis that validates whether improvement investment is producing net maintenance cost reduction. Teams that Book a Demo can see how OxMaint cost tracking supports reliability program financial reporting.
Reliability programs that identify deficiencies through inspection but close them slowly accumulate deferred risk that eventually surfaces as a failure event. Inspection finding closure velocity — the average time from deficiency identification to confirmed corrective work order closure — measures how effectively the maintenance team is converting inspection intelligence into asset improvement. A closing velocity below 30 days for high-severity findings, sustained over multiple quarters, indicates an inspection program that is actually reducing asset risk rather than generating paper. OxMaint tracks finding-to-closure intervals per asset, making closure velocity trend analysis part of the standard reliability review. Facilities can Sign Up Free and begin tracking finding closure velocity from the first inspection cycle in OxMaint.
Asset Reliability Growth Metrics: Industrial Maintenance Reference
| Reliability Metric | Measurement Period | Growth Signal | OxMaint Data Source | Review Frequency |
|---|---|---|---|---|
| MTBF Growth Rate | Quarterly | Increasing QoQ | Failure interval from WO timestamps | Monthly |
| Corrective WO Rate | Monthly | Declining per asset | WO type frequency by asset | Weekly review |
| PM Compliance Rate | Quarterly | Sustained above 90% | PM schedule vs completion | Monthly |
| Repeat Fault Rate | Rolling 90 days | Declining per fault code | Fault code recurrence by asset | Monthly |
| Maintenance Cost per Asset | Quarterly | Declining QoQ | Cumulative cost per asset | Quarterly |
How OxMaint Supports Asset Reliability Growth Tracking
Reliability growth is invisible without the maintenance records to track it. OxMaint connects asset failure history, PM compliance records, inspection findings, and cost data into a single asset timeline — giving reliability engineers and maintenance managers the structured data to confirm that improvement actions are producing results before the next capital planning cycle. When OxMaint shows MTBF growing on a previously high-frequency failure asset, PM compliance holding above 90%, and same-fault recurrence declining after RCA closure, that is the evidence base that justifies continued investment in the reliability program — and identifies where to direct the next improvement intervention. Facilities can Sign Up Free and begin building the asset reliability growth record from their first work order cycle in OxMaint.
Building an Asset Reliability Growth Tracking Program: Implementation Steps
Select Target Assets for Growth Tracking
Identify the 10–20 assets with the highest corrective work order frequency or lowest MTBF in OxMaint — these are the reliability growth targets where improvement actions will produce the largest operational impact.
Establish Baseline Metrics for Each Asset
Calculate baseline MTBF, corrective WO rate, PM compliance rate, and maintenance cost per period for each target asset in OxMaint — setting the reference points against which improvement progress will be measured.
Define Improvement Actions per Asset
Document the specific PM changes, RCA actions, or inspection schedule modifications applied to each target asset in OxMaint — creating the intervention record that connects maintenance actions to subsequent reliability metric changes.
Review Reliability Metrics Monthly per Asset
Schedule monthly reviews of MTBF trend, corrective WO rate, and PM compliance for each target asset in OxMaint — identifying early whether improvement actions are producing the expected metric movement or require adjustment.
Validate Financial Impact Quarterly
Compare maintenance cost per asset in OxMaint quarterly against the baseline — validating that reliability improvement is producing net cost reduction and calculating the ROI of improvement program investment per asset.
Expand Program Based on Results
Use OxMaint's cross-asset reliability reporting to identify which improvement approaches produced the strongest MTBF growth on initial target assets — then apply those same interventions to the next tier of high-failure assets. Book a Demo to see the full reliability growth reporting workflow.
Frequently Asked Questions
What is asset reliability growth tracking in maintenance management?
It is the structured measurement of reliability improvement over time using MTBF trend, corrective work order rate, PM compliance, and maintenance cost per period — validating whether specific maintenance actions are producing measurable uptime and cost improvement at the asset level.
How does OxMaint support reliability growth measurement?
OxMaint calculates MTBF from work order timestamps, tracks PM compliance rates, and monitors fault code recurrence per asset — providing the reliability growth metrics in a single platform without requiring a separate reliability database or manual data aggregation.
How long before reliability improvement actions show measurable MTBF growth?
For assets with monthly failure frequency, MTBF changes become measurable within two to three quarters of sustained PM compliance and RCA closure. Assets with longer baseline failure intervals may require six months before trend direction is statistically clear.
What is the difference between reliability growth tracking and standard maintenance KPIs?
Standard KPIs measure current-period performance — PM compliance this month, corrective WOs this week. Reliability growth tracking compares those metrics over successive periods on the same assets to confirm that improvement actions are producing a directional trend, not just point-in-time results.
Can OxMaint track reliability growth across a fleet of similar assets?
Yes. OxMaint's multi-asset reporting compares MTBF, corrective WO rate, and PM compliance across asset classes — enabling reliability programs to benchmark similar assets against each other and identify which units are lagging the fleet reliability average for prioritized intervention.
Turn Maintenance Actions into Measurable Reliability Progress
OxMaint gives industrial teams the failure history, PM compliance records, and cross-asset reporting to track asset reliability growth over time — and prove to management that improvement investments are producing real uptime and cost results.