Downtime Pareto analysis gives plant maintenance leaders a data-driven method to stop treating every equipment failure as equally urgent — and start concentrating repair resources on the 20 percent of failure causes responsible for 80 percent of total lost production time. Without structured analysis, maintenance teams remain reactive, cycling through the same recurring failures while high-impact root causes go unresolved. With Sign Up Free on Oxmaint, maintenance leaders can build Pareto-driven downtime reduction programs backed by automated work order data, asset failure histories, and real-time KPI dashboards across every production line.
Why Downtime Pareto Analysis Is a Core Plant Maintenance Practice
Equipment downtime is rarely evenly distributed. In most manufacturing environments, a small number of asset categories, failure modes, or production lines generate the majority of total unplanned downtime hours. Without a systematic method to quantify and rank these causes, maintenance planning defaults to the loudest complaint rather than the highest-impact problem. A structured Pareto analysis applied to CMMS work order data reveals which downtime causes are consuming the most productive capacity — giving maintenance leaders a defensible, data-backed prioritization framework for corrective action investment. Book a Demo to see how Oxmaint's analytics engine supports ongoing Pareto reporting for multi-line manufacturing plants.
How to Conduct a Downtime Pareto Analysis in Manufacturing
A reliable Pareto analysis requires consistent downtime data capture, standardized failure classification, and a reporting cadence that surfaces trends before they compound into major reliability problems. The quality of your analysis is directly determined by the discipline of your work order data entry — making CMMS configuration and technician training foundational requirements. Sign Up Free to configure Oxmaint's downtime classification taxonomy and begin capturing structured failure data from day one.
Standardize failure mode codes across all assets and production lines before data collection begins. Categories should cover mechanical failure, electrical fault, process upset, operator error, planned maintenance, and waiting-for-parts delays. Oxmaint allows custom failure code taxonomies mapped to asset types — ensuring consistent classification regardless of which technician closes the work order.
Every unplanned stoppage should generate a work order in Oxmaint with start time, end time, asset ID, failure code, and repair action documented before closure. This structured capture is the raw data source for all subsequent Pareto analysis — making work order completion discipline a direct investment in future decision quality.
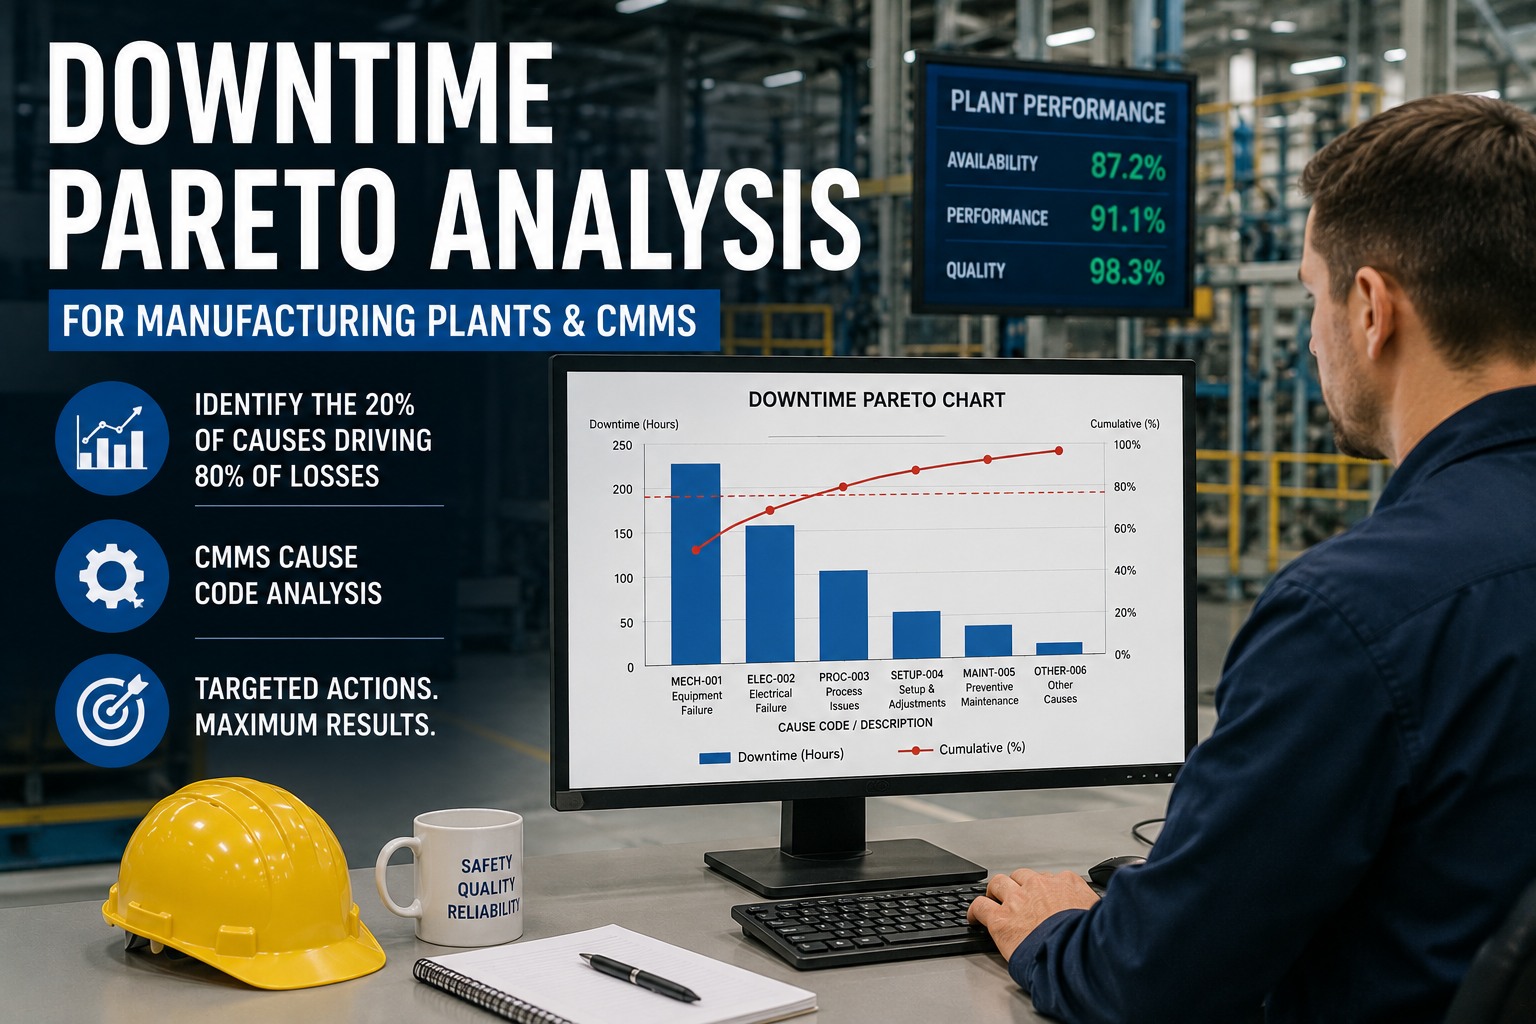
Pull total downtime hours by failure code across a defined analysis period — typically 90 days for initial analysis, then monthly rolling. Sort causes from highest to lowest cumulative impact. Oxmaint's analytics dashboard generates this ranked view automatically, with drill-down by asset, line, shift, or department to isolate concentration patterns.
Focus corrective action on the top three to five failure causes that represent the majority of cumulative downtime. For each, document root cause, frequency, average duration, and the corrective action required. Oxmaint allows corrective work orders to be linked directly to the originating failure pattern — creating a traceable chain from analysis to resolution.
Downtime Pareto Analysis: Failure Category Reference
Understanding which failure categories typically dominate Pareto charts in manufacturing environments helps maintenance leaders pre-configure their classification systems and set realistic reduction targets. Book a Demo to see how Oxmaint's failure taxonomy maps to your production environment.
| Failure Category | Typical Downtime Share | Common Assets Affected | Primary Root Causes | Oxmaint Action |
|---|---|---|---|---|
| Mechanical Failure | 35–45% | Conveyors, presses, pumps | Wear, misalignment, lubrication gaps | PM schedule optimization |
| Electrical / Controls | 20–30% | Drives, sensors, PLCs | Environmental exposure, age, vibration | Condition monitoring alerts |
| Waiting for Parts | 10–20% | All critical assets | Inadequate stocking, slow procurement | Min/max inventory alerts |
| Operator-Induced | 8–15% | CNC machines, packaging lines | Setup errors, incorrect parameters | SOP checklist enforcement |
| Process / Quality Upset | 5–12% | Mixing, filling, coating assets | Material variation, environmental shifts | Cross-linked quality work orders |
Building a Continuous Downtime Pareto Program with Oxmaint CMMS
Configure Asset Registry and Failure Code Taxonomy
Register all production assets in Oxmaint with asset type, line assignment, and criticality tier. Map failure codes to asset categories so technicians see only relevant options when closing work orders. A well-structured taxonomy is the single most important factor in producing actionable Pareto reports — and it takes less than a day to configure in Oxmaint.
Enforce Work Order Closure Discipline
Configure Oxmaint to require failure code, downtime duration, and repair action fields before any corrective work order can be closed. This enforcement step converts the CMMS from a task tracker into a structured failure database — the foundation of every Pareto report generated downstream.
Run Monthly Pareto Reviews with Cross-Functional Teams
Schedule monthly Pareto review sessions using Oxmaint's analytics exports. Present top downtime causes to maintenance, engineering, and operations leaders together — ensuring that corrective actions receive the cross-functional support needed for root cause elimination rather than temporary repair. Oxmaint dashboards can be shared with stakeholders who don't hold active platform licenses.
Link Corrective Work Orders to Pareto Root Causes
For each top-ranked failure cause, create a corrective action work order in Oxmaint that references the originating Pareto finding. Assign ownership, target completion date, and expected downtime reduction outcome. This linkage allows progress tracking against each identified root cause — and demonstrates ROI on corrective investment in subsequent Pareto cycles.
Track Pareto Shift Over Time to Confirm Improvement
A successful corrective action program changes the shape of the Pareto chart over successive analysis periods — previously dominant failure causes drop in rank as root causes are eliminated. Oxmaint's trend analytics let maintenance leaders visualize this shift quarter-over-quarter, providing the concrete evidence needed to sustain program investment and expand scope to secondary failure causes.
Downtime Pareto KPIs to Track in Your CMMS
The right KPIs convert a one-time Pareto exercise into a continuous improvement engine — measuring whether corrective actions are reducing the failure causes they targeted and revealing new concentration patterns as prior issues are resolved. Sign Up Free to access Oxmaint's live downtime analytics dashboards pre-configured for manufacturing plants.
Tracks cumulative downtime hours attributed to the top-ranked failure cause identified in the last Pareto analysis. Declining trend confirms that corrective actions are taking effect at the root cause level.
The percentage of total downtime hours accounted for by the top three failure causes. A ratio above 70% indicates high concentration — meaning targeted corrective action on just three causes will capture the majority of available improvement opportunity.
Measures the percentage of corrective work orders closed with a failure code assigned. Rates below 90% indicate data quality gaps that will distort Pareto rankings and produce misleading prioritization.
MTBF improvement on assets targeted by Pareto-driven corrective actions provides direct confirmation that root cause elimination is extending reliable operating intervals — the ultimate outcome of a downtime reduction program.
Tracks the percentage of Pareto-linked corrective work orders completed by their target date. Low closure rates signal resource constraints or scope misalignment — both of which require management attention before the next Pareto cycle.
High recurrence within a specific failure code after corrective action completion signals that the root cause was not fully addressed — triggering escalation to engineering review and deeper failure analysis before the next Pareto cycle.