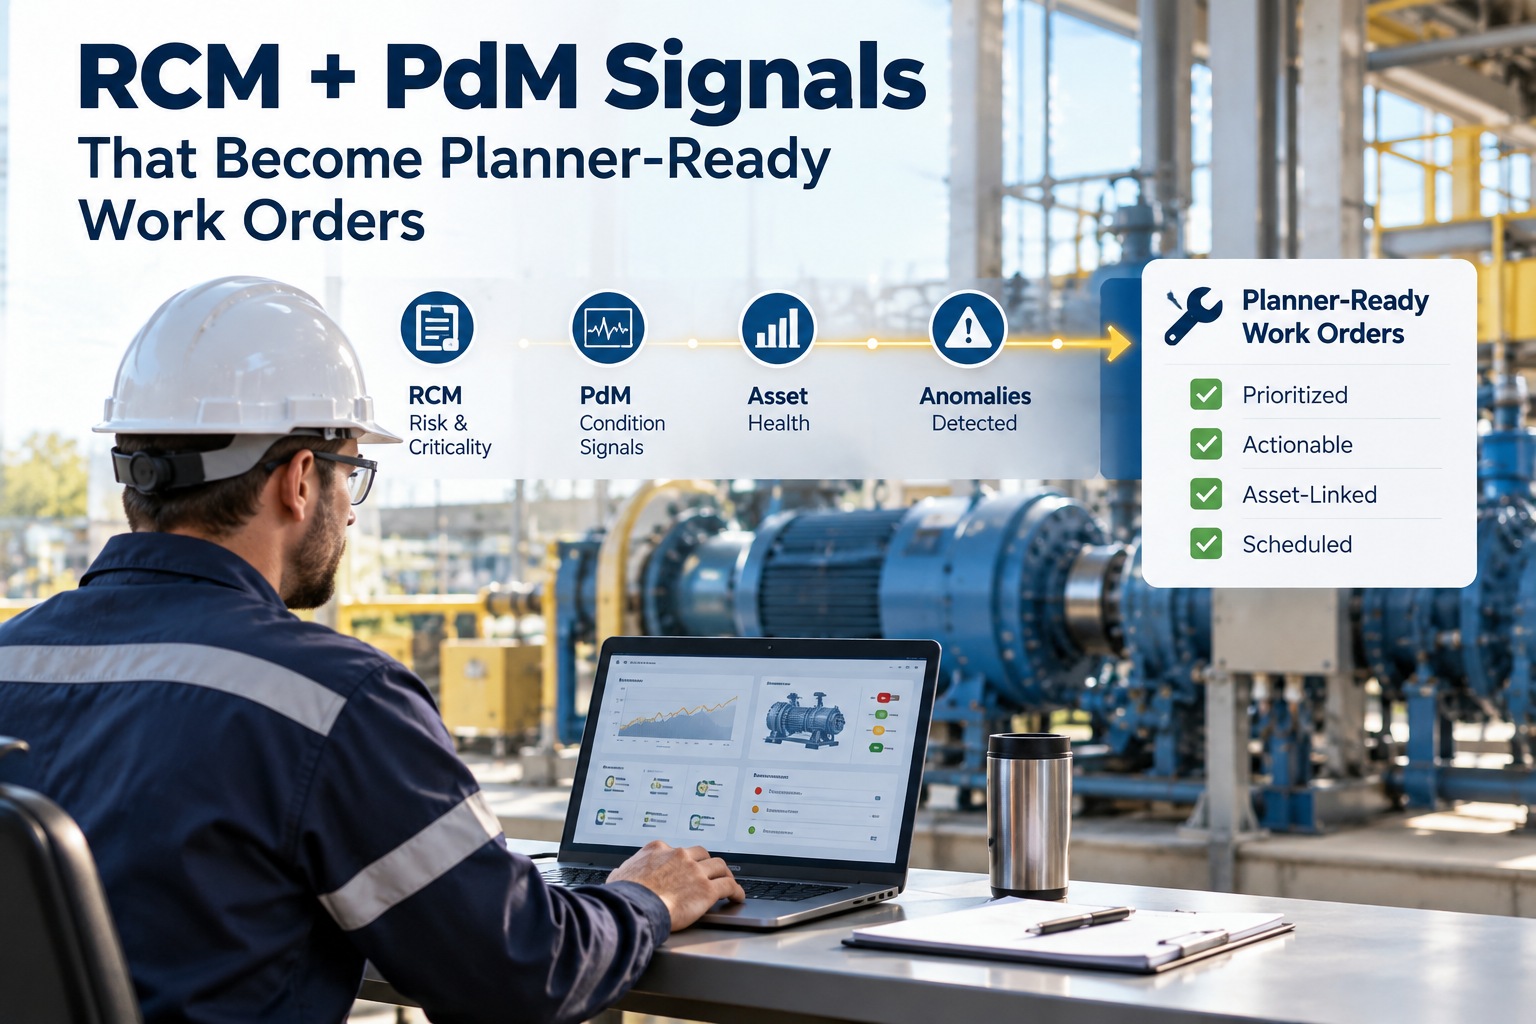
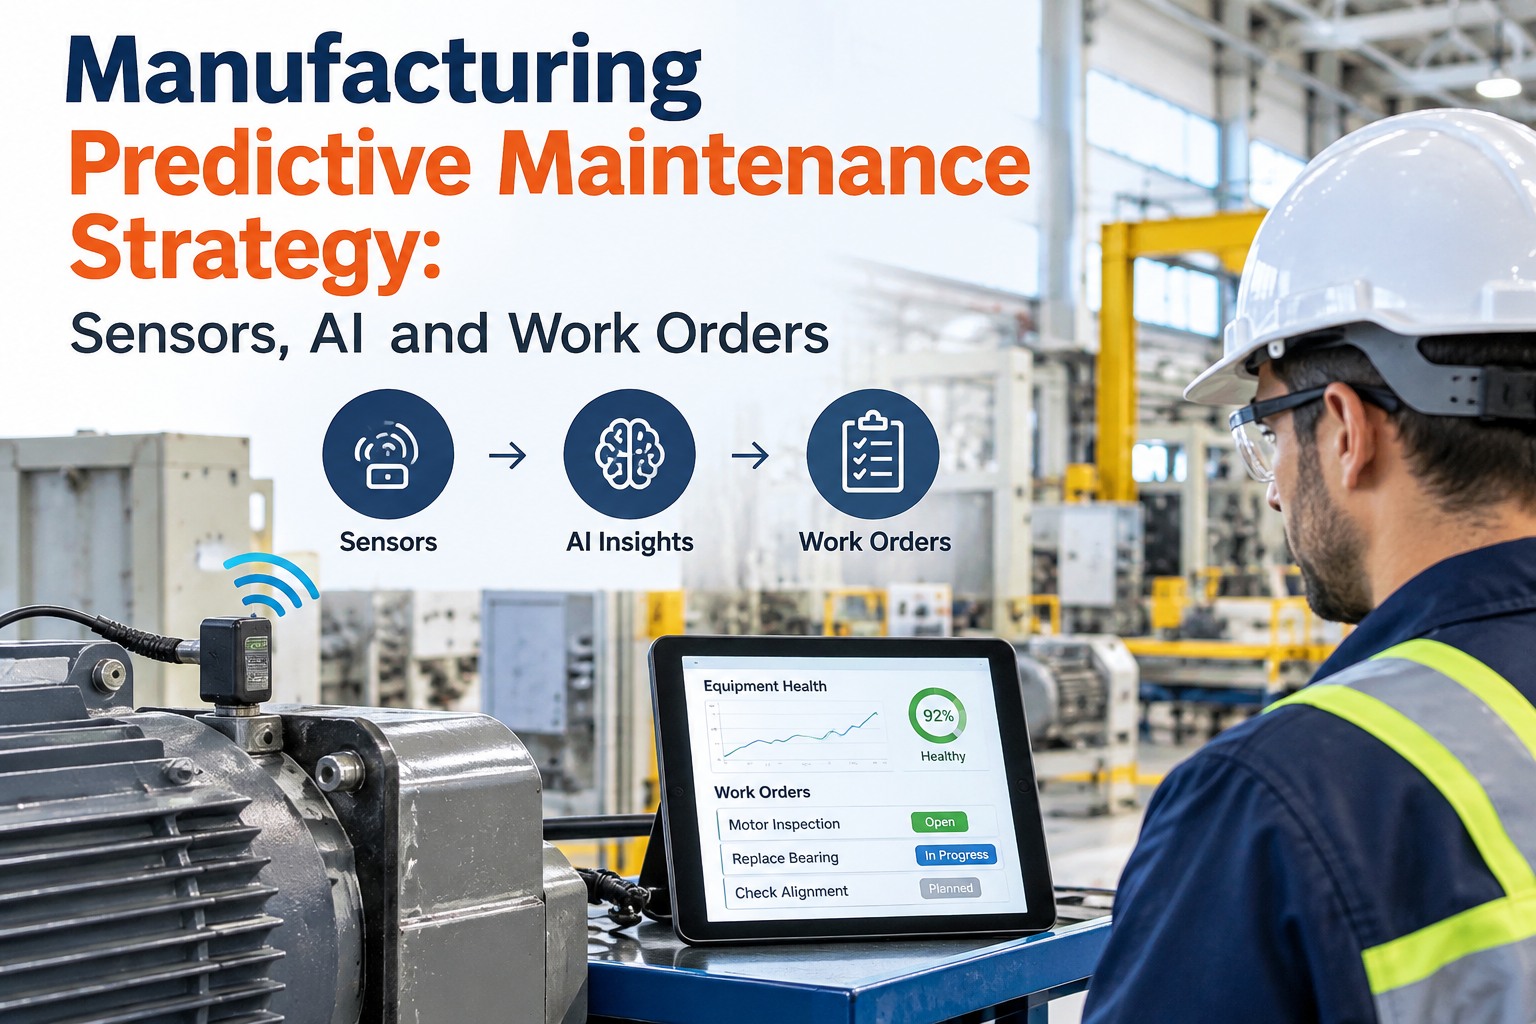
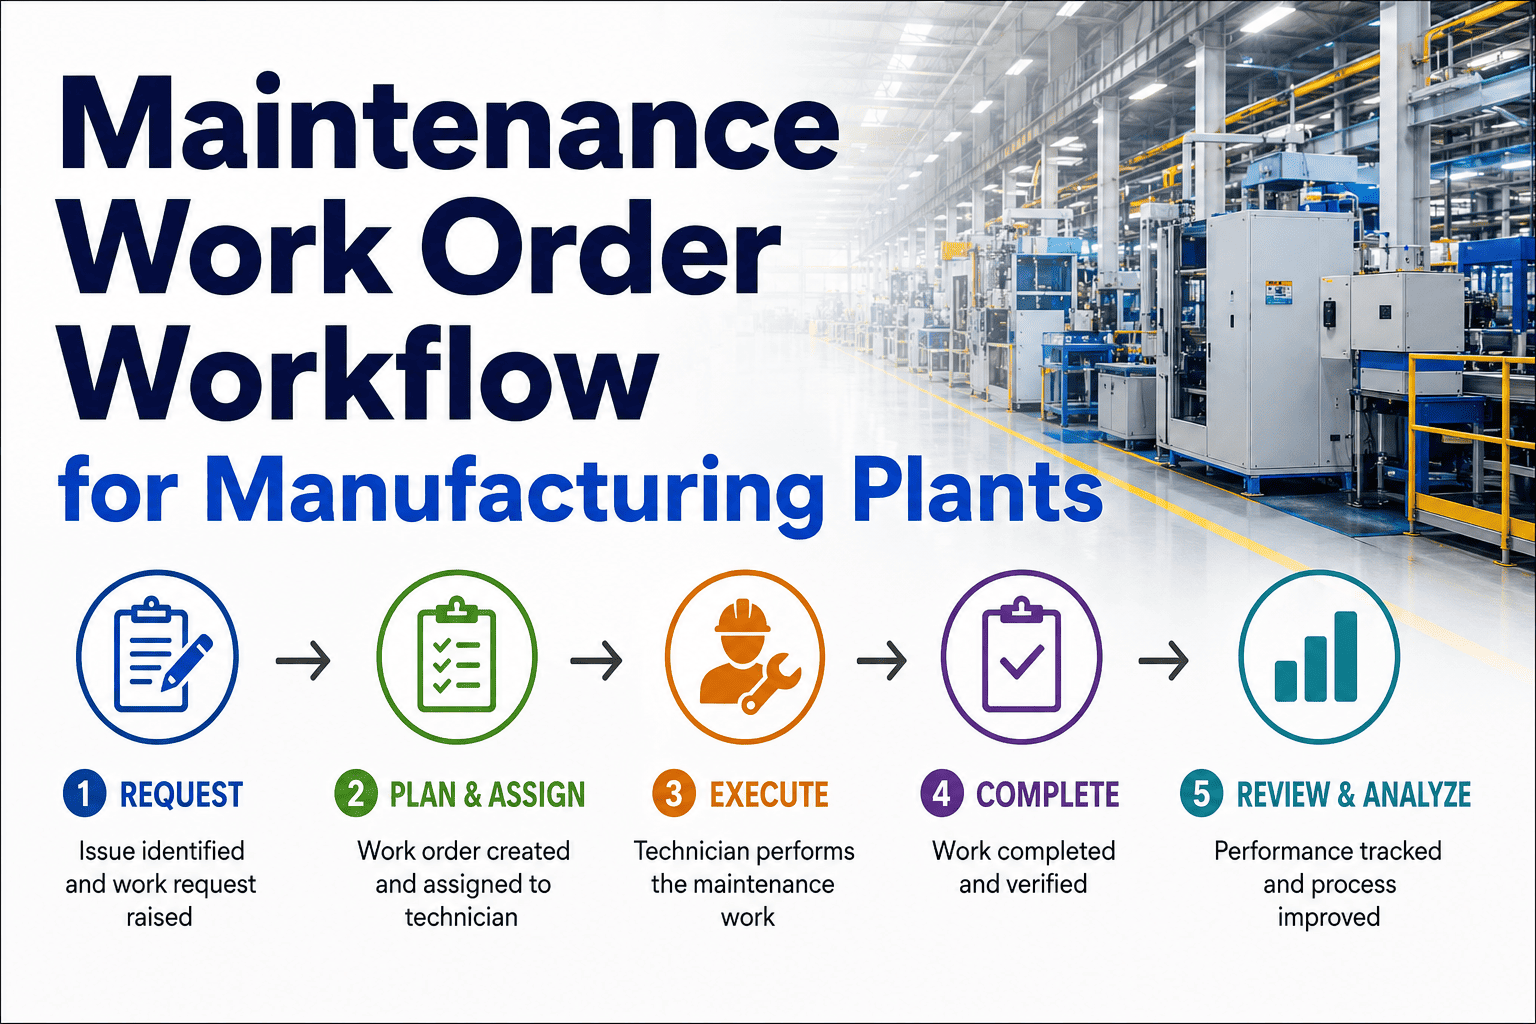
A creeping vibration on a critical bearing is broadcast into open air every second of every shift. In most plants it dies there — captured by a sensor, logged to a historian, and forgotten. In a plant with a working predictive maintenance pipeline, that same signal travels through six specific technical stages and lands as a scheduled work order in SAP PM before the bearing fails. The gap between those two outcomes isn't sensor cost — modern accelerometers are cheap. It's whether the operator has closed the loop from raw signal through edge processing, transport, storage, AI inference, and finally into the enterprise work-order system where a technician actually sees the task on Monday morning. McKinsey projects up to $360B in annual savings from predictive maintenance by end of 2025, and downtime already costs manufacturers roughly $50B a year. The math is unambiguous. What's missing in most plants is not intent — it's the working pipeline. This guide walks the full sensor-to-SAP workflow, stage by stage, with the technology decisions that make or break it. Book a free demo to see the pipeline running end-to-end.
$50B
Annual cost of unplanned downtime to global manufacturers
$360B
McKinsey-projected annual predictive maintenance savings by end of 2025
30–50%
Unplanned downtime reduction reported after full PdM pipeline deployment
20–40%
Equipment life extension typical from condition-based intervention
The Six-Stage Pipeline · What Data Actually Traverses
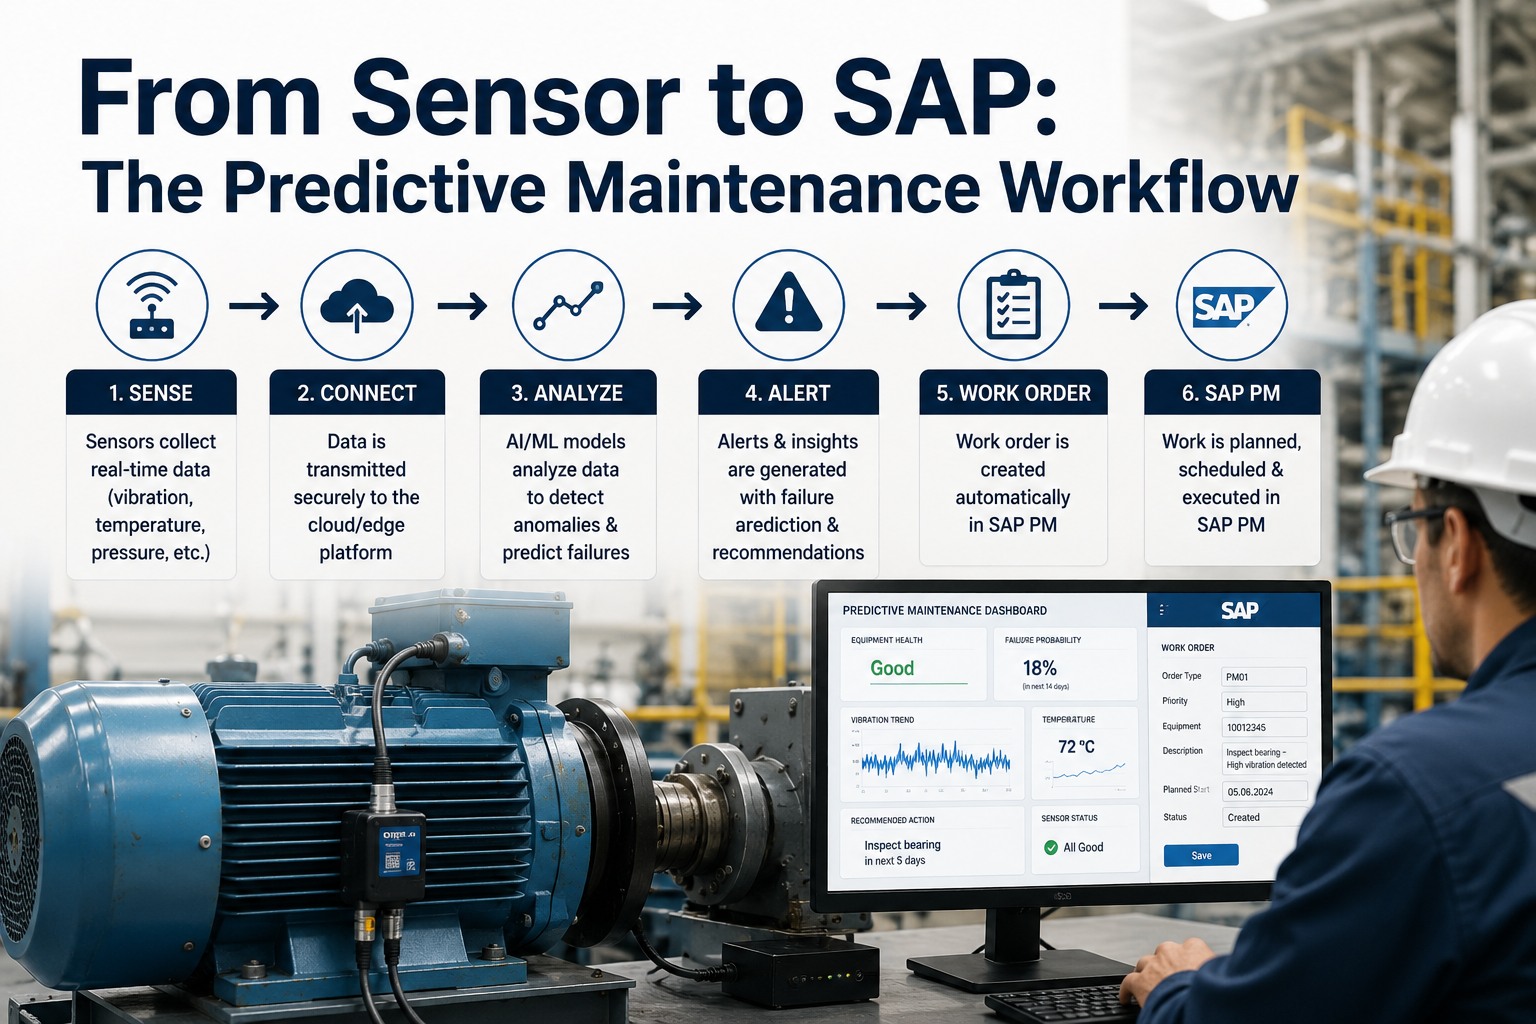
A production-grade predictive maintenance pipeline decomposes into six sequential stages. Every stage has a specific technology requirement, a data quality checkpoint, and a security boundary. Skip any stage and the pipeline degrades to a dashboard nobody acts on — which is why standalone vibration analysis tools fail as PdM programs and why AI-first integrated platforms displace them.
01
Sensor & Signal Acquisition
MEMS accelerometers · bearing RTDs · motor current transducers · PLC/SCADA registers
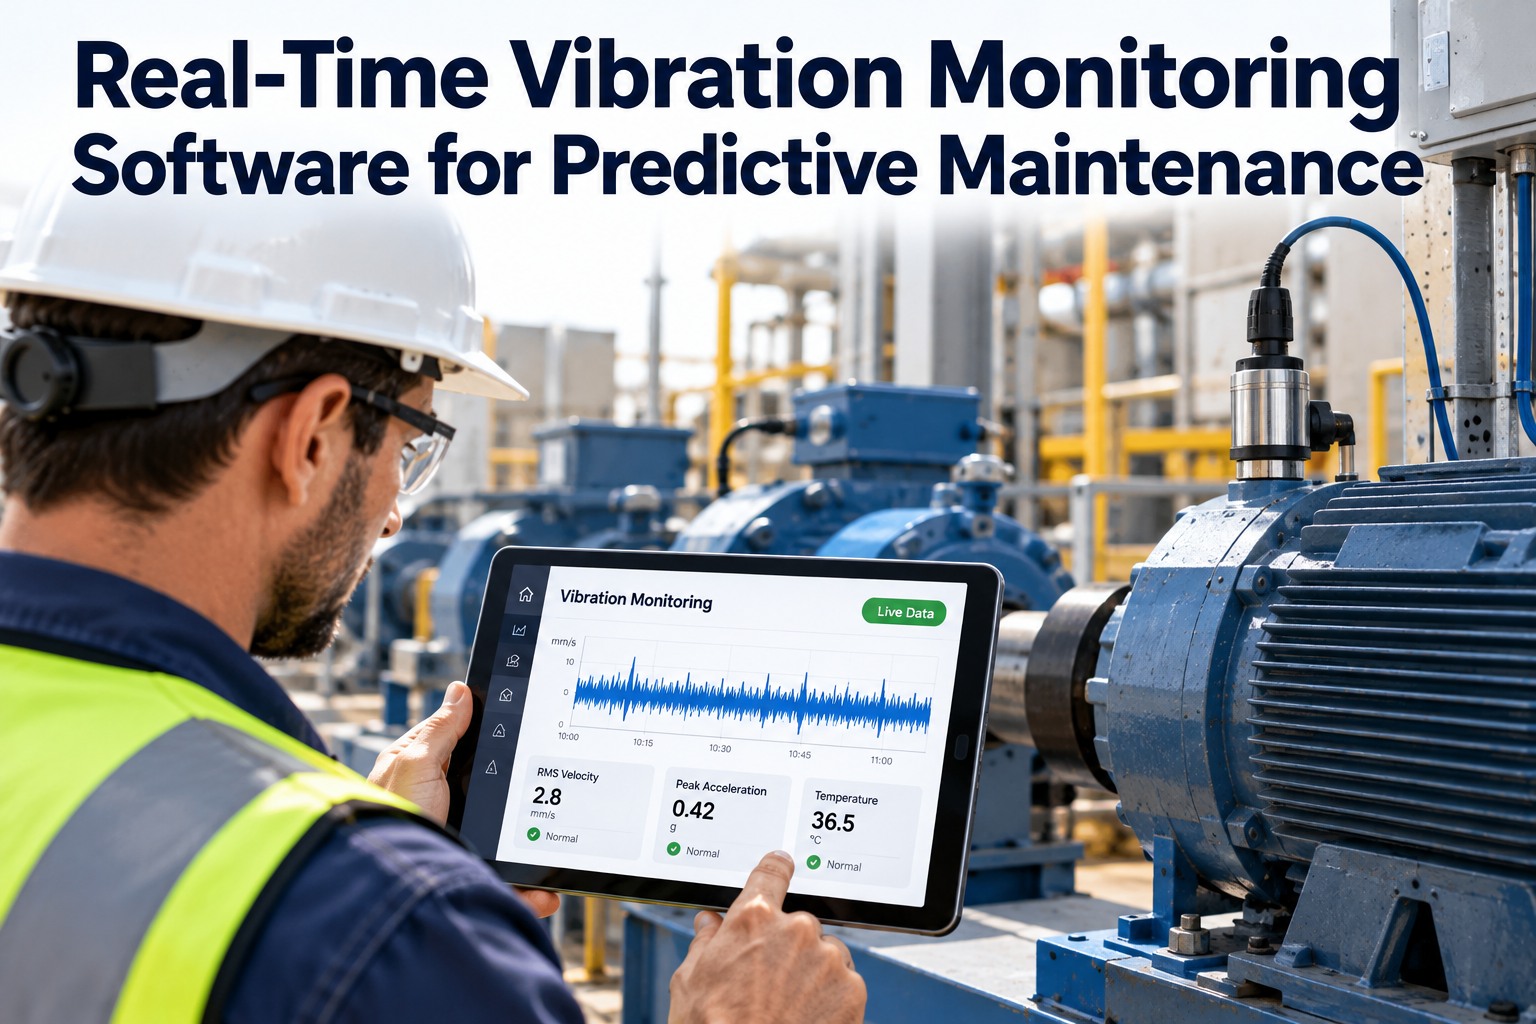
Physical measurement at native rate — vibration at 10–50 kHz for spectral analysis, temperature at seconds, current at sub-second sampling, pressure per process need. Data enters the pipeline as raw industrial signal.
02
Edge Processing & Protocol Translation
Edge gateway · OPC UA · MQTT Sparkplug B · Modbus TCP/RTU · Profinet · REST
Raw high-volume data filtered at the edge before hitting the network — noise removed, low-pass and band-pass filters applied, industrial protocols translated into low-latency structured streams the cloud can ingest.
03
Transport & Ingest
MQTT broker · Kafka streams · HTTPS · TLS-encrypted channels
Preprocessed streams cross the OT/IT boundary into cloud infrastructure. Publish/subscribe pattern preserves temporal ordering. Backpressure handling prevents loss during network hiccups. Provenance metadata attached at every hop.
04
Storage & Time-Series Alignment
Time-series database · asset-linked schema · retention policy per stream
Data lands in a time-series store indexed by asset ID and timestamp. Temporal alignment across streams of different sampling rates. Hot storage for last 30-90 days, cold storage for long-tail training data. Every reading queryable by asset, sensor, and time window.
05
AI Inference & Anomaly Detection
Trained ML models · pattern recognition · remaining useful life (RUL) estimation
Models trained on signal-plus-failure history detect deviations from normal. Fault classification (unbalance, misalignment, bearing wear, cavitation). RUL forecasts inform intervention timing. Confidence scores gate whether prediction fires an action or a review.
06
SAP PM Work Order Creation
BAPI · RFC · OData V4 · REST · standard SAP interfaces
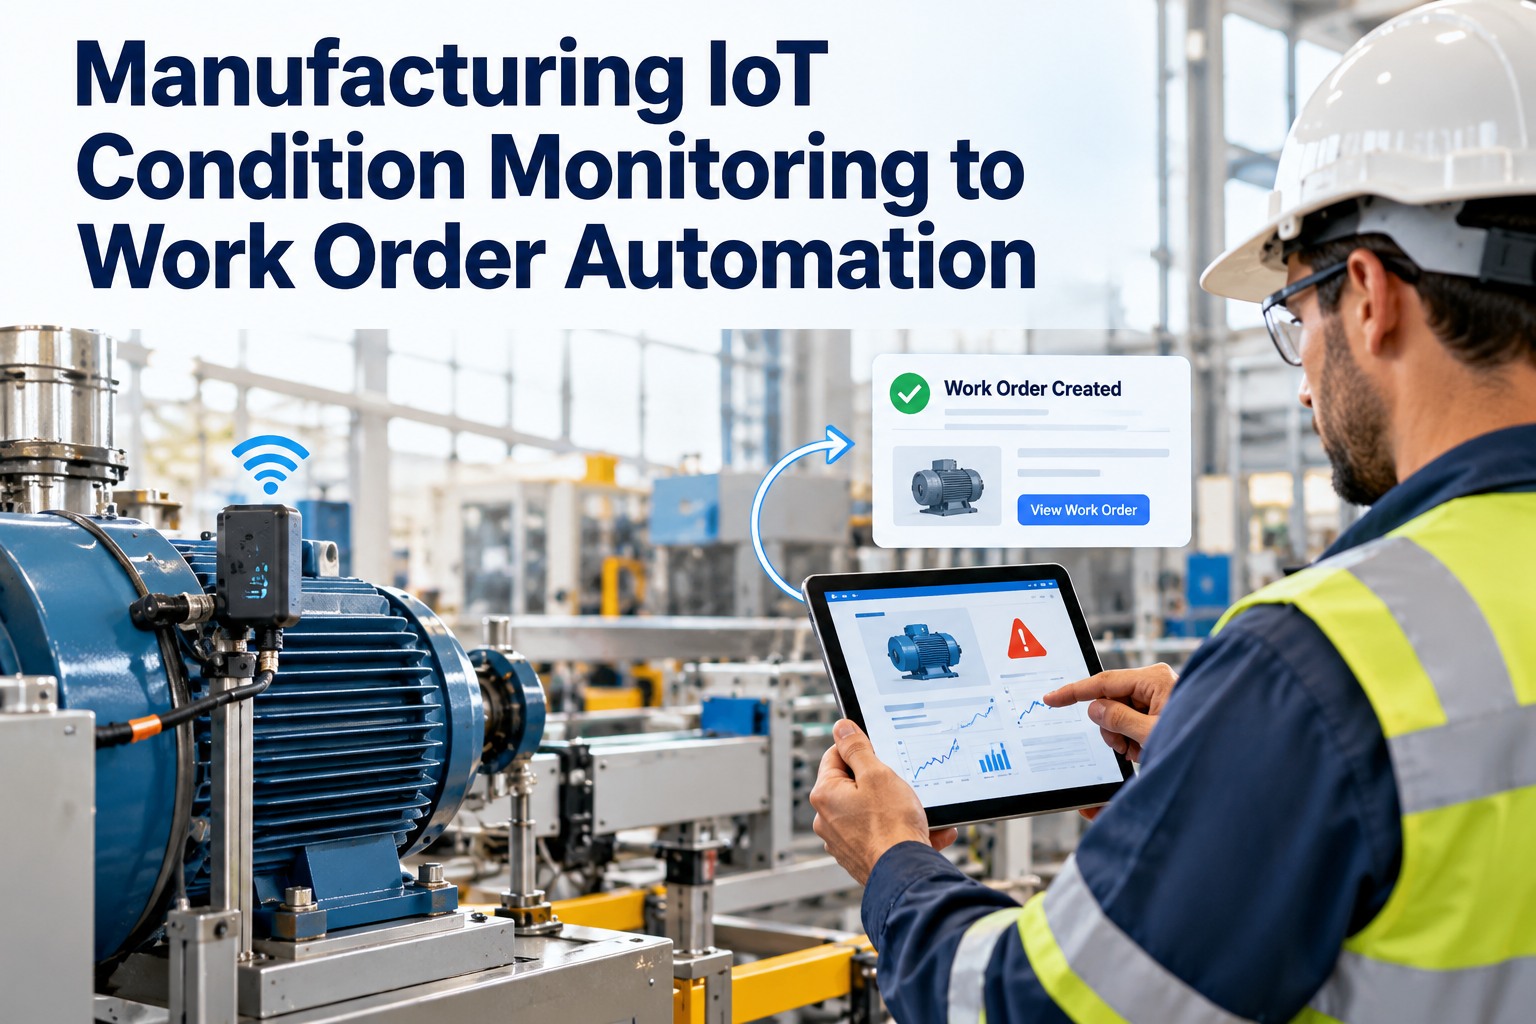
Predicted failure auto-creates a Maintenance Notification in SAP PM · enriched with fault type, severity, RUL, sensor data reference. Notification triggers Maintenance Order with priority, parts reservation, and schedule. Technician sees it on mobile within minutes.
The Data Type Reality · What Different Streams Actually Look Like
"Sensor data" is not one thing. A well-architected pipeline handles four fundamentally different data classes with different sampling rates, storage strategies, and analytic techniques. Confusing them at design time is the most common architectural mistake in early PdM deployments.
Stream Type
Native Rate
Storage Strategy
Analytic Approach
Vibration spectra
10–50 kHz
Windowed FFT · features stored, raw retained short-term
Spectral analysis · envelope · pattern matching
Process variables
Sub-second
Time-series compressed · full retention
Statistical bounds · multivariate trending
SCADA historian
Multi-second
Continuous archive · long retention
Physics-based models · digital twin comparison
Human-entered logs
Event-driven
Structured record store
Correlation with sensor anomalies · ML label source
The Vibration Journey · A Worked Example
Follow a single anomaly through the pipeline. This is the actual sequence a bearing outer-race defect on a critical pump goes through, from first faint spectral signature to a technician's phone. Every step below happens automatically in a working pipeline.
Day 0
SENSOR
MEMS accelerometer on pump P-14 outboard bearing samples at 25 kHz · faint spectral peak at bearing outer-race defect frequency (BPFO)
Day 0
EDGE
Edge gateway computes envelope spectrum · applies band-pass filter · publishes feature vector every 60 seconds via MQTT Sparkplug B
Day 0
STORAGE
Feature vector persisted to time-series DB · indexed by asset ID P-14 and timestamp · aligned with process temperature and motor current streams
Day 14
AI INFERENCE
ML model flags rising BPFO amplitude · confidence 87% for outer-race defect · RUL estimate 21–35 days · anomaly written to platform
Day 14
SAP PM CREATE
Notification created in SAP PM via BAPI · Order M2 · fault type "bearing outer race" · priority P2 · parts reservation triggered for bearing kit · target date Day 25
Day 14
MOBILE
Millwright receives WO on phone · sensor reference, spectral plot attached · parts ready in kit form · scheduled for planned shutdown window
Day 25
EXECUTION
Bearing replaced during scheduled 90-minute planned outage · post-repair vibration verified normal · WO closed with photo evidence and readings
Day 25
FEEDBACK
Closeout data flows back into ML training loop · model accuracy score updated · RUL prediction validated against actual failure timing
Outcome: Bearing replaced in planned 90-min window instead of catastrophic unplanned outage on Day 35 · estimated saving: 18-hour production loss avoided
The Protocol Layer · What Actually Sits Between Sensor and Cloud
Industrial signals arrive in the format of the equipment that generated them. A modern PdM pipeline speaks every relevant protocol natively at the edge, translates to a common transport format, and hands clean structured data up to the platform. The four protocols below account for the overwhelming majority of production deployments in 2026.
PROTO 1
OPC UA
Industry-standard secure machine-to-machine communication · unified address space · rich data model · TLS-encrypted by default
Modern PLCs · industrial IoT · greenfield deployments
PROTO 2
MQTT Sparkplug B
Lightweight publish/subscribe optimized for industrial telemetry · session state · birth/death certificates · fits low-bandwidth networks
Wireless sensor networks · edge gateway to cloud · remote sites
PROTO 3
Modbus TCP / RTU
Legacy but universal · register-based reads · minimal overhead · still the most common protocol in installed base
Legacy PLCs · brownfield deployments · older sensor gateways
PROTO 4
Profinet · EtherNet/IP
Real-time industrial Ethernet · deterministic timing · sub-millisecond latency for control loops · widely deployed on major PLC platforms
Discrete manufacturing · high-speed lines · Siemens and Rockwell landscapes
See the Full Pipeline Running on Your Assets
30-minute technical walkthrough — bring your PLC and sensor landscape, we'll show the sensor-to-SAP workflow running end-to-end with your specific protocols. Zero rip-and-replace, layered on your existing SAP PM instance.
What Populates the SAP PM Work Order
An AI-generated work order isn't valuable unless it lands in SAP PM enriched enough that the planner or technician can act on it immediately. The field-level payload below is what a production-grade pipeline delivers on every predictive fire — no manual re-entry required, everything the technician needs to plan the intervention.
Asset Identification
Equipment number · from asset master
Functional location · plant hierarchy
Work center · maintenance responsibility
Cost center · financial routing
Fault Description
Fault type · classified by AI model
Severity · high/medium/low from confidence + RUL
Detection method · sensor type & source
First-observed timestamp
Sensor Evidence
Feature values crossing threshold
Spectral plot attachment (vibration)
Trend chart 30-day retrospective
Sensor tag ID for follow-up query
Intervention Plan
Recommended action · from FMEA library
RUL estimate · action-by date
Parts reservation · BOM lookup
Estimated labor hours & skills required
Common Pipeline Failure Modes · What Breaks First
Most PdM pipeline failures aren't dramatic collapses — they're silent degradations that erode trust in the system over months. Recognize the failure modes below early and the pipeline stays operational; miss them and technicians eventually stop trusting the predictions and revert to reactive maintenance.
01
Dashboard Without Work Orders
The pipeline surfaces anomalies to a screen but never creates work orders in SAP · engineers see it, planners don't, nothing happens
02
Alert Fatigue From False Positives
Poorly tuned models fire too often · technicians dismiss alerts by default · genuine predictions get lost in the noise
03
One-Way Data Flow · No Feedback Loop
Pipeline pushes predictions but never ingests closeout data · models never learn from outcomes · accuracy stagnates and drifts
04
SAP Authorization Bypass
AI-generated WOs bypass standard SAP approval workflows · compliance and audit gaps open · governance rejects the system
05
Protocol Fragmentation at the Edge
Three PLC brands, four historians, no unified edge translation · integration project becomes multi-year systems-integrator engagement
06
Time-Series Storage Without Provenance
Data lands in a warehouse without source metadata · queries can't tie readings to specific sensor · model retraining becomes impossible
Expert Perspective · Why Most PdM Programs Die and How Successful Ones Survive
The predictive maintenance programs that die usually die the same way. Somebody buys sensors, they install them on twenty critical assets, the sensors work perfectly, data streams to a dashboard nobody looks at, and eighteen months later the project quietly gets absorbed back into reactive maintenance. The pipeline was 80% built — the missing 20% was the connection into the enterprise work-order system where technicians actually work. Programs that survive close that last mile. The predictive anomaly becomes a real SAP PM work order with real parts reserved and a real technician assigned. The technician sees it on their phone the same way they see any other WO. They act on it. They close it out with data. And that closeout flows back into the model training loop so the next prediction is better than the last one. That closed loop is the entire game. Everything upstream — the sensors, the edge gateway, the ML model — is enabling technology. The value transfers at the point where the prediction becomes a work order and the work order becomes an action. Manufacturers who build for that end state deliver the 30–50% downtime reduction the vendor decks promise. Manufacturers who stop at the dashboard don't.
Close the Loop to SAP
Prediction that doesn't become a work order is a demo, not a program. The BAPI/RFC/OData connection to SAP PM is the value transfer point.
Feedback Trains the Next Prediction
Closeout data has to flow back to the model. Without that loop, prediction accuracy stagnates and technicians eventually stop trusting the system.
Respect the SAP Governance
AI-generated WOs follow the same approval flow as manual ones. Bypassing SAP's role-based access controls kills the program at governance review.
How OxMaint Runs the Full Sensor-to-SAP Pipeline
OxMaint operates every stage of the pipeline as a single integrated cloud-native workflow — from edge protocol translation to SAP PM work order creation. No systems-integrator project, no multi-vendor middleware stack, no bespoke ABAP.
Ingest
Native Multi-Protocol Support
OPC UA · MQTT Sparkplug B · Modbus TCP/RTU · Profinet · REST · CSV upload — every industrial protocol landing on the same pipeline
Store
Time-Series with Asset Provenance
Every reading indexed by asset, sensor, and timestamp · retention policy per stream · queryable by any facet · always tied to source
Infer
ML Anomaly Detection & RUL
Trained models detect fault signatures · classify by failure mode · estimate remaining useful life · confidence-scored predictions
Route
SAP PM Auto Work Order
BAPI/RFC/OData push to SAP PM · enriched notification with fault, severity, RUL, sensor evidence · standard approval workflow respected
Mobile
Technician Execution Surface
WO on phone within minutes · spectral plot and sensor reference attached · offline sync for airside/plant dead zones
Learn
Closed-Loop Model Feedback
Closeout data pushes back into training pipeline · prediction accuracy validated against actual failure · models tune continuously
Close the Loop From Sensor to Technician
Stop letting predictions die on dashboards. See how OxMaint runs the full pipeline — sensor ingest, ML inference, SAP PM work order creation, mobile execution, model feedback — as one cloud-native workflow. Free forever plan available to trial the workflow.
Frequently Asked Questions
How does raw sensor data actually become a SAP PM work order?
Through a six-stage pipeline: sensors capture the physical signal at native rate (vibration at 10–50 kHz, temperature/current at sub-second), edge gateway filters and translates industrial protocols like OPC UA, MQTT Sparkplug B, or Modbus TCP into clean streams, transport layer moves data across the OT/IT boundary, time-series storage indexes by asset and timestamp, ML models detect anomalies and estimate remaining useful life, and finally BAPI/RFC/OData interfaces auto-create an enriched Maintenance Notification in SAP PM. The technician sees the resulting work order on their phone within minutes of the prediction firing.
Does the pipeline require replacing our existing SAP PM configuration?
No. Modern PdM pipelines integrate through SAP's standard interface layer — BAPIs, RFC function modules, OData V4 APIs, or IDocs — none of which require custom ABAP code or Basis transport changes. SAP PM remains the enterprise system of record for asset masters, financial postings, and procurement. The OxMaint pipeline handles sensor ingest, ML inference, and mobile execution, then pushes enriched work orders back into SAP through the standard interface layer. AI-generated WOs follow the same approval and authorization workflows as manually created orders.
Sign up free to see the SAP-native integration.
What ROI can we expect from a full sensor-to-SAP predictive pipeline?
Manufacturers deploying full closed-loop pipelines typically report 30–50% reduction in unplanned downtime and 20–40% equipment life extension for assets under predictive coverage. McKinsey projected up to $360B in annual global predictive maintenance savings by end of 2025, and downtime already costs manufacturers roughly $50B annually — the ROI math is dominated by avoided unplanned outages, which typically cost 3–10× the value of a planned intervention on the same asset. Payback on sensor and platform investment is typically 6–18 months on critical assets.
Book a free demo to model your ROI.
Why do most predictive maintenance pilots fail to scale beyond the pilot phase?
The most common failure mode is a broken last mile: the pipeline surfaces anomalies to a dashboard but never creates work orders in SAP PM. Engineers see the predictions, planners don't, and technicians never act on them. Other common failures are alert fatigue from poorly tuned models (technicians dismiss by default), one-way data flow (no closeout feedback so models never improve), SAP authorization bypass (governance rejects the system), and protocol fragmentation at the edge (integration becomes a multi-year project). Successful pipelines close every one of those loops.
What sensors do I actually need to start a predictive maintenance program?
Start narrow. Vibration sensors on 5–10 critical rotating assets (pumps, motors, compressors, gearboxes) plus temperature sensors on bearings and current transducers on motors cover the majority of high-impact failure modes. Modern MEMS accelerometers cost a fraction of what industrial-grade sensors cost five years ago. Once the pipeline is working on those first assets — sensor data flowing, models predicting, SAP work orders auto-created, technicians closing them out — expand to additional asset classes in waves. Don't try to instrument every asset before proving the workflow.
Does OxMaint handle the full pipeline or does it need external tools?
OxMaint runs every stage of the pipeline natively — sensor ingest via OPC UA / MQTT Sparkplug B / Modbus TCP / Profinet / REST, time-series storage with asset provenance, ML anomaly detection and RUL estimation, SAP PM work order creation via BAPI/RFC/OData, mobile execution on the technician's phone, and closed-loop feedback where closeout data flows back to the model training pipeline. No external analytics vendor, no systems integrator required, no middleware layer. The free forever plan is available to trial the full workflow before any commitment.
Sign up free to test the pipeline end-to-end.