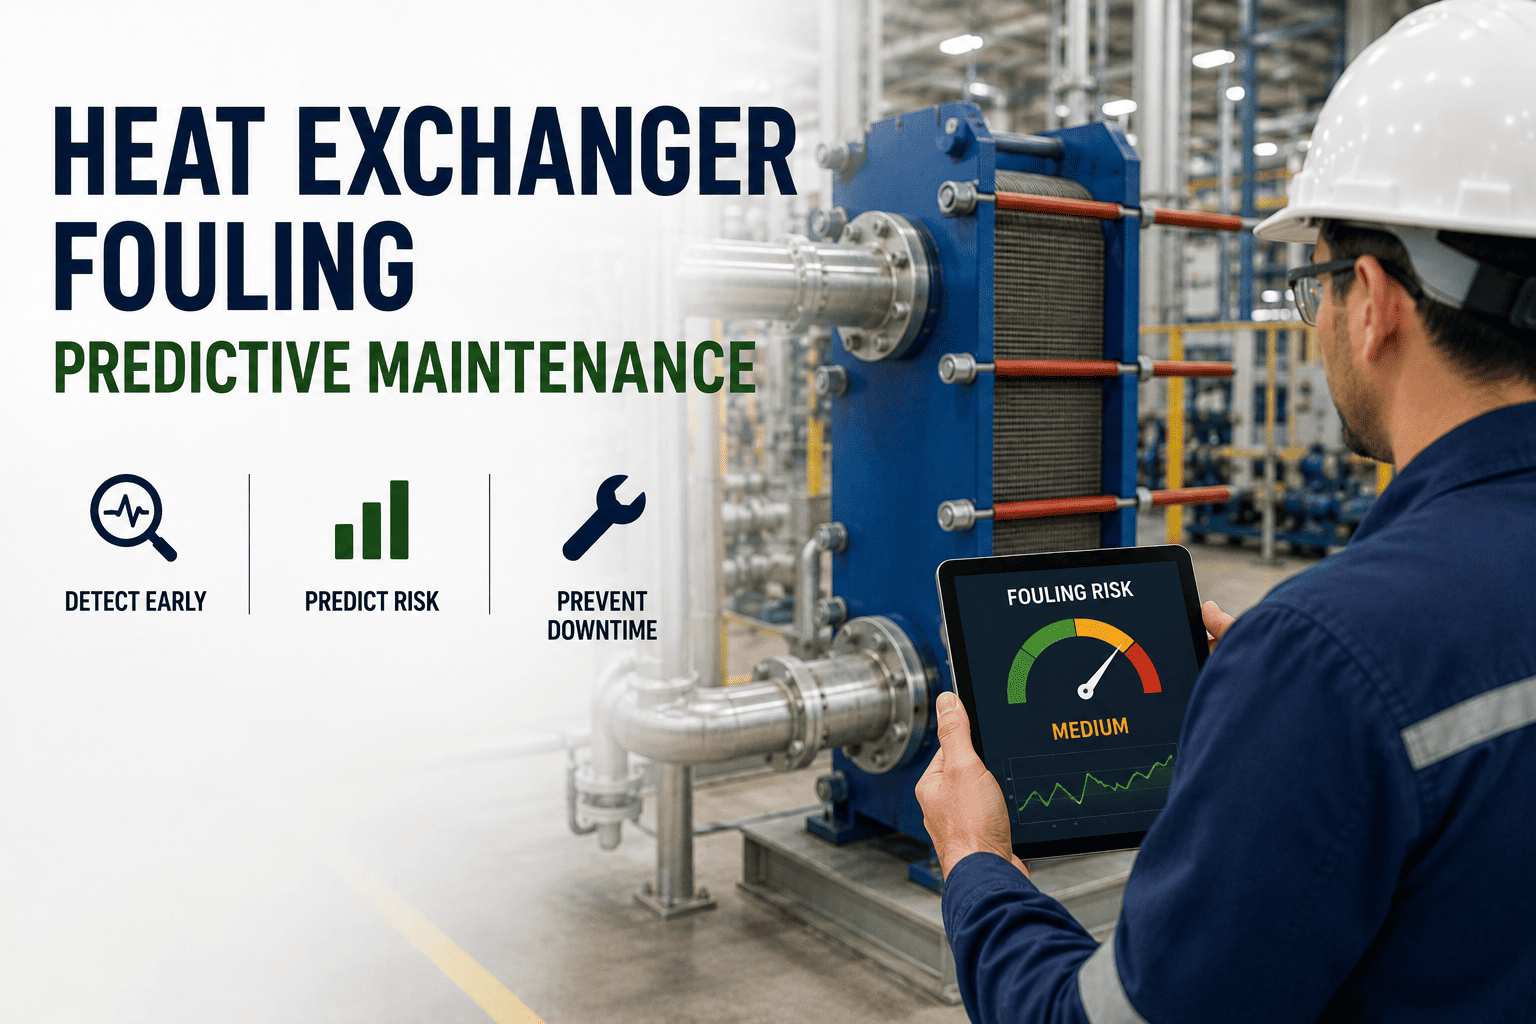
Heat exchanger fouling is one of the most underestimated revenue leaks in manufacturing plants, silently eroding 10-25% of heat transfer efficiency while energy bills climb and production schedules slip. By the time an operator notices a 15% drop in overall heat transfer coefficient, the plant has typically already burned thousands in excess fuel, steam, or compressor hours. The fix is not more frequent cleanings — it is condition-based monitoring: trending fouling factors, watching the delta-T collapse, and triggering CMMS cleaning work only when performance curves cross a defensible threshold. Start your Start Free Trial to deploy fouling analytics across your asset base before the next shutdown.
FOULING PREDICTIVE MAINTENANCE
Can you predict the next fouling failure before it costs you $50K in wasted energy?
Stop guessing when to clean. Trend fouling factors, monitor delta-T collapse, and auto-trigger CMMS work orders when performance curves cross threshold — keeping U-values in spec and reclaiming lost thermal efficiency.
THE HIDDEN COST
Fouling drains 10-25% of your thermal budget — quietly, every shift
A 1% increase in fouling resistance translates roughly to a 1% rise in energy consumption for that exchanger. Across a plant running 30+ shell-and-tube units, the compounding cost reaches six figures before anyone opens a cleaning work order.
Typical efficiency erosion in unmonitored exchangers within 6-12 months of service.
Average excess fuel cost per heavily fouled shell-and-tube unit at mid-load operation.
Tube-side pressure rise that pumps must overcome, driving up electrical draw.
Lost production window waiting for a scheduled shutdown that was planned too late.
PREDICTIVE SIGNALS
Four monitoring signals that catch fouling before efficiency collapses
Predictive maintenance for heat exchangers relies on trending four orthogonal indicators. When two or more deviate simultaneously, the fouling signal is unambiguous — and the CMMS should already have a work order queued.
Fouling Factor Trending
Calculate the fouling resistance Rf = (1/U_actual) − (1/U_clean) at each interval. Trend Rf weekly; when it crosses 0.00035 m²·K/W above design, trigger a Level 2 inspection. Most plants log Rf manually in spreadsheets — predictive systems automate the calculation from live flow and temperature tags.
Delta-T Collapse Monitoring
Track the approach temperature (T_hot_out − T_cold_in) versus the baseline commissioning value. A sustained 3-5°C narrowing of delta-T over two weeks signals deposit buildup on the controlling side. Set a soft alarm at 80% of design delta-T and a hard CMMS trigger at 70%.
Pressure Drop Deviation
Compare measured tube-side and shell-side ΔP against the clean baseline at equivalent flow. A 30-40% rise in ΔP typically accompanies deposit thickness of 0.5-1.0 mm and precedes measurable thermal decay by 2-4 weeks — an early warning that buys planning time.
Performance Curve Analysis
Plot actual heat duty Q = m·cp·ΔT against the manufacturer's performance curve at matched flow rates. The vertical gap between actual and design duty is your fouling tax in kWh — convert it to dollars per day and the ROI of cleaning becomes self-evident to finance.
THE FORMULA
Quantify the fouling tax in dollars per day
When maintenance teams can show operations the exact daily cost of a fouled exchanger, cleaning priority gets resolved in one meeting. The calculation below converts thermal decay into a financial number anyone understands.
WORKED EXAMPLE
A 180-asset chemical plant in Texas tracked a shell-and-tube reboiler dropping from U = 850 W/m²·K (clean) to U = 620 W/m²·K over nine months. Rf climbed to 0.00044 m²·K/W. Daily energy loss hit $138 — roughly $50K annually on that single unit. A $4,200 hydroblast cleaning paid for itself in 30 days and restored U to 815 W/m²·K within tolerance.
CLEANING CYCLE OPTIMIZATION
From calendar-based to condition-based cleaning
Most plants clean on a fixed 12-month cycle regardless of actual fouling state — over-cleaning healthy units and under-cleaning degraded ones. Predictive triggers shift the curve toward ISO 55000-aligned condition-based intervention.
| Trigger Signal | Threshold | CMMS Action | Priority |
|---|---|---|---|
| U-value deviation | 10-15% below design | Level 2 inspection WO | Medium — 30 days |
| Delta-T collapse | 70% of design approach | Cleaning work order queued | High — 14 days |
| Pressure drop rise | 40% above clean baseline | Tube inspection + flush | High — 14 days |
| Rf exceeds design | 0.00035 m²·K/W above spec | Full chemical/mechanical clean | Critical — next shutdown |
| Q_actual vs Q_design gap | Sustained 20%+ for 14 days | Engineering review + clean | High — 7 days |
CMMS INTEGRATION
Auto-trigger cleaning work orders when thresholds breach
Manual monitoring fails because nobody owns the spreadsheet at 2 AM. A predictive CMMS watches the tags continuously and writes the work order the moment a trigger fires — no human latency, no missed alarms.
Automated Work Order Generation
When Rf or delta-T crosses threshold, the CMMS auto-creates a cleaning WO with asset ID, procedure template, parts kit, and downtime window pre-filled — cutting admin time from hours to seconds.
Trend Dashboards
Live Rf, U-value, delta-T, and ΔP trends per exchanger — visible to reliability engineers and operators on the same screen. Shared visibility kills the "is it fouled or not" debate.
Shutdown Planning
Aggregate fouling severity across all exchangers to build a ranked turnaround list. Prioritize the top 20% of assets driving 80% of thermal loss — classic Pareto applied to cleaning scope.
Cleaning History & Audit Trail
Every cleaning event — method, duration, before/after U-value, technician — logged against the asset record. Build a fouling-rate profile per unit to refine future trigger thresholds and justify capital replacement.
RESULTS IN PRACTICE
Plants that shifted to predictive fouling control
Real outcomes from manufacturing teams that replaced calendar-based cleaning with threshold-driven CMMS triggers. Numbers are representative of mid-size process plants with 50-200 heat exchangers.
"We cut unplanned cleaning events by 60% in the first year. The delta-T dashboard flagged a reboiler three weeks before it would have tripped the unit — saved an estimated $85K in lost production."
Reliability Lead — Specialty Chemicals Plant, Louisiana
"Switching from annual to condition-based cleaning freed up 11 days of shutdown capacity. Our energy team finally has a defensible number for the fouling tax on every shell-and-tube we own."
Maintenance Manager — Food & Beverage Manufacturer, Ohio
READY TO RECLAIM THERMAL EFFICIENCY?
Stop paying the fouling tax on every shift
Deploy fouling factor trending, delta-T monitoring, and CMMS-driven cleaning triggers across your exchanger fleet in under two weeks.
FREQUENTLY ASKED
Heat exchanger fouling predictive maintenance — answered
How is the fouling factor calculated from live plant data?
Rf is derived by comparing the actual overall heat transfer coefficient (U_actual) against the clean design value (U_clean). U_actual is computed from live flow rates, inlet/outlet temperatures, and heat duty using the standard LMTD or NTU method. The difference Rf = (1/U_actual) − (1/U_clean) gives the deposit resistance in m²·K/W — trend it weekly to catch fouling early.
What delta-T threshold should trigger a cleaning work order?
Most plants set a soft alarm when the approach temperature narrows to 80% of the design delta-T and a hard CMMS trigger at 70%. A sustained 3-5°C collapse over two consecutive weeks is the most reliable indicator that deposits are controlling heat transfer. You can configure custom thresholds per asset — Book a Demo to see the rule engine in action.
How does predictive cleaning compare to a fixed annual cycle?
Calendar-based cleaning over-serviced healthy exchangers while missing degraded ones between cycles. Plants that shift to condition-based triggers typically reduce cleaning events by 40-60%, redirect labor to higher-value work, and recover 8-15% of lost thermal efficiency — paying back the monitoring investment within the first turnaround.
Which CMMS systems integrate with fouling monitoring?
Oxmaint connects via API or scheduled export to IBM Maximo, SAP PM, eMaint, Fiix, and most modern CMMS platforms. When a fouling threshold breaches, a work order is auto-generated with asset ID, cleaning procedure, priority, and target completion window — no manual data entry required. Start your Start Free Trial to test the integration on a pilot exchanger.
What sensors are required to start monitoring fouling?
You need flow meters on both sides, four temperature sensors (hot in/out, cold in/out), and differential pressure transmitters across tube and shell. Most process plants already have these instrumented for control purposes — no new hardware is typically required. The predictive layer reads existing historian tags and runs the calculations in the background.
START TODAY
See your fouling tax in dollars — before the next shift ends
Connect your historian tags, map your exchangers, and watch the fouling dashboard light up within hours. Your reliability team gets the evidence; your finance team gets the number.
Free 14-day trial · No credit card