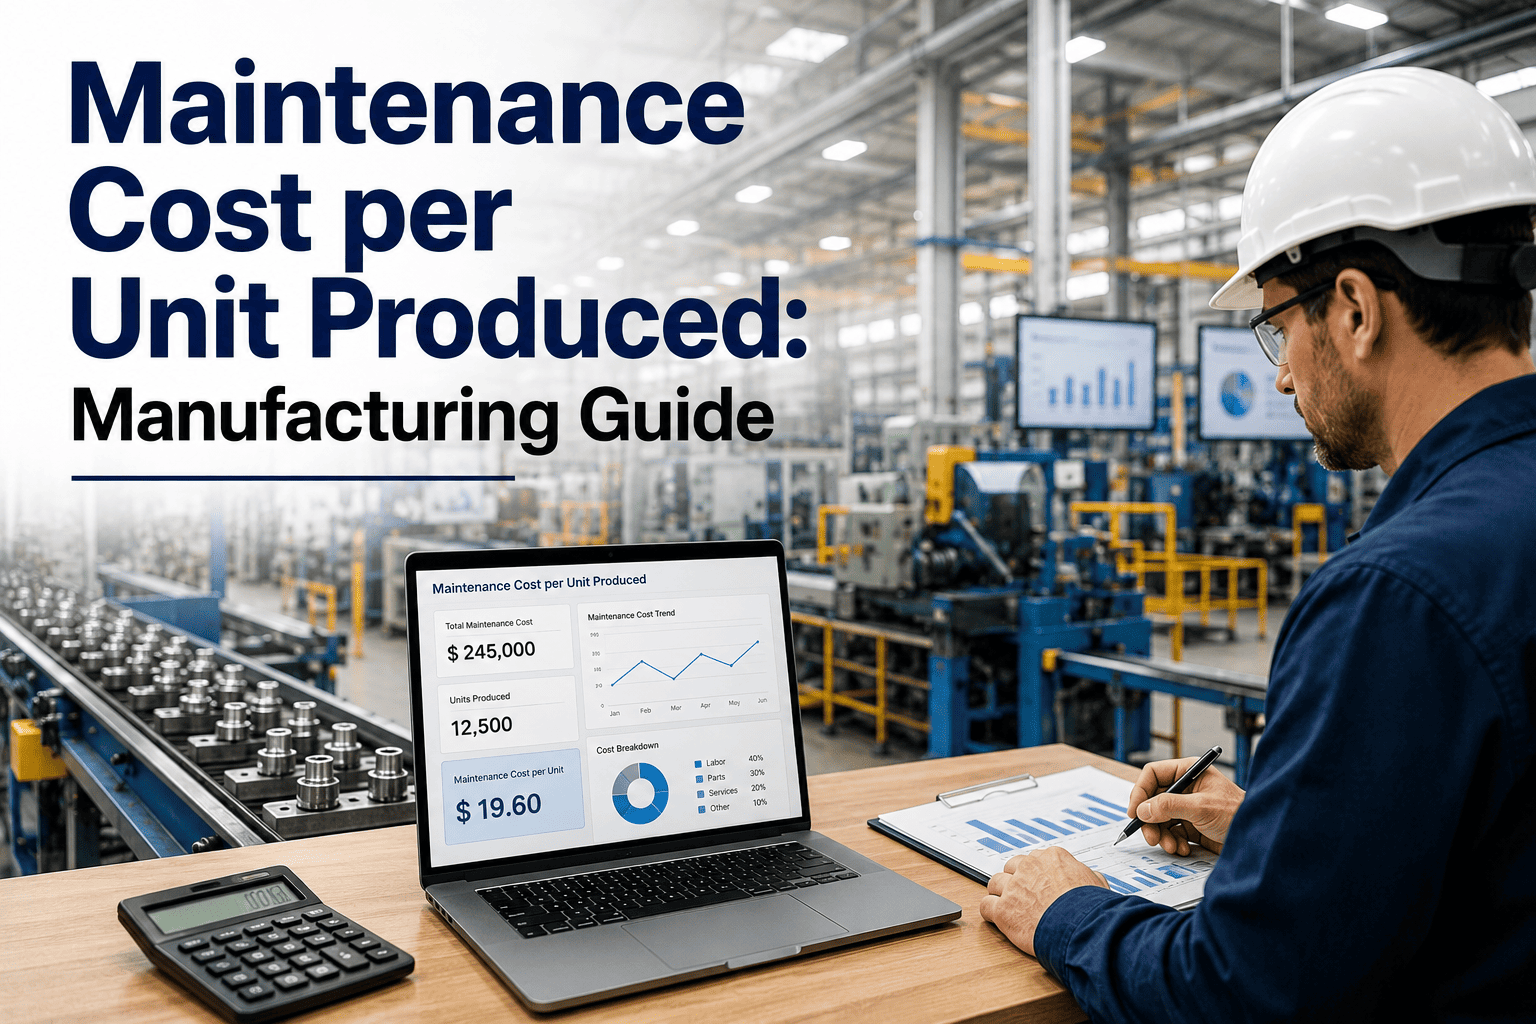
Maintenance cost per unit produced is the ratio that translates everything your reliability team does into a language the CFO and plant controller already speak: dollars of maintenance spend divided by units of physical output. For manufacturing plants, tracking manufacturing maintenance per unit bridges the gap between shop-floor maintenance decisions and boardroom financial planning, revealing whether each additional dollar of preventive work is genuinely buying incremental production volume. When calculated correctly using CMMS cost-per-unit data linked to production volume, it exposes hidden waste — over-maintained assets, under-performing PMs, and reactive firefighting that inflates spend without raising throughput. This guide walks through the formula, cost allocation methodology, industry benchmarks, and the reporting techniques that prevent unhelpful knee-jerk cost-cutting. Ready to see the numbers on your own assets? You can Start Free Trial of OxMaint today.
Every dollar of maintenance spend tied to every unit produced.
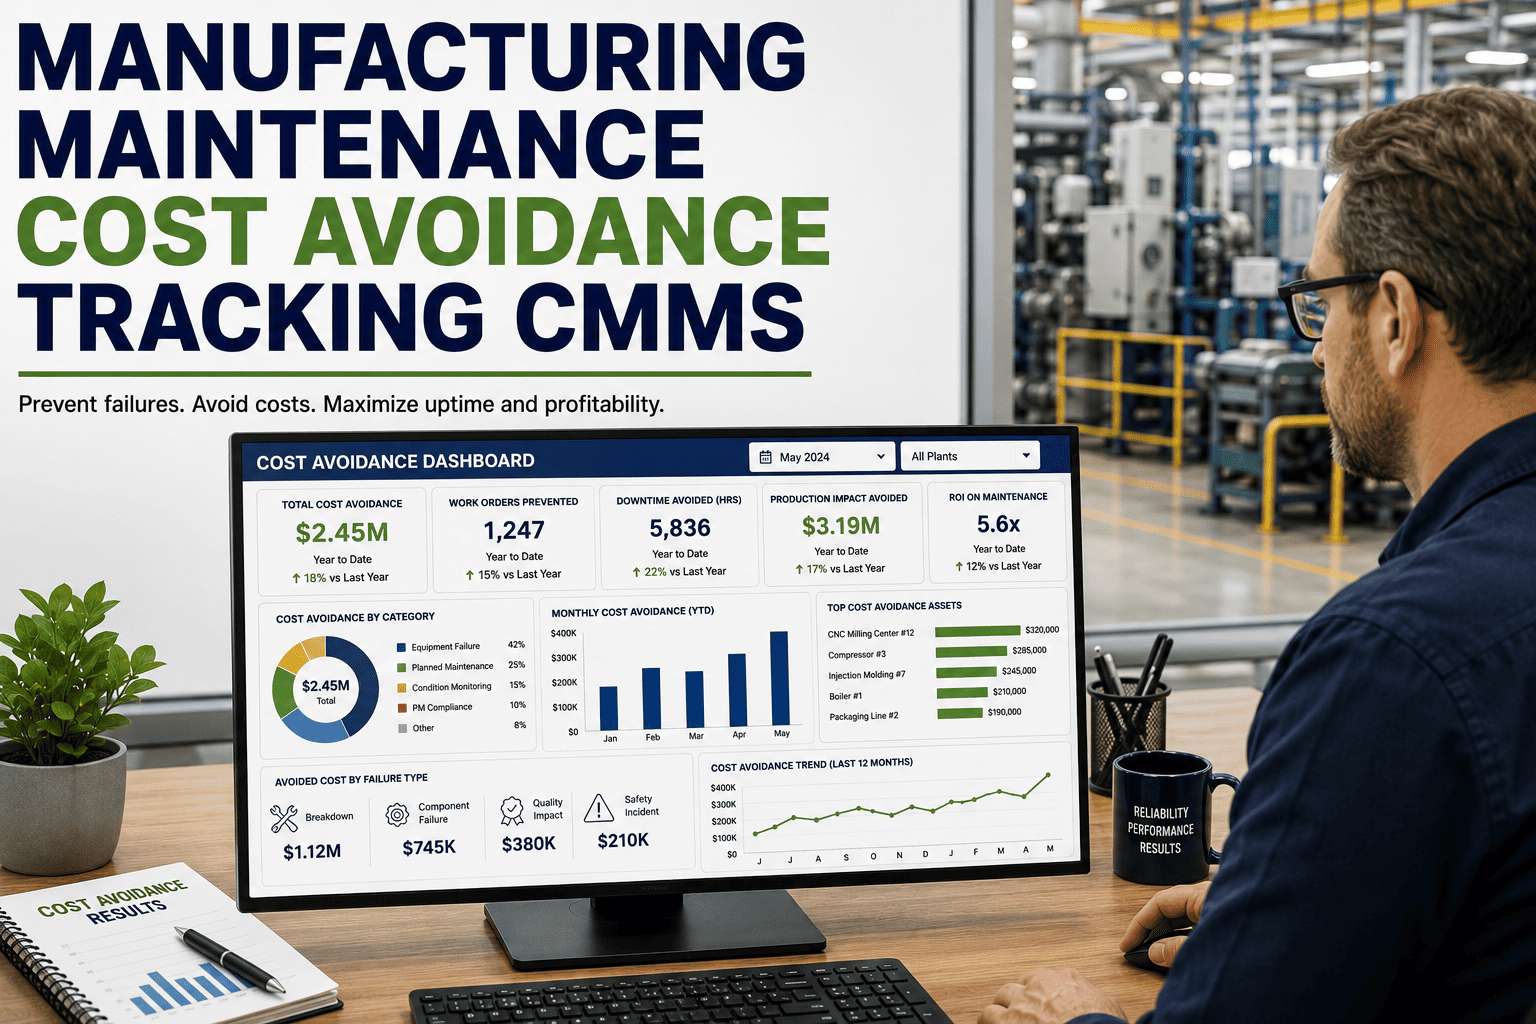
Maintenance cost per unit produced connects shop-floor reliability directly to financial output. When you link CMMS work-order costs to production volume, you stop guessing whether your preventive maintenance program is profitable — and start proving it.
How to calculate maintenance cost per unit produced
The base formula is straightforward, but the inputs are where most plants get tripped up. The numerator must capture fully loaded maintenance spend; the denominator must reflect actual good units produced — not theoretical nameplate capacity.
Labor costs
Internal technician wages, overtime, benefits burden, and supervision. Allocate by actual wrench-time logged on work orders — not department averages, which hide inefficiency.
Parts & material
Spare parts consumed, lubricants, consumables, and any material issued from inventory against an asset. Pull issue-transactions from your CMMS, not purchase orders.
Contractor spend
Outside service providers, specialized vendors, and emergency repair contractors. Include all third-party invoices coded to maintenance accounts in the period.
Allocated overhead
Maintenance shop utilities, tool depreciation, CMMS software cost, training, and a proportionate share of facilities overhead. Typically 8-12% of direct maintenance labor.
What is a good maintenance cost per unit? Benchmark ranges
There is no universal target — a heavy-process plant running 24/7 with high-temperature, high-pressure equipment will always spend more per unit than a light-assembly facility. Use these ranges to contextualize your own number, then trend it month-over-month rather than chasing an absolute target.
| Manufacturing Sector | Maintenance Cost / Unit | Maintenance % of Replacement Asset Value (RAV) | Typical PM-to-Reactive Ratio |
|---|---|---|---|
| Discrete / Light Assembly | $0.20 – $0.80 | 1.5% – 2.5% | 70 / 30 |
| Food & Beverage / CPG | $0.40 – $1.50 | 2.0% – 3.5% | 65 / 35 |
| Automotive & Tier-1 | $0.60 – $2.00 | 2.0% – 3.0% | 75 / 25 |
| Heavy Process / Chemicals | $1.20 – $4.00 | 3.0% – 5.0% | 60 / 40 |
| Pharmaceuticals (GMP) | $0.80 – $2.50 | 2.5% – 4.0% | 80 / 20 |
How to extract accurate cost-per-unit data from your CMMS
A CMMS only produces trustworthy unit-cost figures when every work order captures complete, real-time cost data. If technicians close work orders without entering parts or labor hours, your maintenance unit cost is understated — and the missing spend will surface later as an unexplained budget variance.
Tag every asset to a production line
In your CMMS, assign each asset to a specific production line, cell, or cost center. This is the foundation of plant cost allocation — without it, you cannot roll maintenance spend up to the product level. OxMaint's asset hierarchy makes this a drag-and-drop configuration, not a database migration.
Capture labor time on every work order
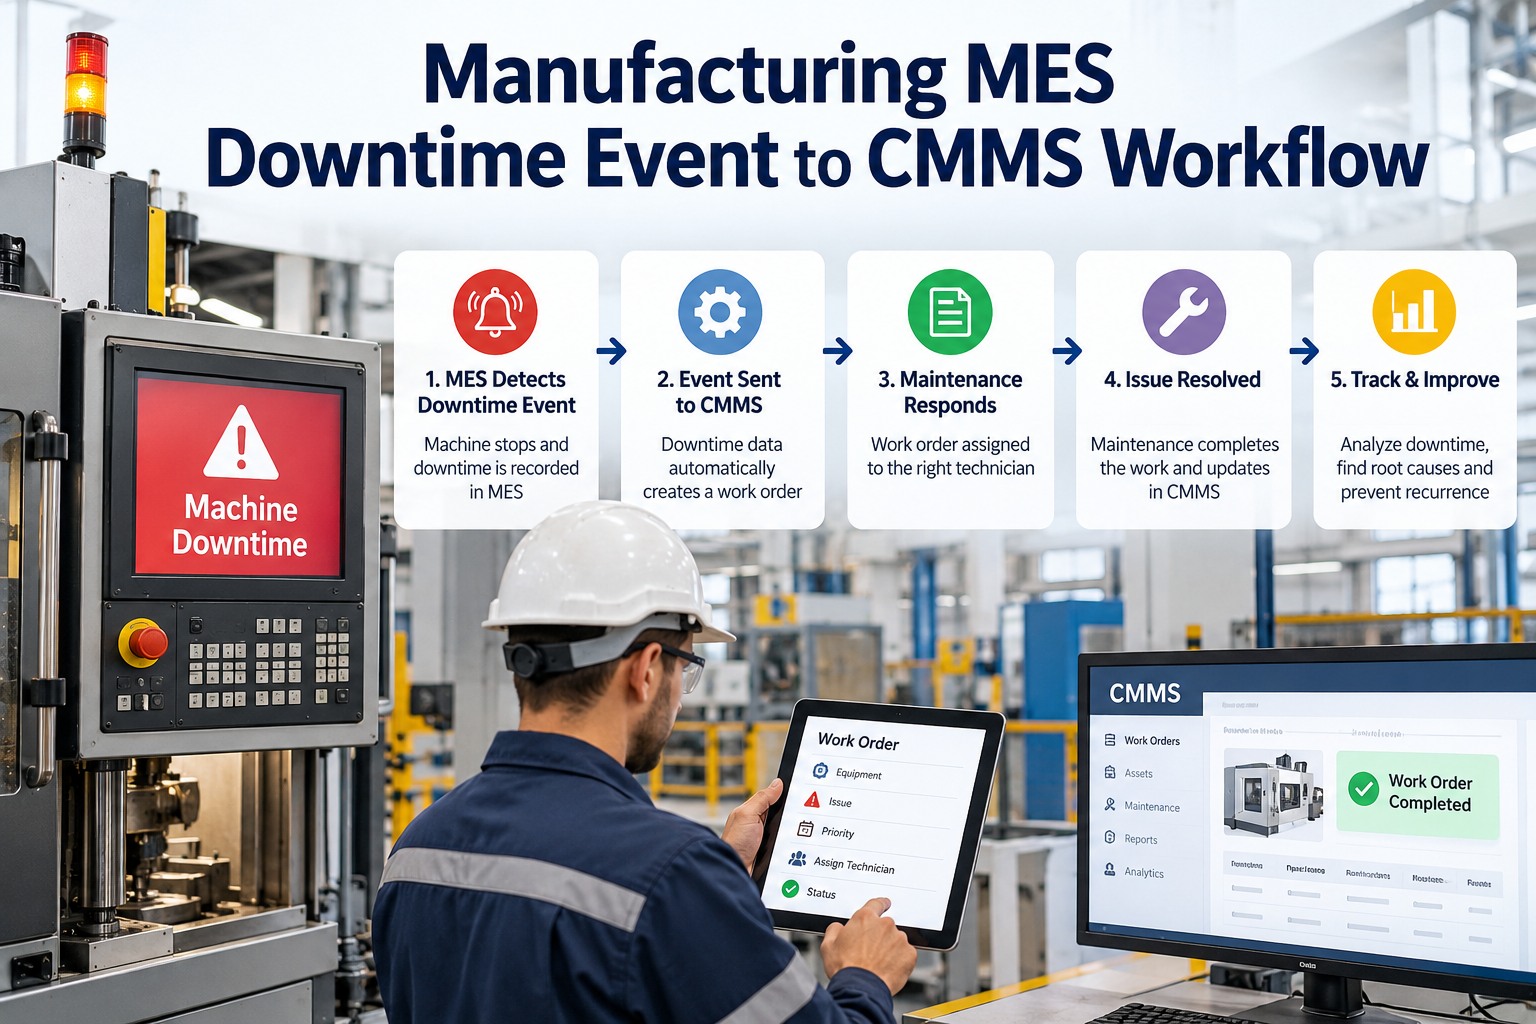
Technicians must clock in and out of work orders — not estimate hours at end of shift. OxMaint's mobile app lets technicians log actual wrench-time from the floor, giving you true labor cost per asset, per PM, and per breakdown.
Link parts issues to work orders
Every spare part consumed must be issued against a specific work order, not a generic stockroom adjustment. OxMaint's integrated inventory module automatically attaches part costs to the work order in real time as items are picked.
Import production volume
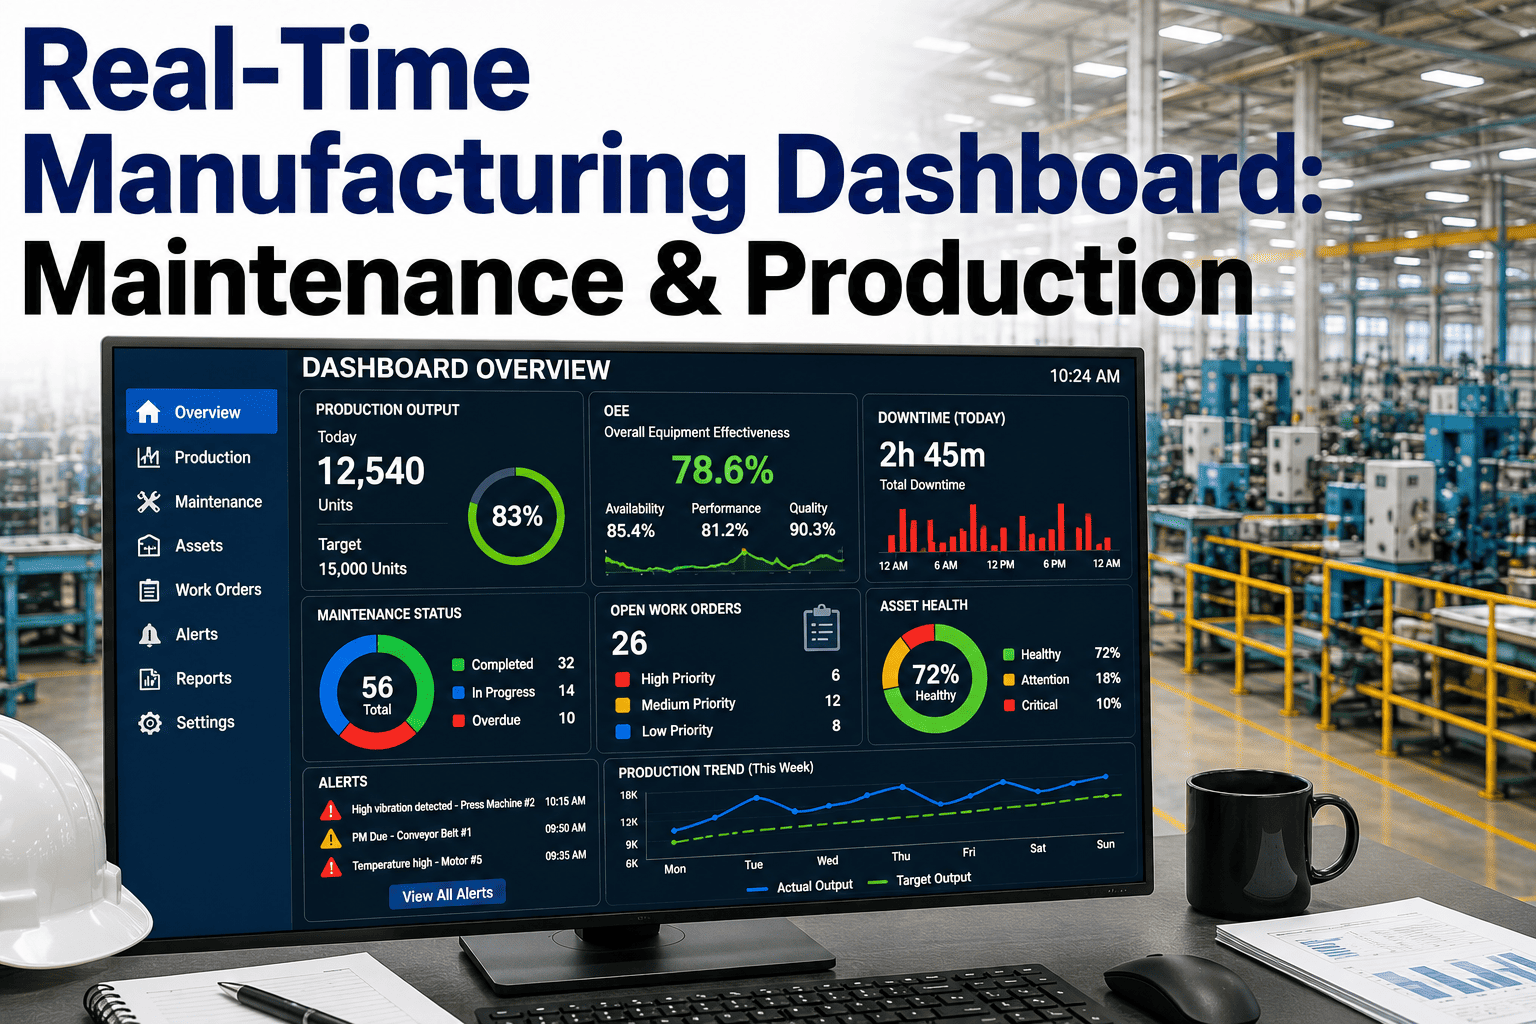
Feed daily or shift-level good-unit counts from your MES or ERP into OxMaint's analytics module. The system then divides total maintenance spend by total production automatically, giving you a live maintenance cost per unit manufactured — no spreadsheet reconciliation required.
Cost-per-unit in action: a 180-asset automotive Tier-1 plant
Consider a real-world scenario. A 180-asset stamping and assembly plant producing 120,000 units per month was spending $312,000 on maintenance monthly — yielding a maintenance cost per unit of $2.60. Their PM-to-reactive ratio sat at 55/45, and leadership was pressuring the maintenance manager to cut the budget by 10%.
- $312,000 monthly maintenance spend, 45% reactive
- Spare-parts variance: $28K/mo unaccounted
- 3.8 hours MTTR on critical-line breakdowns
- No production-volume link — numbers reported 2 weeks late
- $234,000 monthly spend, 72% PM-driven
- Parts fully reconciled — zero unaccounted variance
- 1.9 hours MTTR, predictive alerts on 14 critical assets
- Live cost-per-unit dashboard, refreshed hourly
The result: a 25% reduction in maintenance cost per unit produced — not by cutting the maintenance budget, but by shifting spend from reactive firefighting to predictive and preventive work. The plant avoided $468,000 in annualized maintenance spend while increasing output by 8% due to reduced unplanned downtime. This is what targeted cost allocation manufacturing combined with intelligent CMMS unit-cost tracking actually delivers.
See your real maintenance cost per unit — in 30 minutes
Book a personalized demo and we'll map your asset hierarchy, walk through the cost-per-unit dashboard, and show you exactly where your maintenance dollars are going.
How OxMaint drives down your maintenance cost per unit
OxMaint is built for maintenance and reliability teams who need to prove financial impact — not just close work orders. Four core capabilities map directly to lowering your manufacturing maintenance unit cost, each with a measurable outcome.
Live cost-per-unit analytics
OxMaint automatically links work-order costs to production volume from your MES or ERP, refreshing your maintenance cost per unit manufactured in near real time. No more month-end spreadsheet reconciliation — the number is always current and audit-ready.
AI predictive maintenance
OxMaint's AI engine analyzes vibration, temperature, and run-time data to predict failures before they happen — letting you schedule interventions during planned downtime instead of reacting to breakdowns that spike your unit cost.
Spare-parts inventory control
OxMaint tracks every part issue to a specific work order and asset, so your cost allocation is precise. Auto-reorder points prevent both stockouts that cause downtime and overstock that ties up working capital.
Mobile work-order execution
Technicians log labor, parts, and completion notes from the floor via the OxMaint mobile app — capturing true cost data at the source. No more end-of-shift paperwork, no more estimated hours, no more missing parts data.
How to report maintenance cost per unit without triggering cost-cutting
The single biggest mistake maintenance managers make is presenting a high cost-per-unit number without context. Finance sees $2.60 per unit, assumes maintenance is over-funded, and cuts the budget — which drives the ratio higher as reactive failures spike. Here is how to frame the metric correctly.
Pair cost with reliability
Always present maintenance cost per unit alongside OEE, MTBF, and unplanned-downtime hours. If cost is rising but downtime is falling, the spend is working. If both are rising, you have a defensible case for more investment — not less.
Split PM vs reactive spend
Break the numerator into preventive and reactive buckets. A plant spending 70% on PMs with a low unit cost is healthy; one spending 50% reactively is one breakdown away from a cost spike. This split redirects the conversation from "cut maintenance" to "shift the mix."
Show the cost of doing nothing
Model what unit cost looks like if a critical asset fails. A $50K preventive overhaul that avoids a $400K unplanned line stoppage is not a cost — it is insurance. Frame PM spend as risk reduction, and the budget conversation changes entirely.
Trend, don't snapshot
A single month's number is noise. Show a 12-month trend with annotations for major events — a PM blitz, a new line startup, a supplier-quality issue. Trends tell the story of a program under control; snapshots invite misinterpretation.
Maintenance cost per unit produced — frequently asked questions
What is included in maintenance cost per unit produced?
Maintenance cost per unit includes all direct and indirect maintenance spend — internal labor (including benefits and overtime), spare parts and consumables, contractor invoices, and allocated overhead such as maintenance-shop utilities, tool depreciation, and CMMS software cost. The key is consistency: define the boundary once, document it, and apply it every period so the trend is trustworthy.
How do you allocate maintenance costs to production units?
You allocate by linking each asset in your CMMS to a specific production line or cost center, then rolling up all work-order costs against those assets for the period. Divide the total by good units produced on that line in the same period. OxMaint automates this entire flow — asset hierarchy, cost capture, production-volume import, and the final ratio calculation — so you can see it live on a dashboard. Book a Demo to see your numbers mapped.
What is a good maintenance cost per unit benchmark?
It depends on industry and asset intensity. Light discrete assembly typically runs $0.20-$0.80 per unit, food and beverage $0.40-$1.50, automotive $0.60-$2.00, and heavy process industries $1.20-$4.00 or higher. A more useful benchmark is maintenance spend as a percentage of Replacement Asset Value (RAV) — world-class organizations target 2-3%, while most plants sit at 3.5-5%.
How does a CMMS reduce maintenance cost per unit?
A CMMS reduces unit cost by shifting work from expensive reactive repairs to planned preventive and predictive interventions, eliminating parts waste through tight inventory control, capturing true labor costs for accurate allocation, and providing analytics that identify your worst-performing assets. Plants typically see a 15-25% reduction in maintenance cost per unit within 6-12 months of proper CMMS implementation.
Should maintenance cost per unit go up or down over time?
The goal is a gradual downward trend — but not at the expense of reliability. If unit cost drops while OEE rises and unplanned downtime falls, you are winning. If unit cost drops because the maintenance budget was slashed and backlog is growing, you are deferring failure. Always read the trend alongside MTBF and downtime data; OxMaint's dashboards surface all three together so you never optimize one metric at the expense of another. You can Start Free Trial to see it on your data today.
Stop guessing. Start measuring maintenance cost per unit.
OxMaint gives you the asset hierarchy, cost capture, production-volume linking, and live analytics to know your true maintenance cost per unit — and drive it down without sacrificing reliability.
Free 14-day trial · No credit card