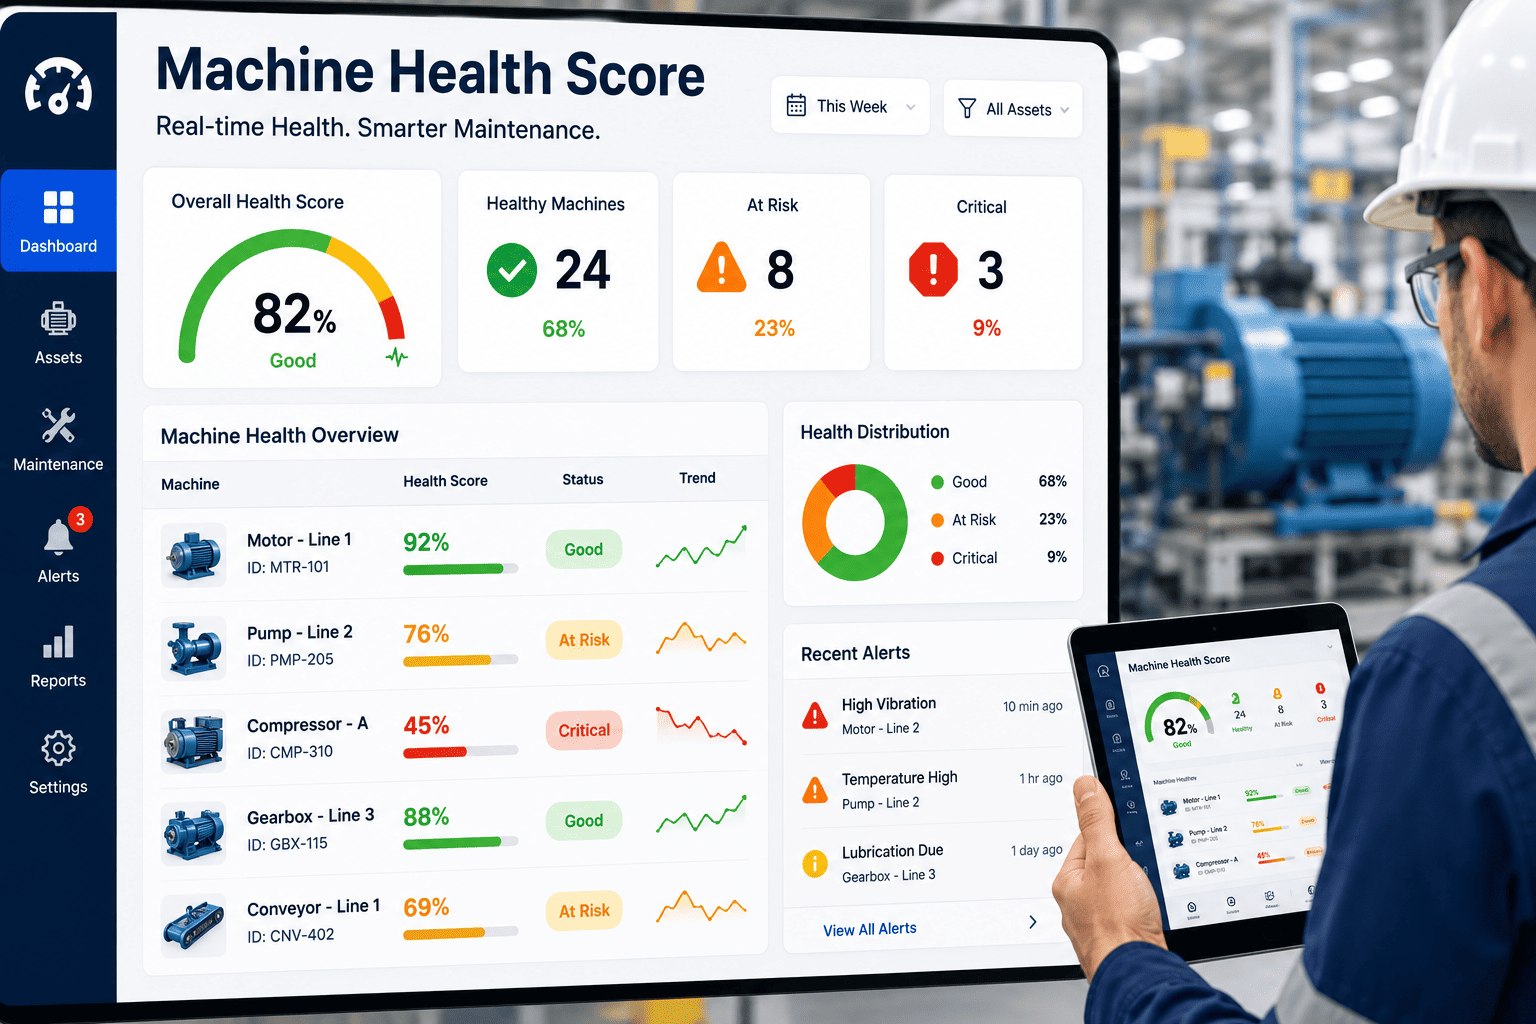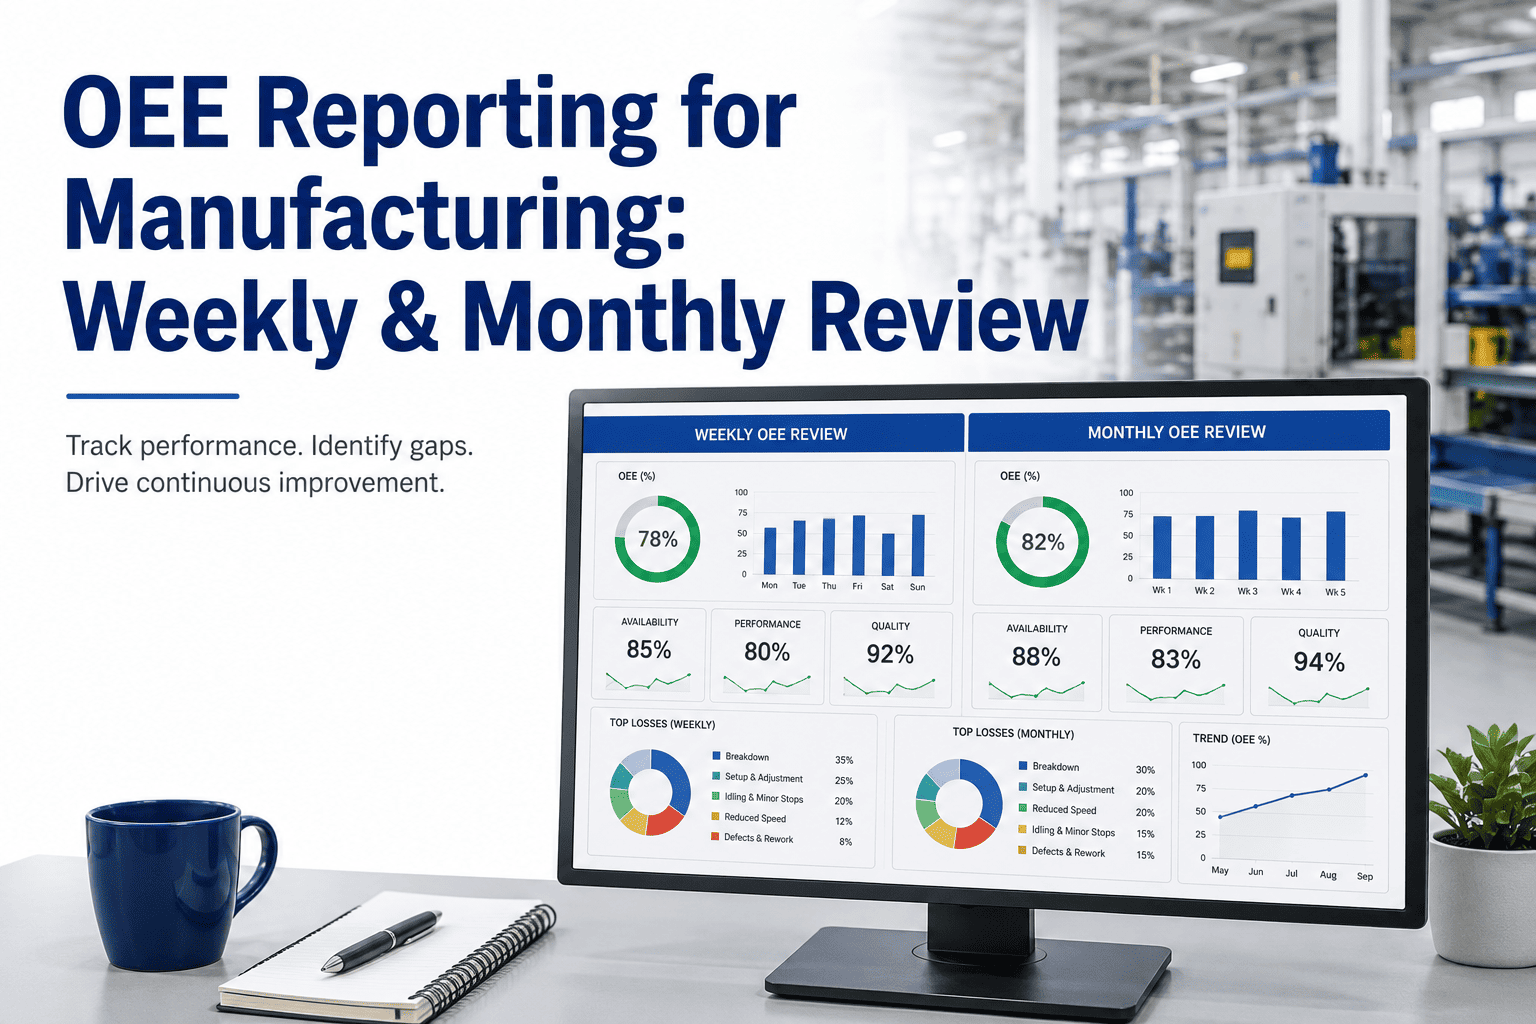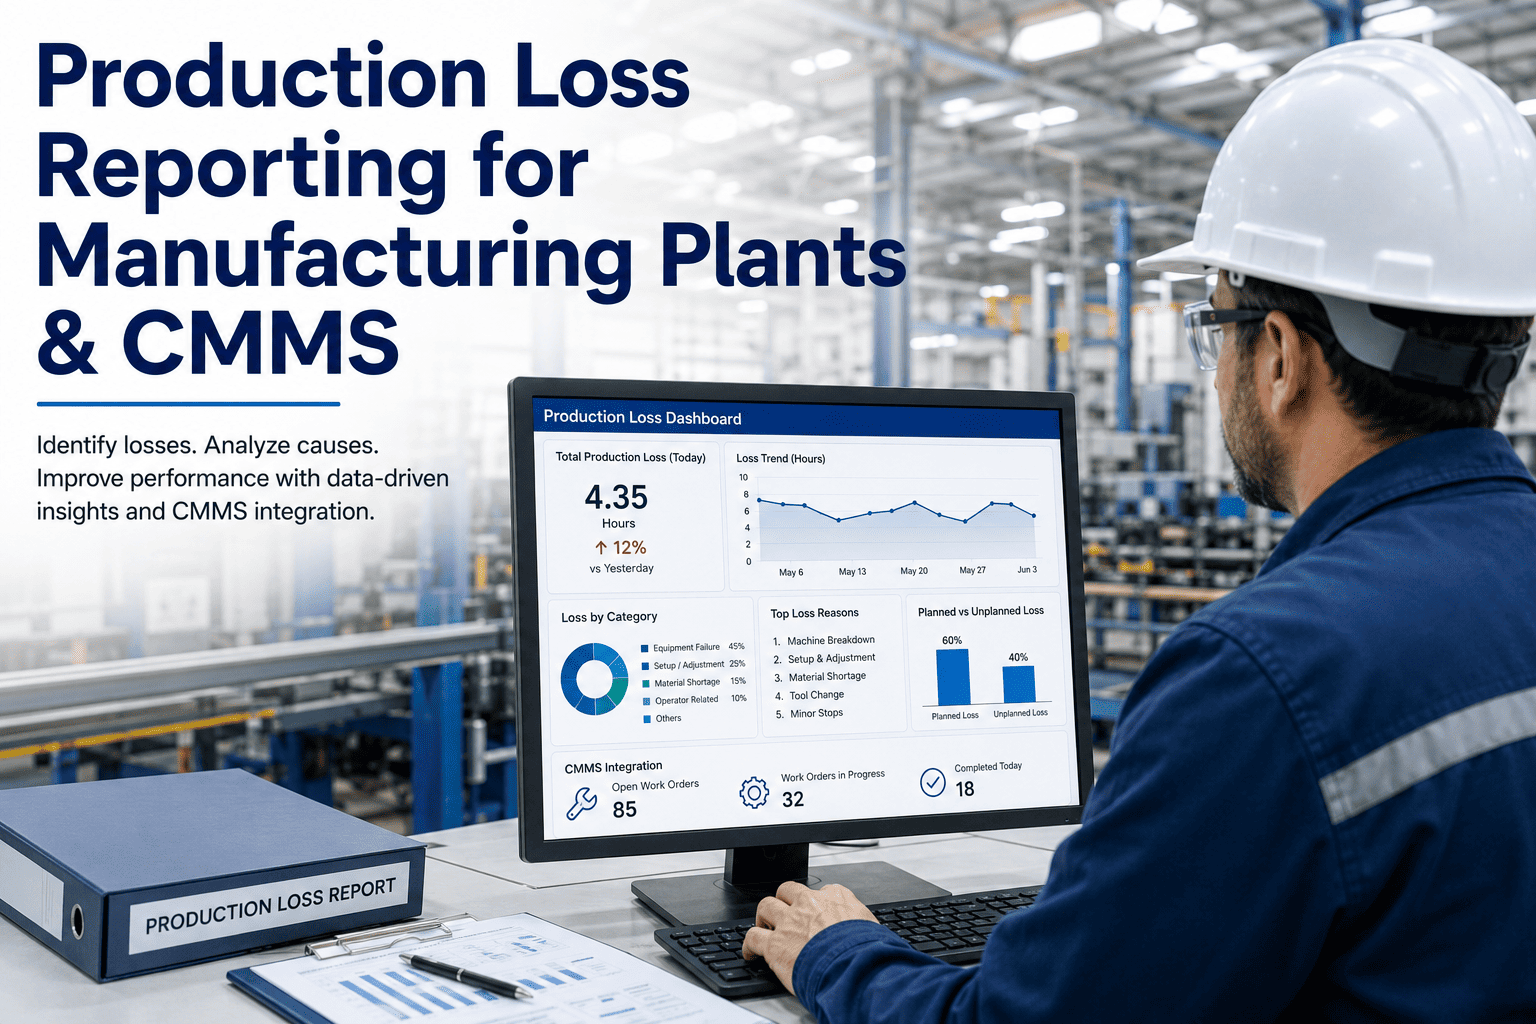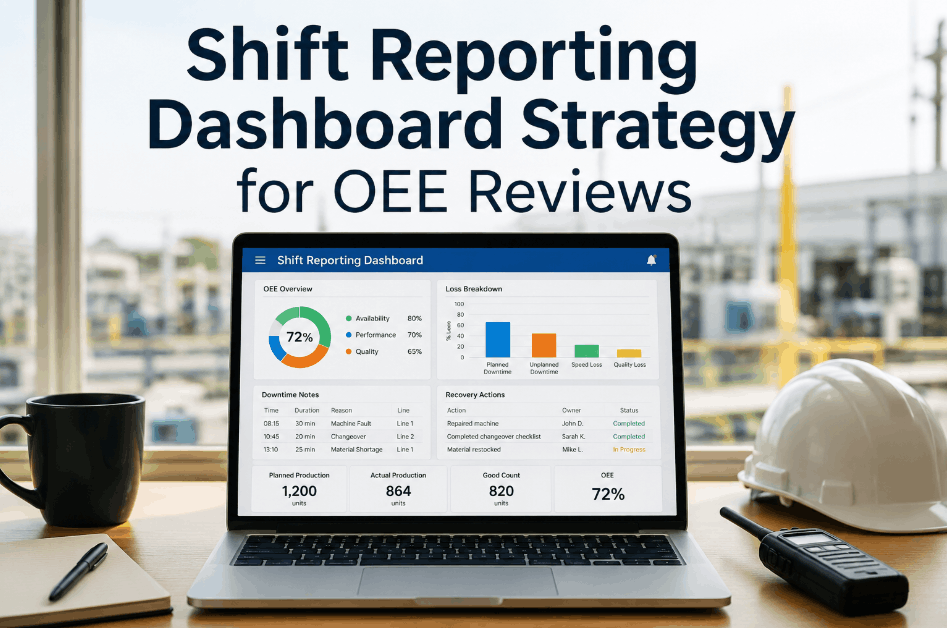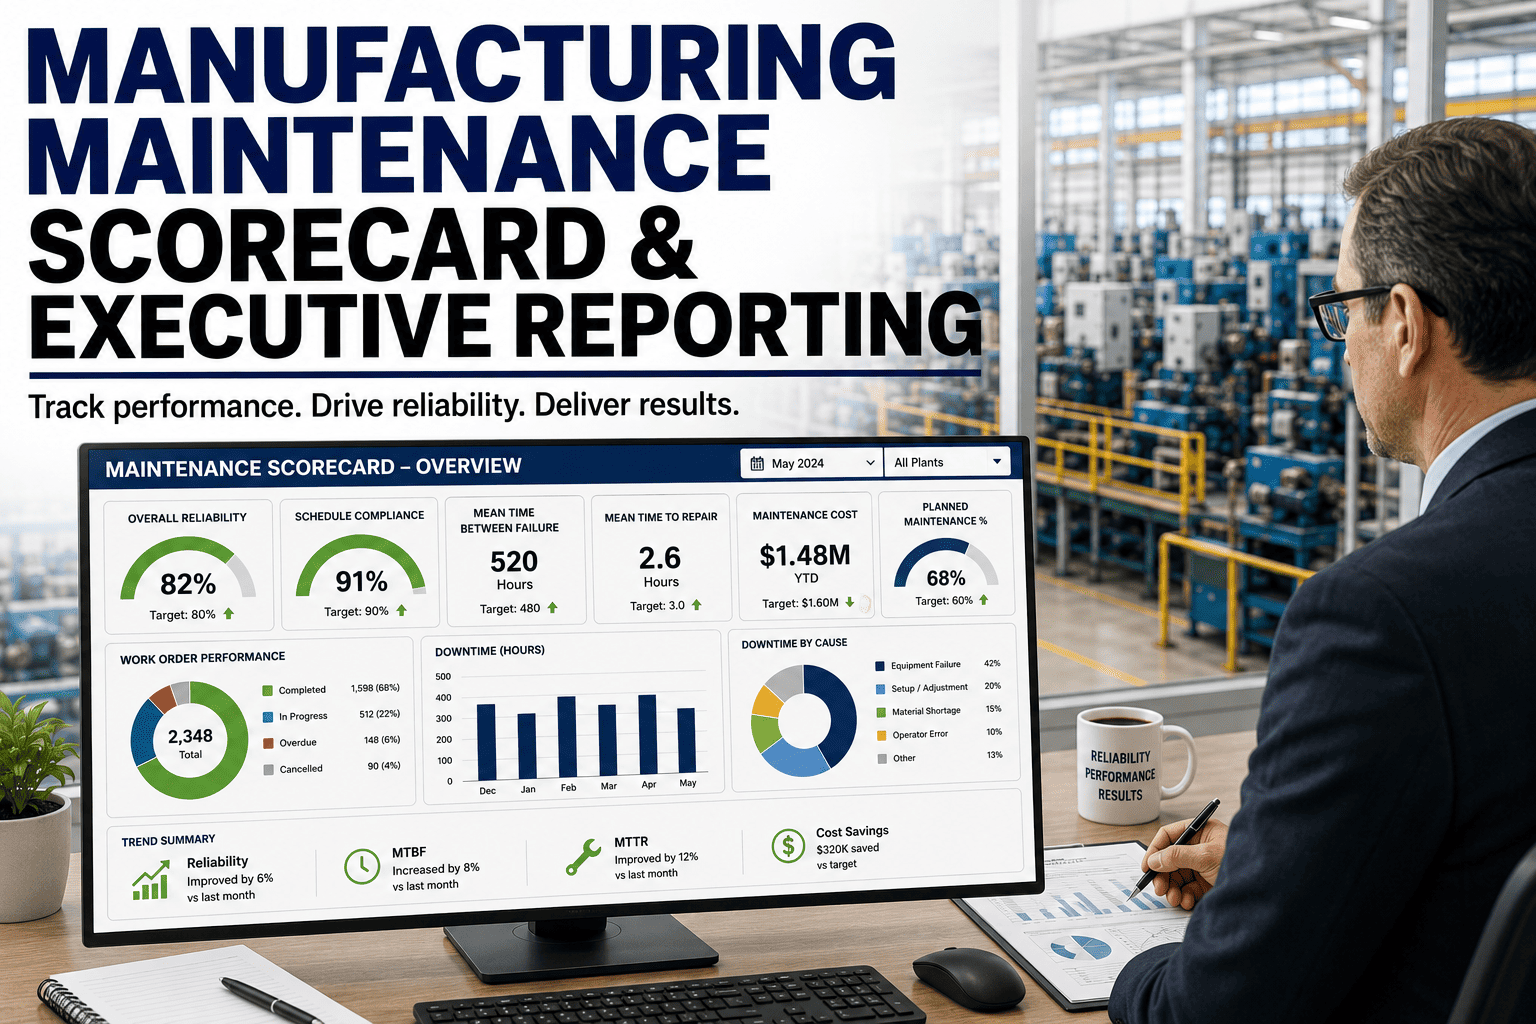
A manufacturing maintenance scorecard translates daily work orders, PM compliance and wrench-time data into the language your CFO and plant director actually act on — cost, output, safety and compliance. Executive maintenance reporting fails when it drowns leaders in 200-line spreadsheet tabs instead of surfacing the 8–12 KPIs that predict plant performance. A CMMS scorecard built on leading and lagging indicators, red-amber-green status thresholds and automated data collection turns the monthly review from a defensive exercise into a decision-making tool. OxMaint's AI-powered CMMS auto-generates board-ready manufacturing KPI scorecards from real-time work-order data — you can explore it with a Start Free Trial or keep reading to build yours from scratch.
Is your maintenance scorecard driving decisions — or just decorating the boardroom wall?
Plants that tie maintenance KPIs to live CMMS data review failures 40% faster and cut unplanned downtime by 25–50% within the first year. A well-designed maintenance management scorecard gives executives exactly what they need: cost, risk and output — in one glance.
What goes on a manufacturing maintenance scorecard?
The best plant maintenance scorecards balance 4–6 lagging indicators (what already happened) with 4–6 leading indicators (what will happen next). Anything beyond 12 KPIs turns the report into noise.
Mean Time Between Failures and Mean Time To Repair tell executives how often assets break and how fast teams respond. Track per critical asset, not plant-average — averages hide the 20% of equipment driving 80% of downtime.
Total maintenance spend divided by Replacement Asset Value. World-class plants run 1.5–3%; typical manufacturers sit at 5–8%. This is the single number your CFO will look for first.
Percentage of scheduled preventive maintenance completed on time. Below 90% and unplanned failures spike within 60–90 days — a leading indicator your executives can act on before downtime hits.
Hours of work completed divided by hours scheduled. Below 85% means your planning function is leaking capacity. Pair with Wrench Time to expose the gap between scheduled and actual hands-on labor.
Lost production revenue + emergency repair labor + expedited parts. A single 8-hour line stoppage on a high-speed filler can exceed $45K. Translate downtime into dollars — executives feel the number instantly.
Backlog measured in crew-weeks; Wrench Time as a percentage of paid shift hours. Healthy backlog sits at 2–4 weeks; Wrench Time above 55% separates top-quartile plants from reactive ones stuck below 35%.
How to build a maintenance scorecard executives actually read
A maintenance leadership report earns trust through consistency. Fix the KPI list, set red-amber-green thresholds before the month starts, and deliver on the same cadence — every time.
Lock 8–12 KPIs aligned to corporate objectives. Map each to an owner. If a KPI has no accountable name, drop it — unowned metrics rot.
Set green / amber / red targets using 90-day baselines from your CMMS. Example: PM Compliance ≥95% green, 90–94% amber, <90% red. No threshold, no color — just opinions.
Connect the scorecard to live CMMS data so no manual entry is needed. Spreadsheets are where scorecards go to die — automation is what keeps them trustworthy.
Distribute on a fixed monthly cadence. Spend 20 minutes on the dashboard, 40 on root-cause discussion. The scorecard starts the conversation; it is not the conversation.
Setting red-amber-green targets that drive action
Color status works only when thresholds are set before the data arrives. If your team decides what is "red" after seeing the number, the scorecard becomes an opinion contest.
| KPI | Green (On Target) | Amber (Watch) | Red (Act Now) | Owner |
|---|---|---|---|---|
| PM Compliance | ≥ 95% | 90–94% | < 90% | Reliability Lead |
| MTBF (critical assets) | > 400 hrs | 250–400 hrs | < 250 hrs | Asset Manager |
| MTTR | < 4 hrs | 4–8 hrs | > 8 hrs | Maintenance Sup. |
| Maint. Cost % RAV | < 3% | 3–5% | > 5% | Plant Manager |
| Schedule Compliance | ≥ 90% | 80–89% | < 80% | Planner |
| Unplanned Downtime Hrs | < 2% avail. | 2–5% | > 5% | Ops + Maint. |
How OxMaint builds your CMMS executive dashboard automatically
When scorecard data flows straight from work orders and asset records, you eliminate the two-day spreadsheet scramble and the credibility gap that comes with manual reporting.
Auto-generated executive dashboards
OxMaint pulls PM compliance, MTBF, MTTR, downtime and cost data from live work orders — no exports, no manual entry. Your maintenance executive dashboard refreshes in real time and is board-ready on day one.
Predictive maintenance alerts
AI models on vibration, temperature and oil data flag failures 7–21 days before they happen. Convert unplanned downtime into scheduled work — the single biggest scorecard mover within 90 days.
Audit-ready compliance trails
Every PM, inspection and corrective action is timestamped and attributable. ISO 55000, OSHA and FMCSA audits become a 10-minute export instead of a week-long fire drill across shared drives.
Cost & RAV analytics
Track maintenance spend against Replacement Asset Value per asset class. Spot the 20% of equipment consuming 80% of budget and make build-vs-replace decisions backed by data, not instinct.
The cost of NOT having a maintenance scorecard
A 180-asset food packaging plant spending $42K/month on reactive repairs had no visibility into which assets drove 70% of their cost. Within 90 days of deploying an OxMaint CMMS scorecard, PM compliance climbed from 71% to 94% and unplanned downtime dropped 38%.
- 71% PM compliance — 3 in 10 PMs skipped or late
- Spreadsheet reports took 12 hrs/month to assemble
- No RAG status — no one knew which KPI was red until downtime hit
- Audit prep consumed 5+ days per quarter
- 94% PM compliance — failures predicted 7–14 days out
- Dashboard auto-generated; 0 hrs manual reporting
- Red-amber-green status live on every executive's phone
- Audit export completed in under 30 minutes
"The scorecard changed the conversation. Our CFO stopped asking why maintenance costs were high and started asking which assets we should replace next — because the data was finally clear."
— Reliability Manager, mid-size packaging manufacturer
See your maintenance scorecard live on OxMaint — in 30 minutes
Book a demo and we'll connect your asset list, build a sample executive dashboard and show you exactly where your KPIs land on red-amber-green.
Manufacturing maintenance scorecard FAQs
What KPIs should be on a manufacturing maintenance scorecard?
A board-ready maintenance management scorecard should include 8–12 KPIs balanced between leading and lagging indicators: PM Compliance, MTBF, MTTR, Maintenance Cost as % of RAV, Schedule Compliance, Wrench Time, Backlog (crew-weeks) and Unplanned Downtime Cost. Anything beyond 12 dilutes executive focus and turns the report into wallpaper.
How often should I distribute a maintenance executive dashboard?
Monthly is the standard cadence for board-level reporting, but the underlying CMMS dashboard should refresh in real time. Weekly operational reviews with the maintenance team keep leading indicators like PM compliance and schedule adherence on track. You can Book a Demo to see how OxMaint automates both cadences.
What is a good Maintenance Cost as a percentage of RAV?
World-class plants run at 1.5–3% of Replacement Asset Value; average manufacturers sit at 5–8%. Anything above 8% signals a reactive program with too much emergency repair work. Track the trend month-over-month — a falling ratio means your preventive and predictive strategy is working.
How does a CMMS generate the scorecard automatically?
A CMMS like OxMaint captures every work order, PM completion, asset failure and parts issue in real time. The executive dashboard layer aggregates this into pre-built KPI tiles with red-amber-green thresholds — no spreadsheet exports or manual data entry. Reports are generated on schedule and delivered to stakeholders automatically.
Can I switch from spreadsheets to a CMMS scorecard without losing historical data?
Yes. OxMaint supports CSV import of asset registers, work-order history and PM schedules, and our onboarding team maps your existing KPI definitions into the platform during setup. Most plants go live with a populated executive dashboard in 2–4 weeks. Start with a Start Free Trial to test the import flow on your own data.
Stop building scorecards by hand. Start driving decisions with data.
OxMaint turns your work orders, PMs and asset data into a live executive maintenance dashboard — red-amber-green status, cost-to-RAV, downtime impact — all automated. Book a 30-minute demo or start your free trial today.
Free 14-day trial · No credit card