OEE reports that no one acts on are worse than no reports at all — they consume engineer hours, mask real losses behind averages, and train leadership to ignore the very metric meant to drive improvement. Plants that close the loop, by contrast, typically lift OEE 8–15 points within two quarters because the same data finally reaches the people who can authorize change. This guide shows how to structure weekly and monthly OEE reviews that drive decisions: cadence, participants, loss-drill format, action tracking, and the two-page executive summary that gets budget approved. You can Start Free Trial to roll these review templates into your CMMS today.
Is your OEE report driving decisions — or just filling a folder?
Most plants generate 50+ OEE data points weekly and act on fewer than 4. The fix isn't more data — it's a review cadence, a loss-drill format, and a two-page summary that turns losses into funded action items.
Why unread OEE reports are worse than no report at all
A report nobody acts on doesn't just waste the 6–10 engineer-hours spent building it — it actively damages your improvement program by teaching leadership that OEE is "just a number on a dashboard."
Worked example: a 180-asset food packaging plant spent $42K/yr generating OEE reports that leadership skimmed and shelved. After restructuring to a weekly loss-drill + monthly two-page summary, the same plant identified a chronic changeover loss, funded a $28K quick-change tooling retrofit, and recovered 11 OEE points on the bottleneck line in 9 weeks — a 3.1-month payback.
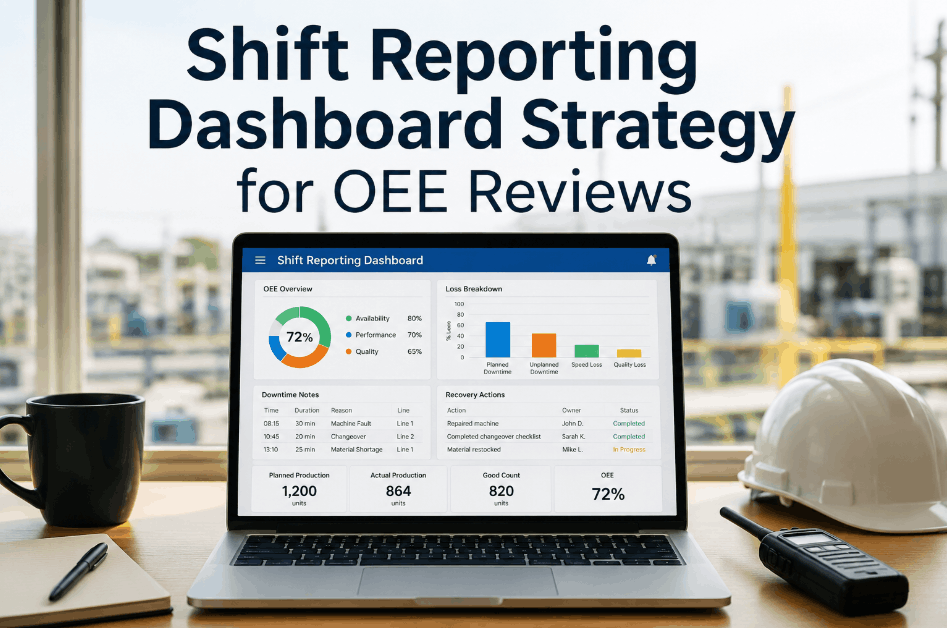
The 30-minute weekly OEE review that actually closes losses
A weekly review isn't a data download — it's a loss-drill. Run it the same day each week, cap it at 30 minutes, and force every agenda item to end with an owner and a due date.
Open with line-level OEE, Availability, Performance, and Quality vs. target for the prior 7 days. Flag any metric that dropped more than 3 points below rolling average. No discussion yet — just read the numbers aloud so the room shares one reality.
Pull the top three loss events by weighted minutes lost (not by count). For each, walk through: what happened, root cause category (unplanned downtime, speed loss, defect/rework), and whether it's recurring or one-off. Use CMMS work-order codes so losses tie back to asset history.
Every loss that's recurring gets an action item with a single owner (not a team), a due date within 14 days, and a verification metric. If you can't name an owner in 60 seconds, the action isn't ready — park it and escalate at the monthly review.
Walk the action-item log. Mark each as done, in-progress, or overdue. Overdue items auto-escalate to the monthly review. This 3-minute loop is what separates plants that improve from plants that just measure.
Owns shift-level data, reports top losses
Ties downtime to work orders, flags recurring failures
Owns defect/rework losses, identifies quality trends
Facilitates, tracks action items, escalates blockers
The two-page executive summary that gets budget approved
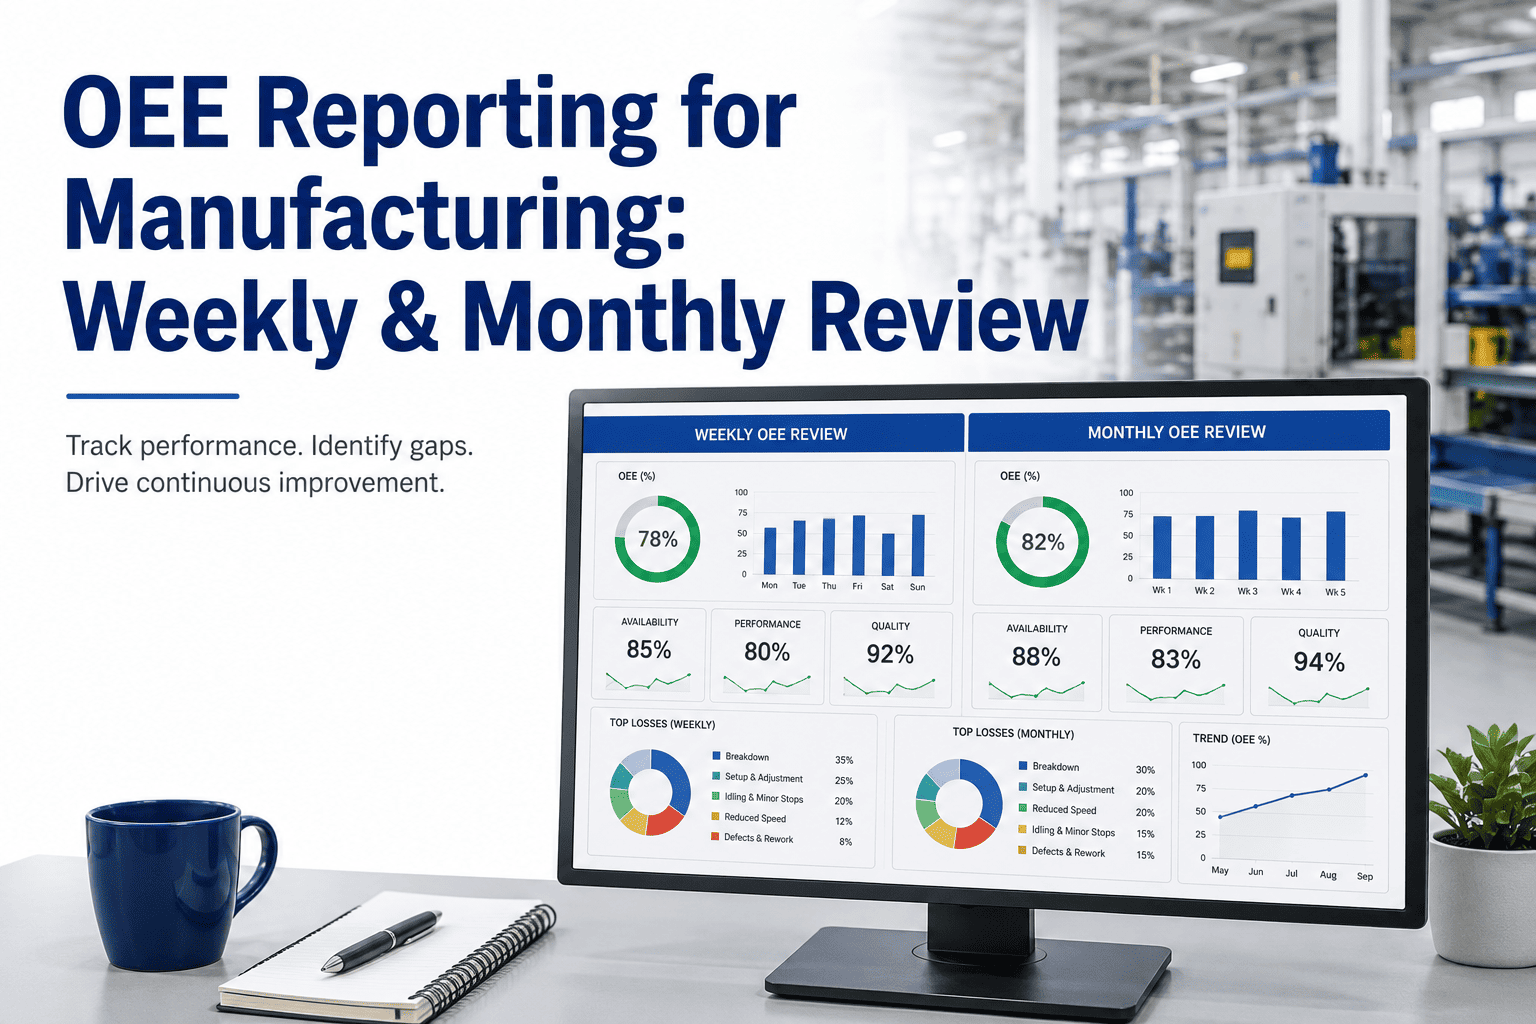
Monthly reviews answer a different question than weekly ones: "What do we fund next?" The two-page format below is what plant managers actually hand to operations directors — and what gets capital requests signed.
- OEE vs. target for the month, with 3-month trend line and 12-month rolling average
- Pareto of losses by category: unplanned downtime, speed loss, changeover, minor stops, defects
- Top 5 loss events ranked by cost-impact, not just minutes — multiply minutes by $/hr contribution margin
- Availability / Performance / Quality split so leadership sees which pillar is dragging
- One-sentence "so what" under each chart — never ship a chart without a plain-English takeaway
- Open action items from weekly reviews: status, owner, expected OEE impact in points
- Completed actions this month with measured OEE lift — proof the process works
- Top 3 funding asks: cost, payback months, expected OEE gain, risk of not doing it
- Recurring losses needing capital (not just maintenance) — escalated with $ impact
- Next month's focus: the single loss category the team will attack, with a named champion
| Loss Category | Monthly Cost Impact | Root Cause | Proposed Action | Cost | Payback | OEE Lift |
|---|---|---|---|---|---|---|
| Changeover — Line 3 filler | $18,400 | No quick-change tooling | Retrofit quick-change parts | $28,000 | 3.1 mo | +4.2 pts |
| Unplanned — Conveyor B-7 | $11,200 | Bearing failures (recurring) | Vibration analysis + PM overhaul | $9,500 | 2.5 mo | +2.1 pts |
| Speed loss — Packaging Line 1 | $9,800 | Operator speed setting below rated | Standard work + auto-rate control | $4,200 | 1.3 mo | +2.8 pts |
| Defects — Labeler 2 | $6,300 | Label register drift | Sensor calibration + auto-adjust | $7,800 | 3.7 mo | +1.4 pts |
When OEE lives inside your CMMS, the review runs itself
Standalone OEE dashboards die in meetings because the data can't be traced to a work order. When OEE reporting is CMMS-integrated, every loss drills down to an asset, a failure code, and a corrective action — without a second system or a manual spreadsheet bridge.
- Losses shown as minutes only — no $ impact
- No link to asset history or work orders
- Manual export to build the weekly review deck
- Action items tracked in a separate spreadsheet
- No escalation path when items go overdue
- Leadership sees numbers, not causes or fixes
- Losses shown in minutes AND cost, tied to asset
- Every downtime event links to a work-order code
- Weekly review deck auto-generated from live data
- Action items created as CMMS work orders with owners
- Overdue actions auto-escalate to monthly review
- Leadership sees cause, action, cost, and payback in one view
Stop generating reports nobody reads
Turn weekly and monthly OEE reviews into funded action items with CMMS-integrated reporting, auto-generated loss drills, and a two-page executive summary template built in.
OEE review questions, answered
What's the difference between a weekly and monthly OEE review?
Weekly reviews are operational — a 30-minute loss-drill where the top three losses get an owner and a 14-day due date. Monthly reviews are strategic — the two-page executive summary that trends performance, ranks losses by cost, and presents funding asks with payback math. Weekly drives action; monthly drives budget. Running only monthly means losses sit unaddressed for 30 days; running only weekly means leadership never sees the capital picture.
Who should attend the weekly OEE review?
Keep it to four core roles: Production Lead (owns shift data), Maintenance Lead (ties downtime to work orders), Quality Lead (owns defect losses), and a Continuous Improvement facilitator who tracks action items. Keep the plant manager out of the weekly — they attend the monthly. More than five people turns a 30-minute drill into a 90-minute meeting with no decisions. You can Book a Demo to see a role-based review template configured for your plant.
What OEE report format works best for leadership?
A two-page summary, not a dashboard dump. Page one: OEE vs. target, trend line, Pareto of losses by cost, and a one-sentence "so what" under each chart. Page two: open actions, completed actions with measured lift, and top three funding asks with cost, payback, and expected OEE gain. Leadership doesn't want raw data — they want the three decisions they need to make this month, backed by numbers.
How does CMMS-integrated OEE reporting work?
When OEE data lives in the same system as your work orders, every downtime event automatically links to an asset, a failure code, and a corrective action. The weekly review deck generates from live data instead of a manual export, and action items become CMMS work orders with owners and due dates. Overdue items escalate to the monthly review automatically. Start Free Trial to connect OEE reporting to your asset history in under a day.
How fast can a plant see OEE improvement from better reviews?
Plants that switch from ad-hoc reporting to a structured weekly loss-drill plus monthly executive summary typically see 8–15 OEE points of gain within two quarters. The speed depends on how quickly action items convert to completed work — which is exactly why action ownership and 14-day due dates matter. The fastest gains come from recurring losses that were already known but never funded because they weren't quantified in dollars.
Your next OEE review should end with funded action items — not a folder
Set up CMMS-integrated OEE reporting, auto-generated loss drills, and the two-page executive summary template in under a day. Free 14-day trial, no credit card, no implementation fee.
Free 14-day trial · No credit card