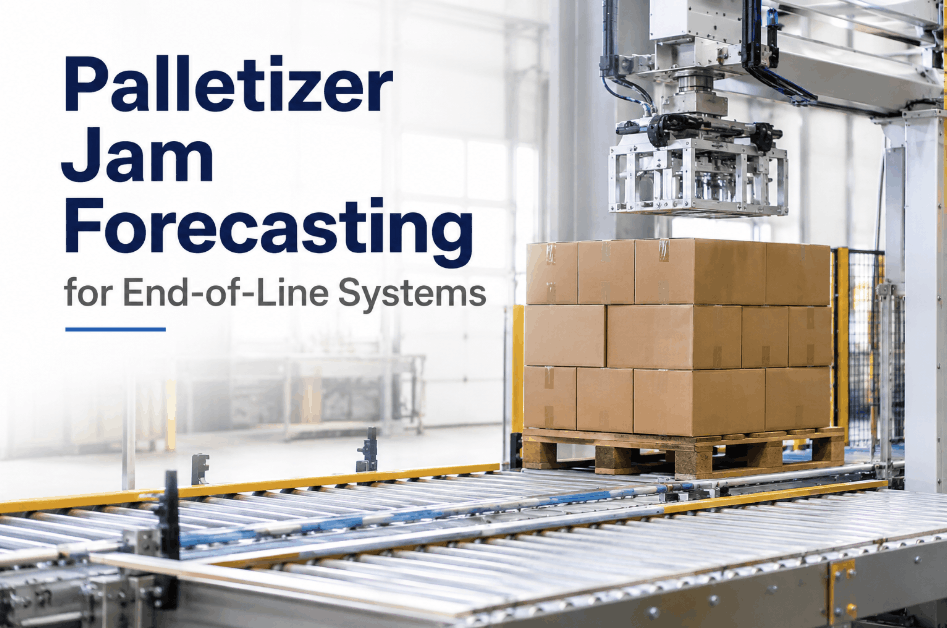
End-of-line palletizer jams are among the most disruptive stoppages in packaging operations — not because they are hard to fix, but because they are rarely forecasted. Jam events compound when carton size variation, conveyor speed inconsistency, and upstream flow misalignment go untracked across shifts. Maintenance teams using Sign Up Free on OxMaint can log palletizer fault data, monitor blockage patterns by run, and schedule predictive interventions before jam frequency disrupts throughput. A structured jam forecasting approach turns historical stoppages into proactive scheduling decisions — keeping end-of-line systems synchronized with upstream production flow and reducing unplanned stoppages at the final stage of the line.
Why Palletizer Jams Are Predictable — But Rarely Predicted
Most packaging lines treat palletizer jams as random events. In practice, jam clusters follow recognizable patterns tied to carton geometry, conveyor speed variance, and upstream accumulation pressure. Book a Demo to see how OxMaint connects fault history with production parameters to identify jam risk before it translates into end-of-line stoppages.
Six Dimensions of Palletizer Jam Forecasting
Reliable jam forecasting requires more than fault counts. It connects carton size data, conveyor speed logs, infeed pressure metrics, and maintenance history into a single operational picture. Sign Up Free on OxMaint to start building your palletizer jam baseline and give every end-of-line system the visibility it needs to run without interruption.
Fault Location and Blockage Pattern Mapping
Palletizer jams concentrate at specific positions — infeed guides, layer formers, and transfer zones. Mapping jam events by location across runs reveals repeating blockage patterns that indicate mechanical wear, misalignment, or speed mismatch before failures escalate.
Carton Size and Format Change Correlation
Jam risk increases when product format changes are not reflected in guide and sensor adjustments. Correlating jam events with carton size transitions identifies which format changes generate the highest infeed instability and where mechanical tuning is needed.
Conveyor Speed and Upstream Flow Synchronization
Speed mismatches between upstream conveyors and palletizer infeed generate accumulation pressure that leads to lane jams and layer formation errors. Tracking speed deltas by shift and product run identifies where synchronization tuning reduces jam exposure without manual intervention.
Jam Frequency Trending by Shift and Run
Jam rates that increase over a shift indicate mechanical fatigue, sensor drift, or accumulation of minor misalignments. Trending jam frequency by shift and production run reveals degradation curves that allow maintenance teams to schedule interventions during planned downtime windows.
Material Handling Condition Monitoring
Guide rail wear, belt tension loss, and sensor calibration drift all generate progressive jam risk that accumulates quietly between PMs. OxMaint tracks condition-linked work orders against jam event data to expose which asset health gaps are directly driving blockage frequency.
Predictive Maintenance Scheduling Based on Jam Risk Score
OxMaint combines fault location data, jam frequency trends, and condition monitoring inputs into a jam risk score that drives predictive PM scheduling. Instead of fixed-interval maintenance, teams intervene when risk is highest — reducing both stoppages and unnecessary PM labor.
Palletizer Jam Risk by End-of-Line Configuration
Jam accumulation patterns differ significantly across palletizer types and line speeds. Benchmarking your fault profile against configuration-specific risk ranges identifies which systems are highest priority for predictive scheduling. Book a Demo to see how OxMaint tracks palletizer jam data alongside work order history in a single platform.
| Palletizer Type | Primary Jam Driver | Typical Jam Frequency Range | Risk Level | OxMaint Maintenance Lever |
|---|---|---|---|---|
| High-Speed Inline Palletizers | Upstream speed surge, layer formation errors | 3–8 jams per shift | High | Real-time speed sync alerts + fault location tracking |
| Robotic Palletizers | Carton presentation misalignment, sensor drift | 1–4 jams per shift | Medium–High | Predictive PM scheduling based on jam risk score |
| Low-Level Conventional Palletizers | Guide rail wear, belt tension loss | 2–6 jams per shift | Medium | Condition monitoring work orders linked to fault trends |
| High-Level Palletizers | Layer squaring issues, infeed accumulation | 1–3 jams per shift | Medium | Shift-level jam frequency trending dashboards |
| Mixed-Format Lines | Changeover guide adjustment, carton size variance | 4–10 jams per changeover | High | Format-change correlation reports + tuning checklists |
How Unmanaged Jam Patterns Compound End-of-Line Risk
Palletizer jams rarely occur in isolation. They compound through accumulation pressure upstream, missed PM windows, accelerated mechanical wear, and crew response delays — each of which deepens throughput loss and increases unplanned downtime exposure. Book a Demo to see how OxMaint connects jam history with asset health data to surface compounding risk before it stops the line.
Building a Palletizer Jam Forecasting Program with OxMaint
Register Palletizer Assets and Fault Locations
Create asset records in OxMaint for each palletizer with fault location zones mapped — infeed, layer former, transfer, and discharge. This foundation enables blockage pattern analysis and jam risk scoring by system and production segment.
Log Jam Events with Carton Size and Speed Context
Capture every jam event in OxMaint with product format, conveyor speed at fault, and upstream pressure status. Structured fault logging enables correlation analysis that manual shift reports cannot support at scale.
Configure Jam Frequency Thresholds and Escalation Alerts
Set shift-level jam frequency thresholds in OxMaint that trigger escalation alerts when blockage rates exceed acceptable ranges. Automated alerts replace manual fault counting and ensure degradation trends are visible before they affect throughput targets.
Link Jam Risk Scores to Predictive PM Scheduling
Use OxMaint's work order system to trigger PM tasks based on jam risk score thresholds — not fixed calendar intervals. Risk-driven scheduling reduces stoppages without over-maintaining systems that show stable fault patterns.
Report Jam Trends Across Shifts and Product Runs
Use OxMaint's reporting dashboards to track jam frequency, fault location concentration, and conveyor speed correlation across shifts and product families. Turn palletizer fault data into governance-ready line reliability reports without manual aggregation.
Frequently Asked Questions: Palletizer Jam Forecasting
What is palletizer jam forecasting?
Palletizer jam forecasting uses historical fault data, carton size correlation, conveyor speed patterns, and mechanical condition trends to predict when and where jam events are most likely to occur — enabling preventive intervention before stoppages affect throughput.
How does carton size variation affect palletizer jam frequency?
Dimensional variation in carton geometry affects guide rail clearance, layer formation stability, and infeed timing. When size changes are not matched with mechanical adjustments, jam frequency rises sharply during the transition period following a format changeover.
How does OxMaint support palletizer jam forecasting?
OxMaint centralizes fault location logging, tracks jam frequency trends by shift and product run, links risk scores to predictive PM scheduling, and generates throughput impact reports — connecting jam data to maintenance action in one platform.
What is the relationship between conveyor speed and palletizer jam risk?
Speed mismatches between upstream conveyors and the palletizer infeed create accumulation surges that destabilize carton flow and increase blockage probability. Monitoring speed deltas in real time reduces jam risk without slowing overall line throughput.
How often should palletizer jam data be reviewed?
High-speed lines benefit from shift-level jam frequency reviews; weekly trend analysis should cover format-change correlation and location concentration. OxMaint automates both reporting layers so review cadence is maintained without additional planning overhead.