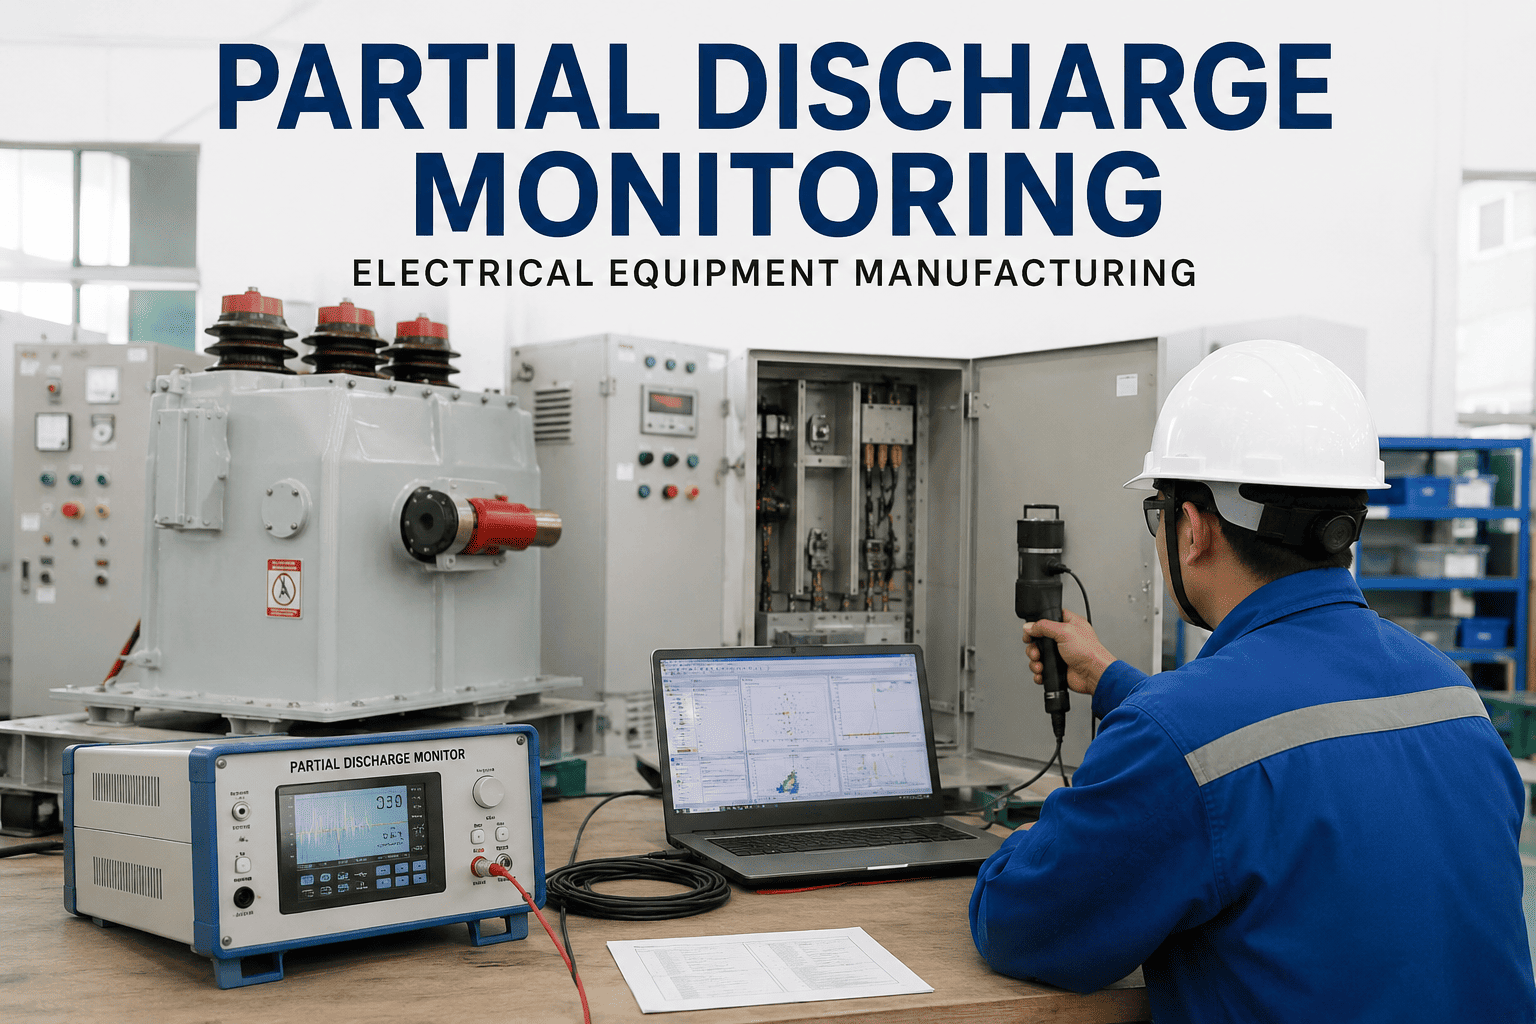
Partial discharge is the silent killer of manufacturing electrical systems — a 6.6 kV motor stator, a 15 kV switchgear busbar, or a medium-voltage cable splice can degrade for 6 to 18 months before an arc-flash event abruptly halts a production line. A single catastrophic motor failure on a critical process line routinely costs $40K–$250K in lost throughput, emergency repairs, and scrap, yet the insulation breakdown that caused it is detectable weeks ahead with the right instrumentation. This guide walks plant engineers and maintenance managers through PD detection methods, severity classification, portable versus continuous monitoring trade-offs, and the CMMS work-order triggers that turn a microvolt signal into an actionable maintenance task. Ready to move from reactive to predictive? Start Free Trial and connect your asset register today.
Why wait for the flashover when insulation failure warns you months in advance?
Partial discharge monitoring captures the electromagnetic, acoustic, and high-frequency current signatures that precede 85% of medium-voltage insulation failures — giving your team time to plan the outage instead of surviving one.
Three sensor technologies, one insulation failure
No single sensor catches every PD signature. Best-in-class plants layer TEV, HFCT, and ultrasonic detection so that surface discharge, internal void discharge, and corona are all covered.
Transient Earth Voltage
A capacitive pad mounted on the steel cladding of switchgear picks up the high-frequency voltage impulses that leak through insulation defects to ground. Ideal for MV switchgear panels, busbars, and cable terminations behind closed doors during normal operation.
High-Frequency Current Transformer
A split-core clamp around the cable earth sheath or motor grounding strap captures the nanosecond current pulses flowing through insulation breakdown to ground. The workhorse for in-service MV motors, generators, and long cable runs where permanent access is limited.
Airborne / Contact Ultrasonic
Surface discharge and corona ionize air, producing faint 40 kHz hissing that a handheld or fixed ultrasonic sensor converts to an audible tone. Excellent for dry-type transformers, open busbars, and outdoor terminations where TEV and HFCT can't reach.
Reading PD magnitude: when does noise become an emergency?
A single PD reading is just a number — context turns it into a decision. The thresholds below align with IEEE 1434 and IEC 60270 guidance for air-insulated MV equipment, and are the most widely used bands for manufacturing plant triage.
| Severity Band | PD Magnitude (pC) | Typical Condition | Recommended Action | Work Order Priority |
|---|---|---|---|---|
| Normal | < 100 pC | Healthy insulation, background noise only | Continue routine quarterly survey | None |
| Elevated | 100–500 pC | Early void or surface tracking present | Add asset to watchlist, re-test in 30 days | P4 — Planned |
| High | 500–2,000 pC | Active degradation, failure risk within 3–9 months | Schedule outage, visual + IR inspection | P2 — Within 30 days |
| Critical | > 2,000 pC | Severe PD, imminent dielectric breakdown | Immediate load reduction, emergency outage | P1 — Within 24 hrs |
A 180-asset chemical plant in Texas ran quarterly TEV spot-checks across 24 MV switchgear cubicles. One feeder cubicle climbed from 180 pC in March to 1,400 pC in June — a 677% rise in 90 days. The team booked a planned outage in week three, found tracking on a molded busbar support, and replaced the $1,800 component overnight. The same defect, left to flash over, would have cost an estimated $96,000 in downtime, resin scrap, and emergency repairs. Payback on the PD survey program: under one quarter.
Spot surveys or 24/7 sensors — which earns its budget?
A handheld PD detector costs $8K–$18K and a trained technician can survey 15–25 assets per day. A permanently installed continuous monitoring system runs $1,200–$4,500 per asset but streams trend data every minute. The right answer depends on criticality, duty cycle, and how fast failures escalate.
Walk-around spot testing
- Cadence: quarterly to annual
- Coverage: 15–25 assets/day/tech
- Best for: non-critical, redundant, or low-duty assets
- Strength: low upfront cost, fleet-wide sweep
- Limit: misses fast-escalating failures between surveys
Permanently installed sensors
- Cadence: 1-minute trend data, 24/7
- Coverage: every critical MV asset, simultaneously
- Best for: single-line-of-defense motors, main feeders
- Strength: catches 30-day escalations, integrates to CMMS
- Limit: higher capex, requires network and alarm setup
If an unplanned failure of the asset costs more than 10× the continuous monitor's installed price, hard-mount the sensors. Below that ratio, quarterly portable surveys are sufficient.
From microvolt signal to automatic work order
PD data is worthless if it lives in a spreadsheet. Mature programs wire sensor thresholds directly into the CMMS so that a crossed severity boundary auto-generates a work order with the right priority, checklist, and parts pre-filled.
Threshold breach auto-creates WO
When continuous PD crosses 500 pC for 60 consecutive minutes, the gateway posts a webhook to the CMMS API. A P2 work order is created against the asset ID, tagged "PD-Elevated," and assigned to the electrical reliability queue — no human triage required.
Rate-of-rise escalates priority
A 20% PD increase inside 7 days signals accelerating degradation. The CMMS bump-rule promotes the existing WO from P4 to P2, shortens the due date by 14 days, and notifies the reliability engineer via SMS — catching the 30-day-to-failure curve that static thresholds miss.
Pattern recognition flags defect type
Phase-resolved PD pattern analysis classifies the defect (void, surface, corona, floating component). The classification is appended to the WO description so the assigned electrician arrives with the correct test gear, PPE level, and replacement parts already staged.
Closed-loop verification after repair
Post-repair PD readings are logged against the closed WO. If the trend drops below 100 pC within 14 days, the WO auto-closes with a "verified" tag. If it doesn't, the WO reopens and escalates — closing the feedback loop that most plants never build.
The 14-month warning window most plants never use
Insulation degradation is not sudden. From the first microscopic void to flashover, the arc travels a predictable path — and each stage leaves a detectable signature.
Insulation void forms
Thermal cycling, vibration, or manufacturing defect opens a 0.1 mm delamination inside the stator resin. No detectable PD yet — but the seed is planted.
First PD signatures appear
Discharge begins across the void at 20–80 pC, visible only on a continuous HFCT trend. A quarterly spot survey will almost certainly miss it.
PD crosses 500 pC
Void grows, surface tracking begins. TEV and ultrasonic now also detect the defect. This is the last practical window for a planned outage before failure risk steepens.
PD exceeds 2,000 pC
Treeing channels bridge 30–60% of insulation thickness. Dielectric strength is compromised. Random flashover becomes statistically probable at any voltage transient.
Catastrophic failure
Insulation punctures, phase-to-ground fault trips the breaker, motor rewinding or replacement required. Production line down for 18–72 hours. The 14-month warning was there the entire time.
Stop inspecting electrical assets by calendar — start monitoring by condition.
Oxmaint connects PD sensors, portable survey results, and CMMS work orders into one closed loop. Deploy in under a week; see your first trend on day one.
PD monitoring in manufacturing — what teams actually ask
Which assets in a manufacturing plant actually need PD monitoring?
Any medium-voltage asset (1–35 kV) whose unplanned failure would halt production or create a safety event: large MV induction and synchronous motors (typically 500 HP and above), main switchgear feeders, dry-type and oil-filled transformers above 500 kVA, and long MV cable runs feeding critical process areas. Low-voltage assets (480 V and below) rarely warrant PD monitoring — IR thermography and ultrasound are more cost-effective there.
How often should we run portable PD surveys if we don't have permanent sensors?
For critical MV assets, quarterly TEV and ultrasonic walk-downs are the industry minimum; monthly is better for equipment operating above 80% load factor or in high-humidity environments. Annual surveys are acceptable only for redundant or spared assets. Every survey should log magnitude, phase pattern, and environmental conditions so the next technician can trend the data — point-in-time readings without history have limited diagnostic value. You can Book a Demo to see how Oxmaint auto-trends portable readings alongside continuous sensor data.
Can PD monitoring detect cable failures, or is it only for motors and switchgear?
Yes — HFCT sensors clamped on the cable earth bonding are one of the most effective tools for detecting joint degradation, water treeing, and shield damage in MV cables up to several hundred meters. Online cable PD does have higher noise floors than offline VLF testing, so it works best for trend-based monitoring rather than absolute pC accuracy. Most cable PD programs combine annual offline VLF tan-delta with continuous online HFCT trend monitoring.
What is the difference between apparent charge in pC and dB readings on my TEV detector?
Picocoulombs (pC) measure apparent charge — the energy released per discharge pulse — and are the IEC 60270 standard unit, allowing comparison across instruments and plants. Decibels (dB) are a relative TEV magnitude reported by many handheld detectors; they are instrument-specific and not directly convertible to pC. Use pC for cross-asset benchmarking and severity classification; use dB for trend comparisons on the same instrument over time. Always document which unit a threshold is written in.
How does PD monitoring integrate with an existing CMMS like Oxmaint?
Continuous sensors post threshold breaches and trend deltas to the CMMS via API or MQTT; portable survey results are entered manually or uploaded via CSV. The CMMS maps each reading to an asset ID and, based on severity rules, auto-generates a work order with the correct priority, checklist, parts list, and assignee. Post-repair readings close the loop by verifying the fix worked. To see the integration in action, Start Free Trial and connect your asset register in minutes.
Your next unplanned MV failure is already developing. Catch it now.
Join the manufacturing plants that turned 14 months of warning into zero hours of unplanned downtime. Deploy Oxmaint PD monitoring in under a week.
Free 14-day trial · No credit card