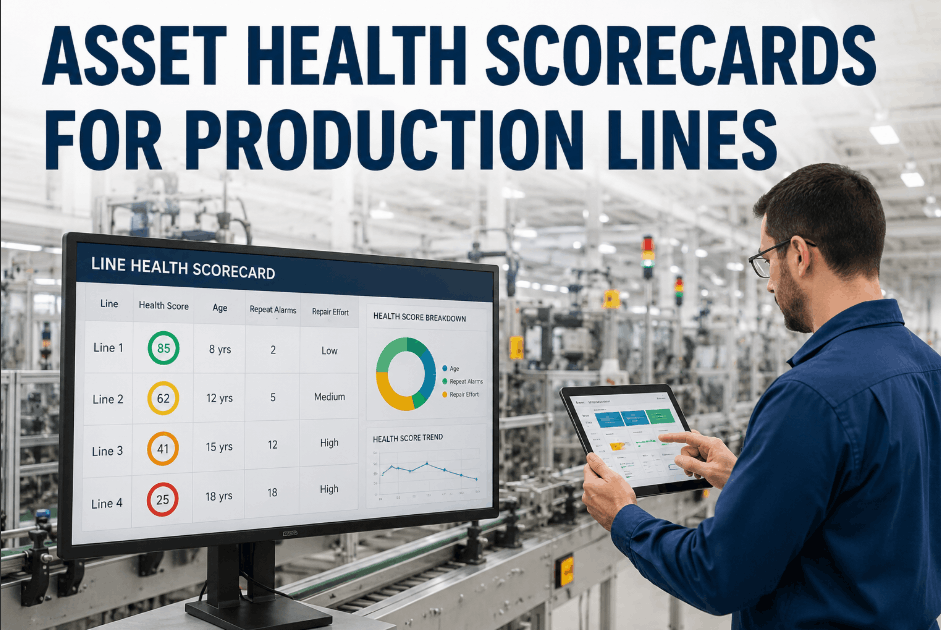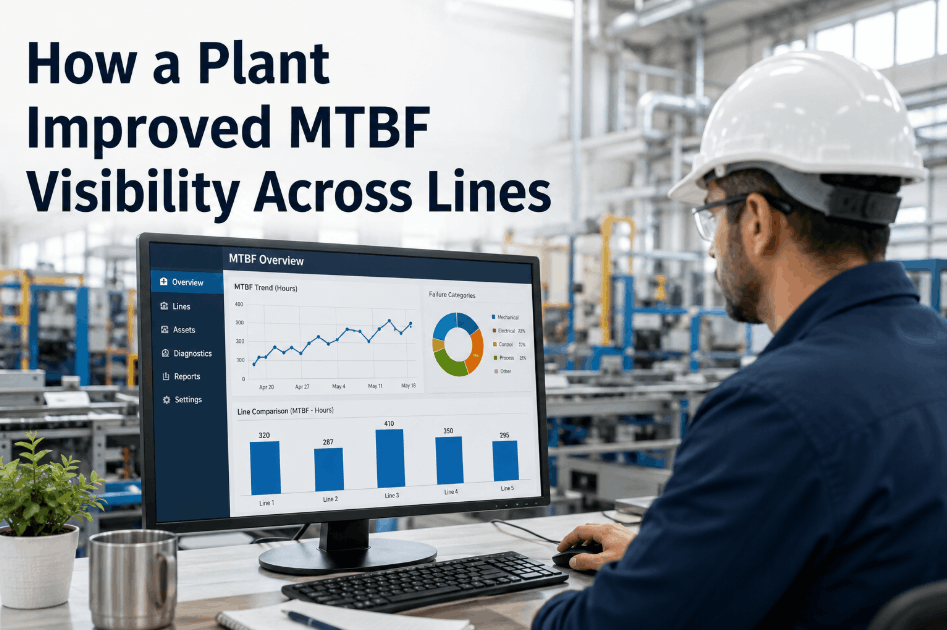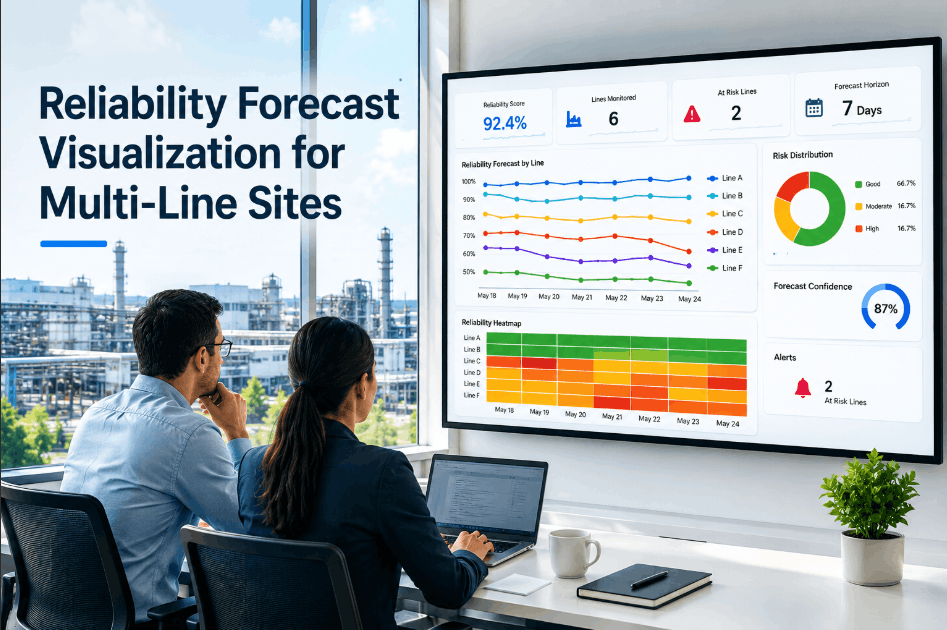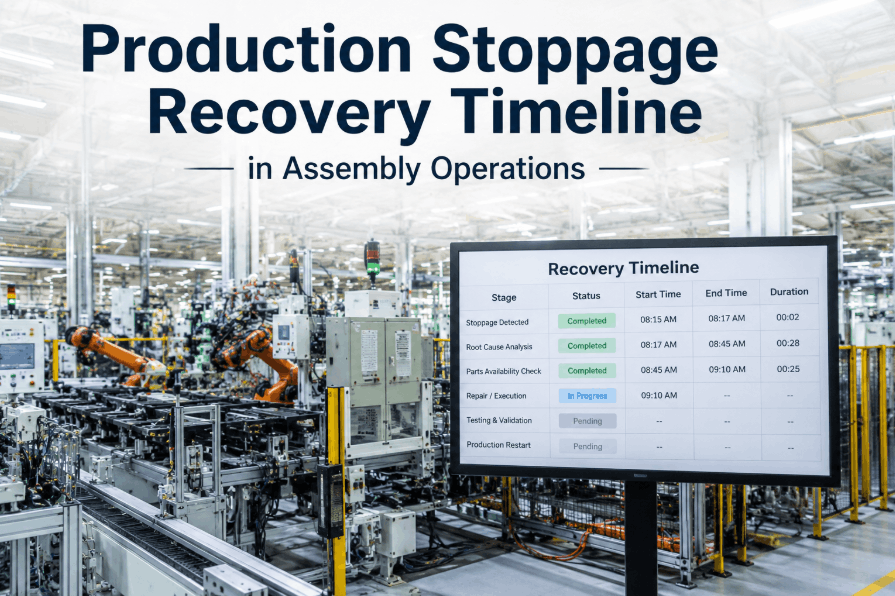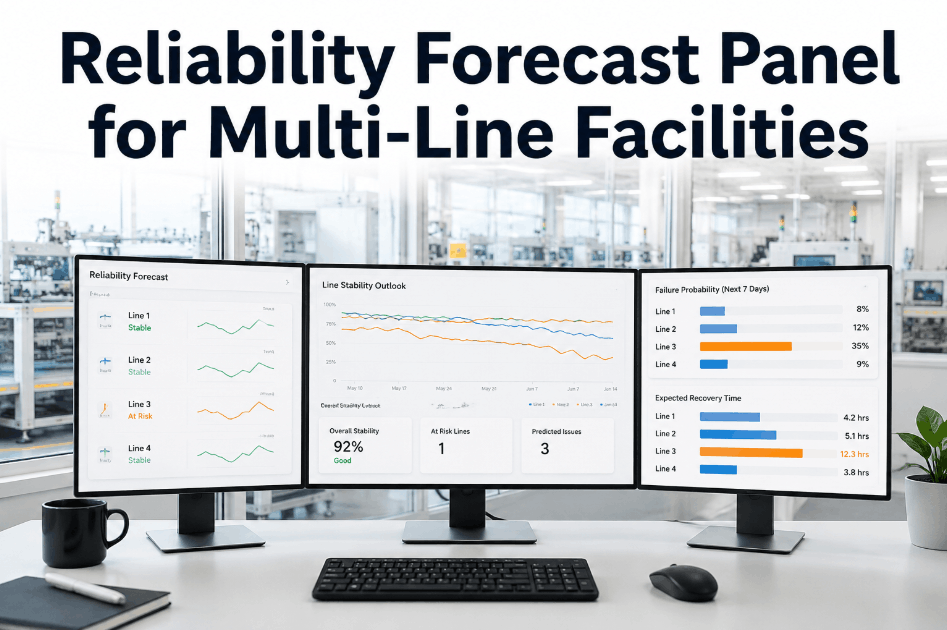
Multi-line facilities rarely fail all at once—reliability gaps build quietly on one line while production leaders focus on another. Without a forecast view that compares stability, failure probability, and recovery timing across lines side by side, these gaps stay invisible until they cause a stoppage. Sign Up Free on Oxmaint to bring asset health scores and predictive trends from every line into a single reliability forecast panel that production leaders can review before issues surface.
Why Multi-Line Facilities Need a Forecast View
Line-by-line dashboards show what's happening now, but reliability planning requires comparing what's likely to happen next across the whole facility. Book a Demo to see how Oxmaint's predictive scoring brings multi-line trends into a single forecast view.
What Belongs on a Reliability Forecast Panel
A composite health score per line, built from asset condition data and recent fault frequency.
Predictive scores showing which assets are trending toward failure based on sensor and runtime data.
Estimated time to restore an asset to normal operation if a flagged issue progresses to failure.
Direction of change for each line's stability score over recent weeks, highlighting emerging risk early.
Setting Up a Forecast Panel for Your Facility
Sign Up Free to connect assets and sensors across your lines in Oxmaint, then Book a Demo to see predictive scores populate a unified facility view.
Link IoT sensors, PLCs, and asset records across all production lines into Oxmaint.
AI models calculate stability and failure probability scores per asset and per line.
View trend signals across all lines to identify where reliability gaps are emerging first.
Auto-generated work orders address flagged assets before failure probability increases further.