Most manufacturing plants still rely on monthly OEE roll-ups that arrive two weeks after the losses have already compounded — by the time you see a 12% dip in availability, the defective batch, the missed shipment, and the overtime cost are already locked in. Shift-level OEE monitoring collapses that feedback loop from 30 days to under 60 minutes, giving supervisors the granularity to spot a dragging shift, a misaligned handover, or a creeping micro-stop before it metastasizes into a red week. Plants that move from monthly to shift-by-shift tracking typically recover 4–9 OEE points inside the first quarter, because the people closest to the machine finally get signal fast enough to act. This guide walks through shift board design, hour-by-hour tracking cadence, handover metrics, and the operator-supervisor-maintenance loop that closes the gap. Ready to see it live on your floor? Start Free Trial and configure your first shift OEE board in under an hour.
Why does the night shift always run 11 points behind — and why won't a monthly report ever tell you?
A monthly OEE number is an autopsy. Shift-level OEE is a pulse check. When supervisors can see availability, performance, and quality decomposed hour-by-hour, they intervene while the loss is still small — not three weeks later in a PowerPoint.
A monthly OEE report is a tombstone, not a tool
By the time a monthly report flags a 6-point OEE drop on Line 4, the plant has already absorbed roughly $48,000 in unrecovered capacity, 2.1 missed shipment windows, and a quality credit issued to a tier-1 customer. The loss happened on a Tuesday at 2:14 AM — and nobody with authority to act knew until the 28th.
Anatomy of a shift OEE board that supervisors actually read
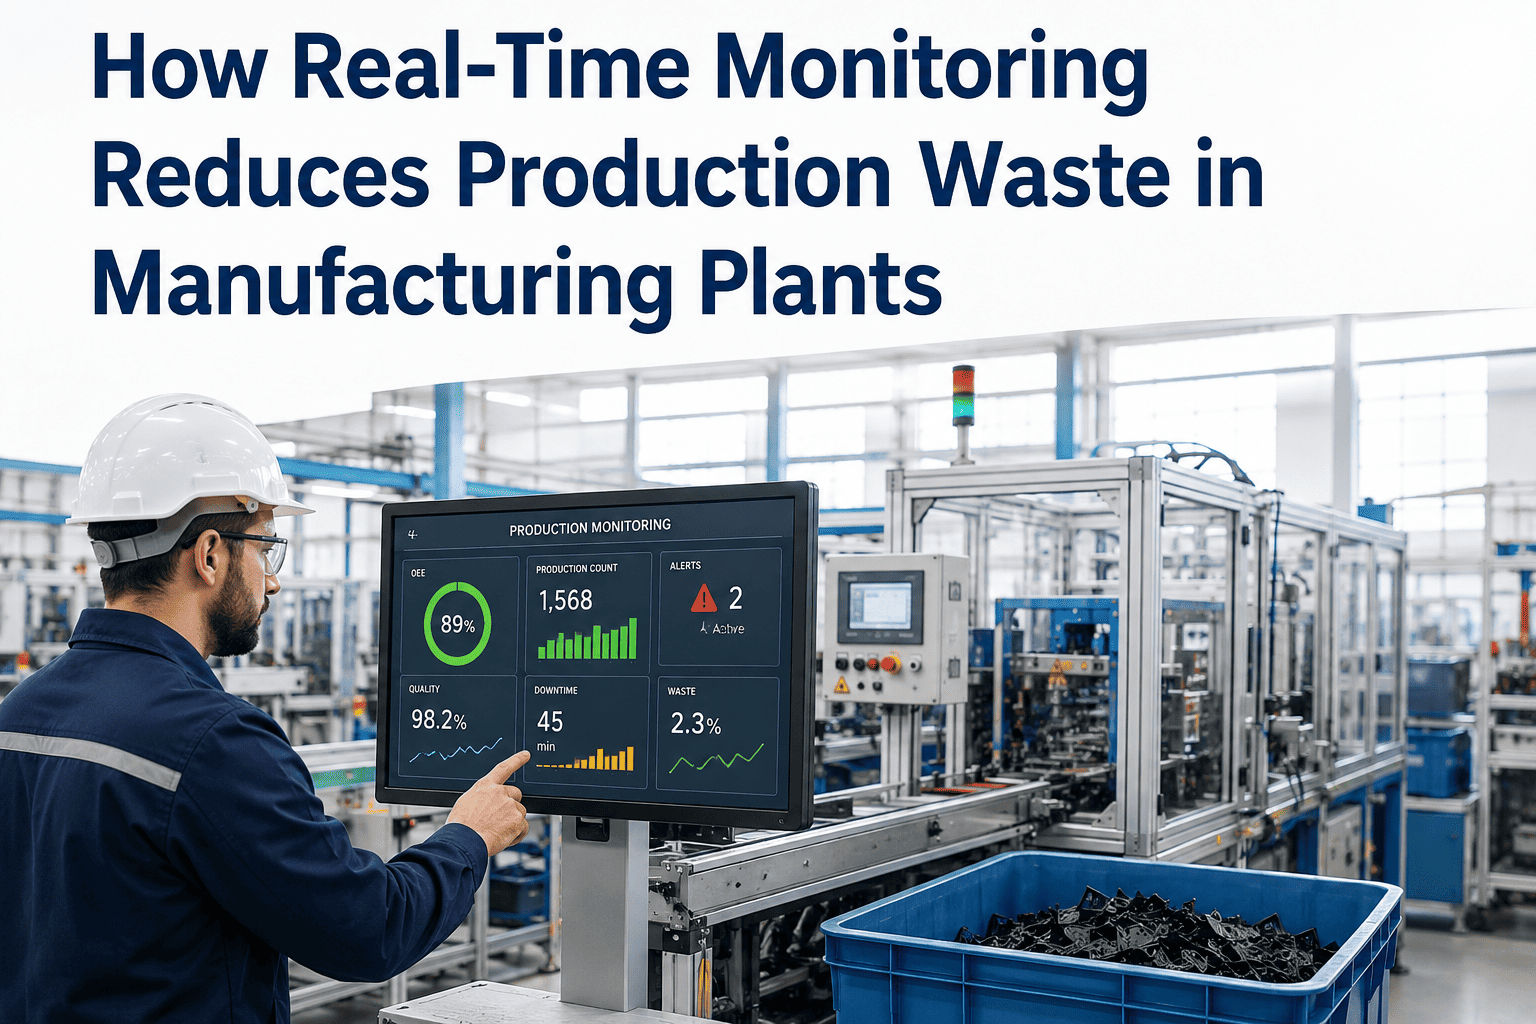
A shift board is not a dashboard — it is a decision surface. It should answer one question in under 10 seconds: "Is this shift on target, and if not, where is the bleed?" The board below decomposes OEE into its three constituent losses and maps each to a response owner.
The hour-by-hour tracking cadence that catches losses while they are still small
World-class shift OEE tracking follows a six-beat cadence across an 8-hour shift. Each beat has a checkpoint, a threshold, and a named owner — no anonymous "the team should" language. Plants using this cadence report catching 73% of micro-stops before they compound into a double-digit availability loss.
Supervisor reviews the previous shift's OEE breakdown, open maintenance flags, and any quality holds. Target: handover completed in under 7 minutes with a signed digital log.
Availability and performance logged for the first 60 minutes. If availability is under 90%, maintenance is paged automatically before the loss compounds.
Supervisor checks the hour-by-hour curve. A flat or declining performance line triggers a process-engineer huddle — not an end-of-shift write-up.
First-pass yield sampled against the 96% threshold. Any deviation triggers an immediate SPC chart pull and, if needed, a tool-change decision before the last three hours.
If the shift is below OEE target, this is the last realistic intervention window. Supervisor allocates overtime, reassigns operators, or calls in a standby tech.
OEE locked, top-3 loss reasons coded, and handover note generated automatically for the incoming shift. No clipboards, no recency bias.
The shift OEE formula — and what it looks like on a real line
Shift OEE is not a new metric — it is the same ISO 22400-aligned formula, bounded to a single shift window. The power is in the granularity, not the math. Here is the formula and a worked example from a 180-asset automotive components plant.
- Planned run time: 480 min (8 hr shift)
- Downtime: 54 min (2 changeovers, 1 unplanned stop, 1 micro-stop cluster)
- Availability: (480 − 54) ÷ 480 = 88.8%
- Performance: 408 min run, 372 min actual output at standard cycle = 91.2%
- Quality: 3,840 units produced, 3,763 first-pass = 98.0%
- Shift OEE: 0.888 × 0.912 × 0.980 = 79.4%
Why shift-to-shift variance is the most expensive number you are not tracking
When the same line runs 86% OEE on A-shift and 74% on B-shift with identical equipment, the gap is not a machine problem — it is an operator, setup, or handover problem. Plants that decompose OEE by shift routinely find 8–14 point swings between crews, and most of the loss clusters in the first 90 minutes of the incoming shift.
- Monthly report shows 79% OEE — "acceptable"
- The 12-point A-vs-B gap is invisible
- Handover takes 22 minutes on average, unmeasured
- Operator training gaps guessed, not identified
- Micro-stops blamed on "the machine"
- Supervisor sees the B-shift dip by hour 2
- A-vs-B variance surfaces automatically, shift over shift
- Handover time logged; target under 7 minutes
- Training targeted to the specific crew + loss code
- Micro-stops coded to root cause within the shift
See your shift OEE live — before the next shift starts
Connect your machines, configure your shift board, and watch hour-by-hour OEE populate in real time. Most plants are live in under 48 hours.
Shift-level OEE monitoring — the questions plant managers ask first
The formula is identical — availability × performance × quality. The difference is the time boundary. Shift OEE is calculated for a single crew's 8- or 12-hour window, which means you can compare shifts, expose handover losses, and intervene within the same shift instead of waiting for a monthly roll-up that obscures the root cause.
In most cases, no. If your PLCs, SCADA, or CMMS already log run time, stop events, and output counts, shift-level OEE can be calculated from existing data streams. A quick audit of your current data sources — which you can kick off with a Book a Demo call — usually confirms you already have 80% of what you need.
World-class is 85%, but most discrete manufacturing plants sit between 60% and 75%. A more useful target is your best-performing shift's trailing 30-day average plus 3 points — that gives you a crew-specific benchmark that drives improvement without setting an unreachable bar.
Standard practice is to attribute production and downtime to the shift that was actively running when the event occurred. Overlap periods (typically 15–30 minutes) are assigned to the outgoing shift for availability and the incoming shift for quality, since setup errors surface in the new crew's output. Most modern CMMS platforms handle this attribution automatically.
Plants that implement shift OEE with an hour-by-hour board typically recover 4–9 OEE points within the first 90 days. For a mid-volume line producing $480K/month in output, each recovered point is worth roughly $5,600 in reclaimed capacity — meaning a 6-point recovery pays back most software investments inside one quarter. You can Start Free Trial and begin measuring immediately.
Stop reading last month's losses. Start fixing this shift's.
Configure your first shift OEE board in under an hour. No PI tags to wrestle, no six-month implementation, no credit card to begin.
Free 14-day trial · No credit card