Most power plant maintenance managers can tell you their current backlog size and how many work orders closed last week. Very few can tell you their EFOR trend over the last four quarters, what their MTBF is for the fuel gas system compressors, or whether their PM compliance rate is actually driving down unplanned forced outages or just creating the appearance of activity. The difference between the two groups is not effort — it is whether reliability KPIs are measured, tracked, and visible enough to change decisions at the shift level, not just reported in quarterly management reviews. EFOR, EAF, MTBF, MTTR, and PM compliance are not reporting tools; they are operational instruments. When they are tracked correctly and displayed at the right level of granularity, they catch deteriorating reliability trends three to six weeks before the trend produces an outage. This guide explains how to build, populate, and act on a power plant reliability KPI scorecard that actually drives maintenance decisions. To see how OxMaint's live dashboards surface these KPIs at the unit and system level, book a 30-minute demo or start a free trial.
Power Plant Reliability · KPI Scorecards · Measurement Framework
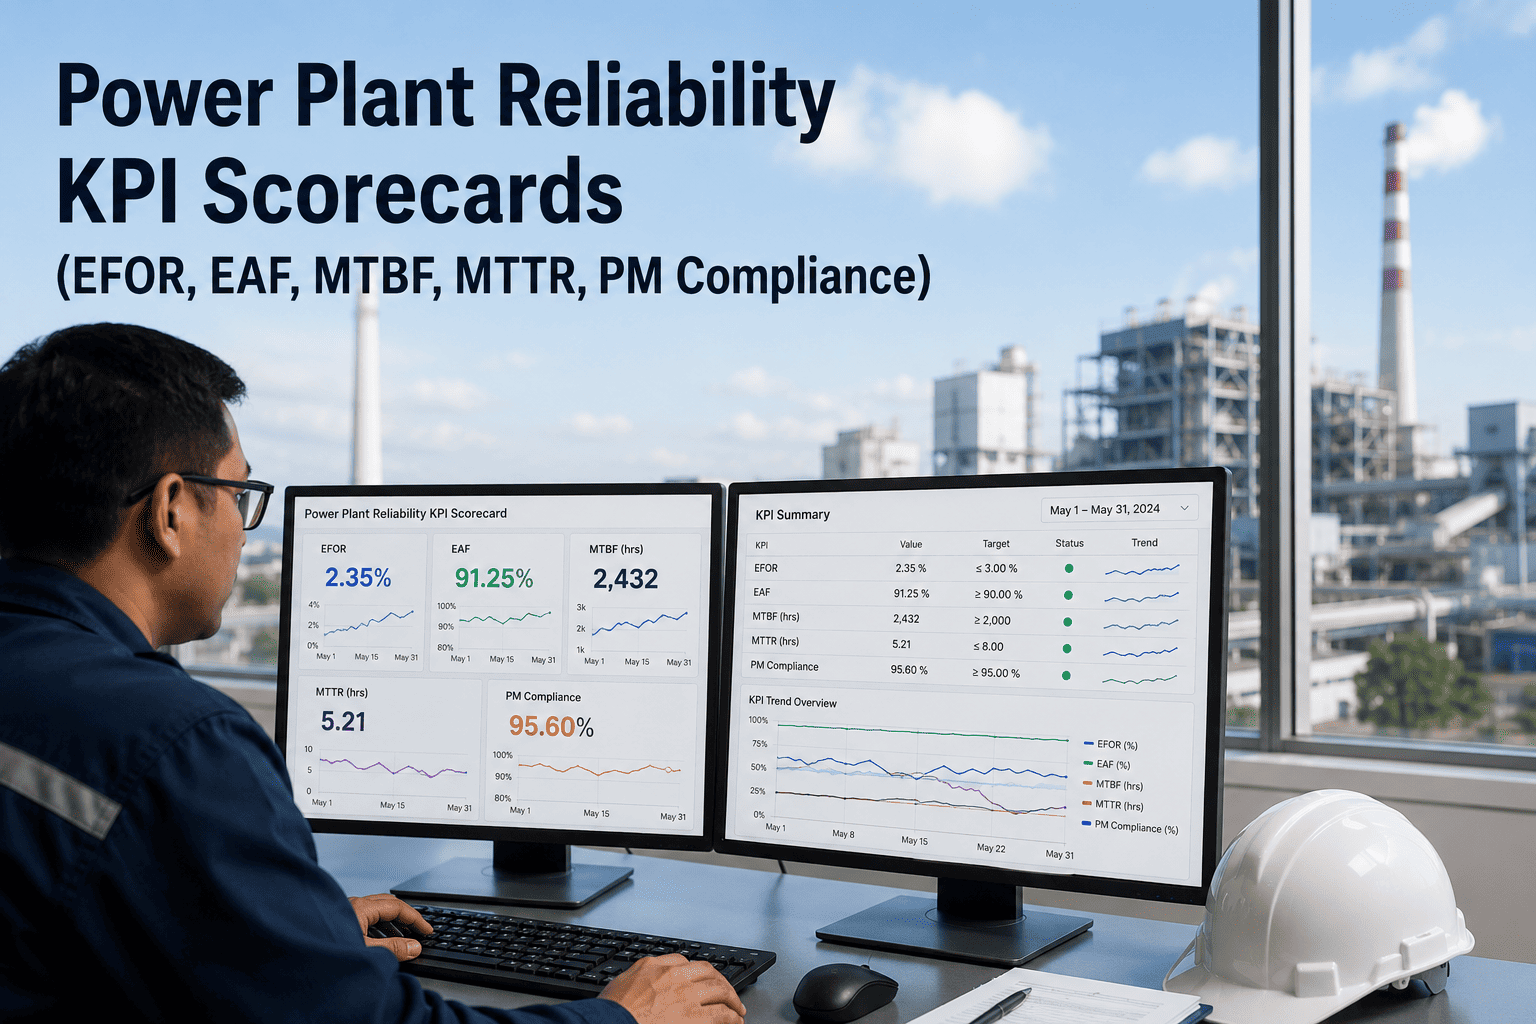
Power Plant Reliability KPI Scorecards: EFOR, EAF, MTBF, MTTR & PM Compliance
Only 56% of plants track PM completion — and even fewer track the five core reliability metrics that predict outage risk before it becomes downtime. This is the measurement framework that separates plants managing reliability from plants reacting to it.
EFOR
Equivalent Forced Outage Rate
EFOR = (Forced Outage Hours + Equivalent Forced Derated Hours) / (Available Hours + Forced Outage Hours) × 100
What it measures: The percentage of time a unit was unavailable or derated due to forced (unplanned) outages. EFOR is the primary reliability metric for generation capacity planning.
Industry Benchmark
Best-in-class gas turbine EFOR: 2–4%. Industry average: 6–9%. EFOR above 10% indicates a systemic reliability problem requiring root cause analysis.
EAF
Equivalent Availability Factor
EAF = (Available Hours − Equivalent Scheduled Derated Hours − Equivalent Forced Derated Hours) / Period Hours × 100
What it measures: The fraction of the period during which the unit was available at full rated capacity. EAF captures both planned outages and derated operation — making it the most complete measure of overall unit availability.
Industry Benchmark
EAF above 90% is considered strong for combined cycle units. Planned outage schedules typically account for 5–8% of annual hours, so the forced component target should be below 3%.
MTBF
Mean Time Between Failures
MTBF = Total Uptime Hours / Number of Failures in Period
What it measures: The average operating time between unplanned failures for a specific asset or system. A declining MTBF trend on a system that previously held steady is an early warning signal that maintenance strategy, PM effectiveness, or asset condition is deteriorating.
Industry Benchmark
MTBF targets are asset-specific. The actionable threshold is a 20% decline over two consecutive quarters on a previously stable asset — this warrants a structured failure investigation.
MTTR
Mean Time to Repair
MTTR = Total Repair Hours / Number of Repair Events in Period
What it measures: The average time to restore a failed asset to service. MTTR inflation is usually driven by spare parts delays, skills gaps, or poor work order documentation — not the actual repair complexity. Industry-wide MTTR has risen from 49 minutes to 81 minutes on average, driven largely by logistics failures, not technical ones.
Industry Benchmark
MTTR targets vary by equipment class. The key signal is trend direction — MTTR increasing quarter-over-quarter on the same asset class indicates a storeroom, skills, or procedure problem.
PMC
PM Compliance Rate
PM Compliance = Completed PMs within Schedule Window / Total Scheduled PMs × 100
What it measures: The percentage of preventive maintenance tasks completed within their scheduled window. PM compliance is the leading indicator for EFOR — plants with PM compliance above 90% consistently show 30–40% lower EFOR than plants below 70% compliance. Only 56% of plants currently track this metric.
Industry Benchmark
Target: above 90% on A-criticality assets. Below 80% on critical assets is a systemic production-versus-maintenance conflict that requires leadership intervention to resolve.
OxMaint Reliability Dashboards
All Five KPIs Live on One Dashboard — Updated With Every Work Order Closure
OxMaint calculates EFOR, EAF, MTBF, MTTR, and PM compliance rates automatically from work order data, asset records, and production event logs — and displays them at the unit, system, and equipment class level. No manual spreadsheet extraction. No waiting for the monthly report. Your reliability scorecard is live, and it updates in real time as your team closes work orders on the floor.
Scorecard Structure
How to Structure a Power Plant Reliability Scorecard That People Actually Use
A reliability scorecard that sits in a monthly management report is a reporting tool. A reliability scorecard that is visible on the shift floor, updated in real time, and reviewed in the daily morning meeting is an operational instrument. The difference is structure, not data. Here is the three-tier scorecard structure used by high-performing power plant maintenance teams.
EFOR (%) per unit — vs plan and vs same period prior year
EAF (%) per unit — vs contracted availability target
Maintenance cost per MWh generated — vs budget
Total unplanned forced outage hours — trend over 12 months
Year-to-date PM compliance — by unit and by system
Decision context: Capital allocation, maintenance contract review, major outage scope planning, regulatory compliance reporting
MTBF per equipment class and system — weekly trend
MTTR per equipment class — broken down by parts delay, labour, documentation
PM compliance by system — flagging any system below 80%
Work order backlog age — count of orders over 30 and 60 days
Top 10 repeat failures — assets with 2 or more unplanned events in 90 days
Planned-to-unplanned ratio — week by week trend
Decision context: PM interval adjustments, spare parts reorder, FMEA updates, crew skill deployment, short-interval reliability investigations
Overdue PMs on critical assets — requires same-shift resolution or escalation
Active work order count per technician — workload balance visible
Any asset with open operator-reported symptoms — status and disposition
Emergency work orders raised in last 24 hours — root cause recorded or pending
Decision context: Shift prioritisation, technician deployment, immediate escalation of developing failures before they become outages
Benchmarks and Target Setting
Industry Benchmarks for Power Plant Reliability KPIs — 2025/2026
| KPI |
World Class |
Good Performance |
Industry Average |
Requires Attention |
| EFOR (Gas Turbine) |
Below 2% |
2 – 4% |
6 – 9% |
Above 10% |
| EAF (Combined Cycle) |
Above 94% |
90 – 94% |
85 – 90% |
Below 82% |
| PM Compliance (Critical Assets) |
Above 95% |
90 – 95% |
70 – 85% |
Below 70% |
| Planned : Unplanned Ratio |
Above 4:1 |
3:1 – 4:1 |
1.5:1 – 2:1 |
Below 1:1 |
| MTTR (Rotating Equipment) |
Below 2 hrs |
2 – 4 hrs |
4 – 8 hrs |
Above 12 hrs |
| Work Order Backlog Age |
Less than 15 days (avg) |
15 – 30 days |
30 – 60 days |
Above 60 days |
Sources: NERC GADS 2024, EPRI Maintenance Best Practices, Deloitte 2024, MaintainX 2025 State of Maintenance Report
Leading vs Lagging Indicators
The Indicator Problem: Most Plants Measure What Already Happened
EFOR and MTBF are lagging indicators — they tell you that a failure occurred and how long it has been since the last one. They are essential for trending and benchmarking, but they cannot prevent the next failure on their own. Leading indicators are the measurements that predict deteriorating reliability before a failure event occurs. High-performing power plant maintenance programmes track both.
EFOR — forced outage rate after events occur
MTBF — time between failures already recorded
MTTR — repair time after the failure has started
Unplanned downtime hours — production already lost
Emergency work order count — reactive events already triggered
PM compliance rate — are scheduled interventions happening?
Overdue PM count on critical assets — risk accumulating now
Vibration trend on rotating equipment — weeks before failure
Inlet dP trend on turbines — output risk building daily
Operator-reported symptoms in CMMS — early signals from the floor
Work order backlog age on critical systems — resolution capacity
Frequently Asked Questions
Power Plant Reliability KPIs — Questions Answered
What is the difference between EFOR and EAF, and which should we report to the grid operator?
EFOR measures only the forced (unplanned) unavailability component and is the primary metric for reliability risk assessment. EAF includes both planned and forced components, making it the correct metric for capacity availability reporting to grid operators and offtake agreement compliance. Most power purchase agreements specify an EAF threshold.
OxMaint calculates and reports both metrics automatically.
How frequently should reliability KPI scorecards be reviewed — and with whom?
The three-tier cadence above is the industry-validated structure: daily at shift level for overdue PMs and active failures; weekly at planning and engineering level for MTBF trends, top recurring failures, and backlog; monthly at management level for EFOR, EAF, and cost per MWh. The critical failure mode is tracking KPIs only monthly — by which point the trend that triggered the outage is three to four weeks old.
Book a demo to see live dashboard examples.
Our CMMS does not automatically calculate MTBF and MTTR. How do we get started?
If work orders are being closed with timestamps and asset tags, MTBF and MTTR can be calculated from existing data — the challenge is that most CMMS systems require a reliability module or custom report. OxMaint calculates MTBF and MTTR natively from work order closure data, with no additional configuration required. The only prerequisite is that work orders are being correctly tagged to the right asset in the hierarchy.
How many months of KPI data are needed before scorecard trends become meaningful?
Three months of clean work order data is sufficient to establish baselines for MTTR, PM compliance, and backlog metrics. MTBF and EFOR require at least 6–12 months of consistent data before trend lines are statistically reliable, because failure events are relatively infrequent. Start tracking from day one — the baseline established in the first quarter becomes the comparison point for every subsequent quarter.
Can OxMaint integrate KPI data with our existing power plant historian and ERP system?
Yes. OxMaint connects to plant historians (OSIsoft PI, GE Proficy, Honeywell PHD), SCADA systems, and ERP platforms via API. Production event data from the historian feeds directly into EAF and EFOR calculations, eliminating manual data entry between systems. Integration requirements are reviewed during the implementation scoping session.
Start a free trial to explore the integration options.
OxMaint · Reliability KPI Platform
From Monthly Reports to Real-Time Reliability Visibility — in One Quarter
Plants that track EFOR, EAF, MTBF, MTTR, and PM compliance in real time at the unit and system level consistently outperform plants that rely on monthly spreadsheet extracts. OxMaint gives your power plant a live reliability scorecard built from work order data your team is already generating — no new data collection required, no manual report assembly, and no waiting for month-end to find out that last week's EFOR crossed the warning threshold.