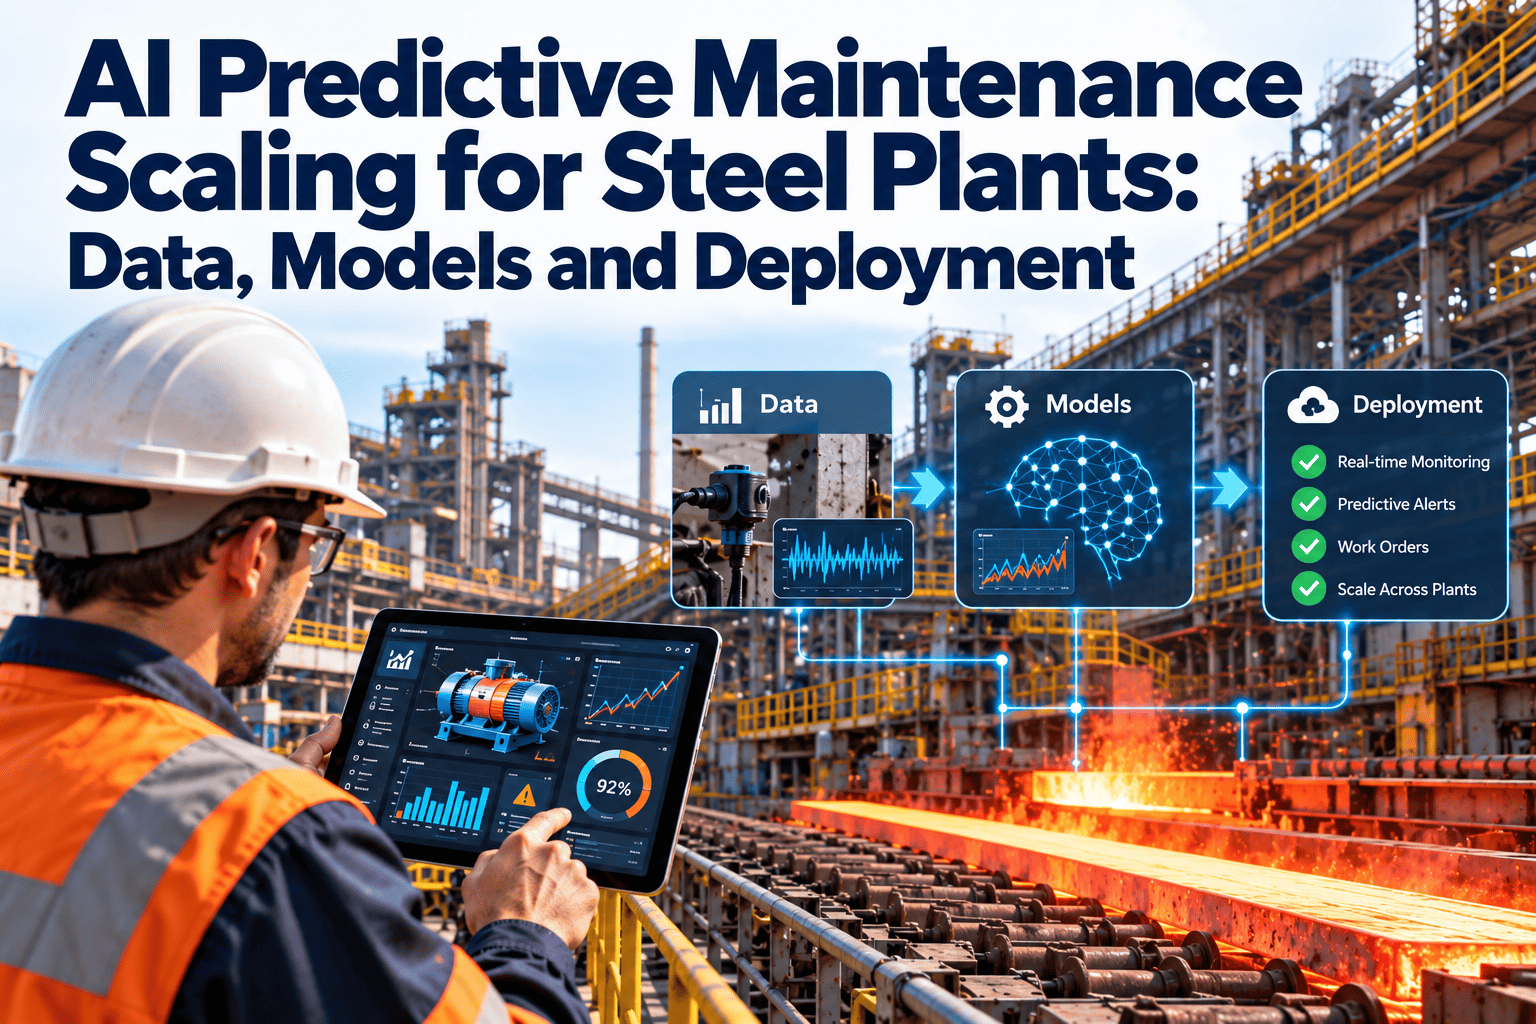
Most steel plants can show that AI predictive maintenance works on a single asset. Far fewer can repeat that result across blast furnace blowers, caster segment drives, mill gearboxes, descaling pumps and overhead cranes. The gap is rarely the algorithm. It sits in sensor data that was cleaned by hand for the pilot, models that nobody retrains, and alerts that never become planned work. This guide covers the data, models and deployment steps needed to scale, and how Oxmaint maintenance management software turns predictions into tracked work orders.
Scale AI Predictive Maintenance From One Pilot to the Whole Plant
Scaling means repeating three things on every asset class: data you can trust, models that stay accurate, and a deployment path that ends in a work order. Build each one once, then reuse it.
- Tagged signals mapped to asset IDs
- Signal health checks
- Operating state context
- Failure labels from work orders
- Rules for known fault signatures
- Anomaly detection for normal behavior
- Trend and remaining life estimates
- Drift monitoring and retraining
- Severity and confidence scoring
- Inspection and work order creation
- Scheduling into outage windows
- Feedback at work order closure
Why steel plant AI pilots stall before they scale
A pilot succeeds because a small team protects it. Someone repairs the data, hand-tunes thresholds and reviews every alert. Scaling removes that protection, so the plant needs a repeatable system instead of heroic effort.
| Dimension | Single-asset pilot | Plant-wide standard |
|---|---|---|
| Data preparation | Cleaned manually by a specialist for one dataset | Automated signal health checks on every incoming stream |
| Asset identity | Sensor tags known to the pilot team only | Every tag linked to one asset record in the register |
| Model upkeep | Trained once and left running | Monitored for drift and retrained on a defined cycle |
| Alert handling | Reviewed by the engineer who built the model | Scored, routed and tracked as inspections or work orders |
| Ownership | Project team or vendor | Named owners in maintenance, operations and reliability |
| Proof of value | A chart of one avoided failure | Costs and downtime tied to closed work order records |
Four stall points to look for
- The pilot model lives on a laptop or in a vendor sandbox, so nobody can retrain it when the process changes.
- Alerts arrive in a separate dashboard that planners and technicians never open.
- Failure events were never recorded with a mode and date, so there is nothing to validate against.
- Each new line repeats the integration work because tags and asset names were never standardized.
The data layer: connect what matters, prove it is trustworthy
Start with assets where failure stops tonnage or creates a safety exposure. Condition monitoring practice such as ISO 17359 and the data processing model in ISO 13374 both begin with knowing what to measure and why.
| Asset area | Typical signals | Failures it helps expose | Record to link |
|---|---|---|---|
| Blast furnace blowers and fans | Vibration, bearing temperature, motor current, lube oil pressure | Bearing wear, imbalance, lubrication loss | Asset history and PM tasks |
| Caster segment rolls and drives | Bearing temperature, drive current, hydraulic pressure, cooling flow | Roll bearing seizure, drive overload, cooling faults | Inspection findings and work orders |
| Hot strip mill gearboxes | Vibration, oil condition, torque, case temperature | Gear mesh wear, bearing defects, oil degradation | Oil analysis and repair records |
| Descaling and cooling pumps | Pressure, flow, vibration, motor current | Cavitation, seal leaks, impeller wear | Corrective work orders |
| Overhead cranes | Motor current, brake wear, duty cycle counters | Brake degradation, hoist overload, rope fatigue | Inspection and certification records |
| Conveyors | Belt tracking, motor current, idler temperature | Idler seizure, misalignment, drive wear | Round checklists and work orders |
Five readiness gates before any modeling
The model layer: match the method to the failure behavior
A single model type will not fit every asset. Choose the approach by how the equipment actually fails, and use simple rules wherever the physics is already well understood.
| Failure behavior | Suitable approach | Works best when | Watch out for |
|---|---|---|---|
| Known fault signatures such as bearing defects or imbalance | Rules and spectral analysis | Vibration standards such as ISO 20816 and defect frequencies apply | Over-engineering with machine learning where rules are enough |
| Gradual wear in bearings, gears and ropes | Trend models and remaining life estimates | Condition history exists across several wear cycles | Too few failures to validate predictions |
| Random electrical or hydraulic faults | Multivariate anomaly detection | Plenty of normal operating data is available | False alarms when operating states change |
| Process-linked degradation such as cooling nozzles or refractory | Hybrid physics and data models | Process variables are reliable and logged | Baselines shifting after a reline or major repair |
The model lifecycle loop
Why models degrade in a steel plant
- Product mix and grade changes alter load and temperature patterns.
- Roll changes, relines and major repairs reset the normal baseline for an asset.
- Replaced or recalibrated sensors change the scale of a signal overnight.
- Maintenance itself removes the fault the model was learning to recognize.
The deployment layer: every prediction ends in a decision
A prediction has no value until someone acts on it. The deployment path below keeps humans in the loop and records what was found, which is the evidence that finance and operations need.
Detect
The model or rule flags a deviation on a specific asset and signal.Score
Severity, model confidence and asset criticality combine into a priority.Verify
A technician inspects, takes readings and records what was seen.Plan
The planner books labor, parts and a window such as a scheduled outage.Execute
The work order is completed with actions taken and parts used.Close the loop
Failure mode and findings flow back to improve the next prediction.Alert triage matrix
| Asset criticality | High confidence | Medium confidence | Low confidence |
|---|---|---|---|
| Critical (caster drive, blower, ladle crane) | Planned work order and inspection this shift | Inspection task, pre-stage spares | Watch item, check signal health |
| Important (mill gearbox, main pump) | Planned work order for next window | Inspection at next round | Log and review weekly |
| Standard (auxiliary conveyor, fan) | Schedule at next PM | Add note to next PM | Log only |
Connecting plant data to maintenance action
Scaling is easier when every asset class follows the same data path. A common architecture also makes it clear who owns each stage when something breaks.
Sensors and controllers
Vibration, temperature, current and process signals from sensors, drives and PLCs, each with a documented tag and unit.Edge and network layer
Gateways collect and buffer data, so short network drops in hot or shielded areas do not create permanent gaps.Historian or data platform
Time series are stored with context such as asset, operating state and product grade.Analytics and models
Rules, trend models and anomaly detection produce scored findings, not raw charts.Maintenance system
Findings become inspections and work orders, and repair outcomes return as labeled history.Design rules that keep scaling affordable
- Use one naming convention for tags and assets so a new line does not need custom mapping.
- Separate operational technology networks from business systems and follow your plant security policy.
- Store raw and cleaned data separately so models can be rebuilt when a cleaning rule changes.
- Keep model outputs in a standard format, such as asset, finding, severity, confidence and time.
- Document which findings are advisory and which can raise a work order automatically.
Seven mistakes that slow plant-wide scaling
Most of these show up in the second or third wave, after the easy assets are covered. Planning for them early saves rework.
| Mistake | What happens | Better practice |
|---|---|---|
| Choosing assets by sensor availability alone | Coverage grows where it is easy, not where failures hurt | Rank assets by consequence of failure and failure history first |
| Treating every alert as urgent | Technicians lose trust and stop responding | Score by severity, confidence and criticality, and review false alerts monthly |
| Skipping failure documentation | Models cannot be validated or improved | Require failure mode and findings at work order closure |
| Ignoring operating state | Startups, idling and grade changes look like faults | Capture state and compare like with like |
| No owner for model performance | Accuracy decays without anyone noticing | Name a reliability owner and set review dates |
| Replacing sensors without logging it | Baselines shift and models misread the change | Record sensor changes and repairs in the asset history |
| Separating analytics from planning | Findings stay on dashboards | Send verified findings straight to planners as tasks |
Keep models accountable as the program grows
Once several lines depend on predictions, the plant needs light but clear governance. It does not have to be heavy, only written down and followed.
- Model register: list each model, the asset class it covers, its training data period, version and owner.
- Change control: record when thresholds, features or training data change and who approved it.
- Performance review: track confirmed findings, false alerts and missed failures for each model on a fixed cycle.
- Decision rights: define which alerts can create a work order automatically and which need engineer review first.
- Documentation: keep the reasoning behind a prediction available, so a technician can see which signals triggered it.
Questions to ask before each expansion
Technical readiness
- Are tags mapped and signal health checks running?
- Do we have enough normal and fault history?
- Is the alert route to the maintenance system tested?
Organizational readiness
- Is there a named owner for the new asset class?
- Have technicians and planners been trained on the new alerts?
- Are spare parts and outage windows available to act on findings?
Give Your Predictions a Place to Become Work
Connect assets, inspections, scheduling and work orders in one system, so every alert has an owner and every repair feeds the next prediction.
Scale in waves, with exit criteria for each one
Moving from one asset to a plant-wide program works best in stages. Each wave should finish with evidence before the next one starts.
One asset class on one line
Prove data quality, alert routing and work order closure. Exit when alerts convert to inspections consistently and failure findings are recorded.Same asset class across all lines
Reuse tags, thresholds and templates. Exit when adding a new unit takes configuration, not a new project.Second and third asset classes
Extend to pumps, cranes or gearboxes using the same readiness gates. Exit when each class has an owner and a tuned alert ladder.Plant-wide governance
Add drift reviews, model versioning and quarterly performance reports. Exit when results are reviewed in the regular reliability meeting.Track scaling with leading and lagging indicators
Downtime results take months to appear. Leading indicators show earlier whether the foundation is sound.
Leading indicators
- Share of critical assets with live, verified condition data
- Signal health score by asset class
- Percentage of alerts converted to inspections or work orders
- Time from alert to technician verification
- False alert rate by asset class
Lagging indicators
- Unplanned downtime hours on covered assets
- Emergency work order ratio
- Planned versus reactive work hours
- Repeat failures on the same component
- Maintenance cost per tonne in covered areas
Who owns what
- Reliability engineer: model performance, alert thresholds and failure code quality.
- Maintenance planner: turning verified alerts into scheduled work and parts reservations.
- Operations: approving windows and sharing process context such as grade changes.
- OT and IT: data connectivity, security and sensor infrastructure.
Where Oxmaint fits in a scaled AI program
Oxmaint does not replace your analytics. It gives the maintenance side of the program a structured home.
| Scaling need | Oxmaint capability |
|---|---|
| One asset identity for every signal | Asset register with hierarchy from area to component |
| Acting on alerts consistently | Corrective and condition-triggered work orders with priorities |
| Verifying a prediction in the field | Mobile inspections with findings recorded at the asset |
| Fitting repairs into outage windows | Scheduling and preventive maintenance planning |
| Having parts ready | Inventory tracking linked to work orders |
| Building failure labels for models | Structured closure with actions, findings and history |
| Proving value to leadership | Dashboards and reports on downtime, backlog and compliance |
AI predictive maintenance scaling questions
What should a steel plant fix first before scaling AI?
Fix asset identity and signal health. If tags are not mapped to asset records and drift goes undetected, every new model inherits the same weakness.Can one model be reused across different lines?
Only with care. Reuse the pipeline and templates, but validate each model against the local baseline, since loads and operating states often differ.How do we prevent alert fatigue?
Score alerts by criticality and confidence, route low-priority items to routine rounds, and review false alerts monthly. You can book a demo to see priority routing.Do we need a CMMS to scale predictive maintenance?
In practice yes. A CMMS gives predictions an asset record, an owner and a closure trail. You can start with Oxmaint and add analytics over time.How often should models be reviewed?
Review on a fixed cycle and after any major event such as a reline, roll change or sensor replacement, since each can shift the normal baseline.Make Predictive Maintenance a Plant Standard
Start with a structured asset register and work order workflow, then scale AI insights across every line with confidence.