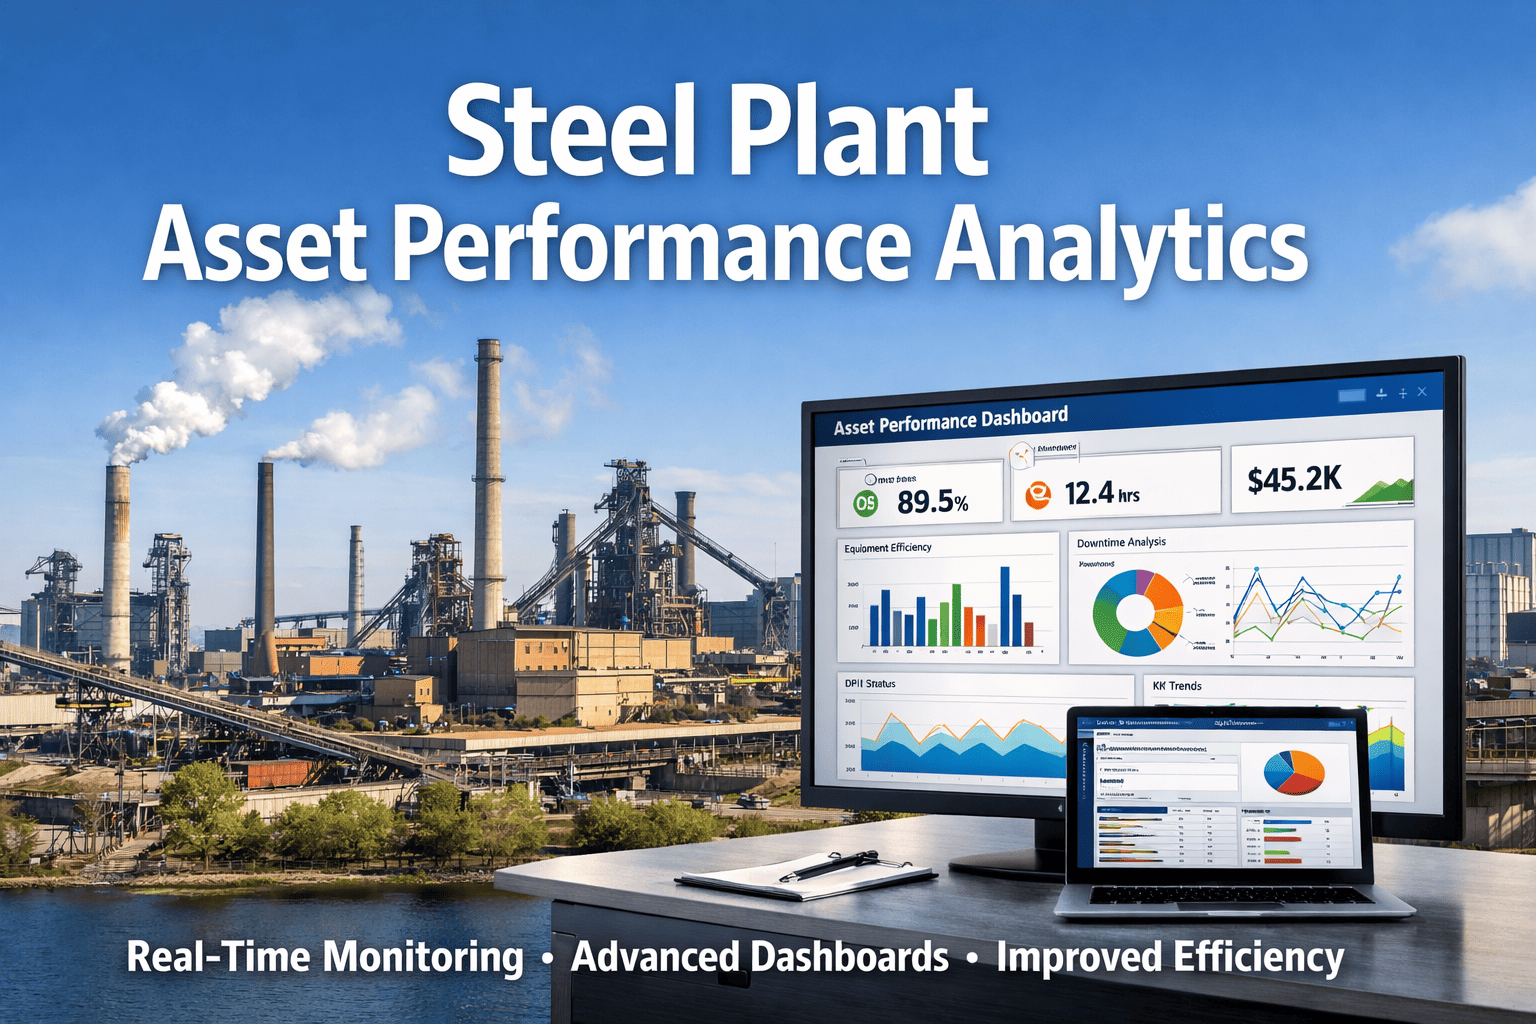
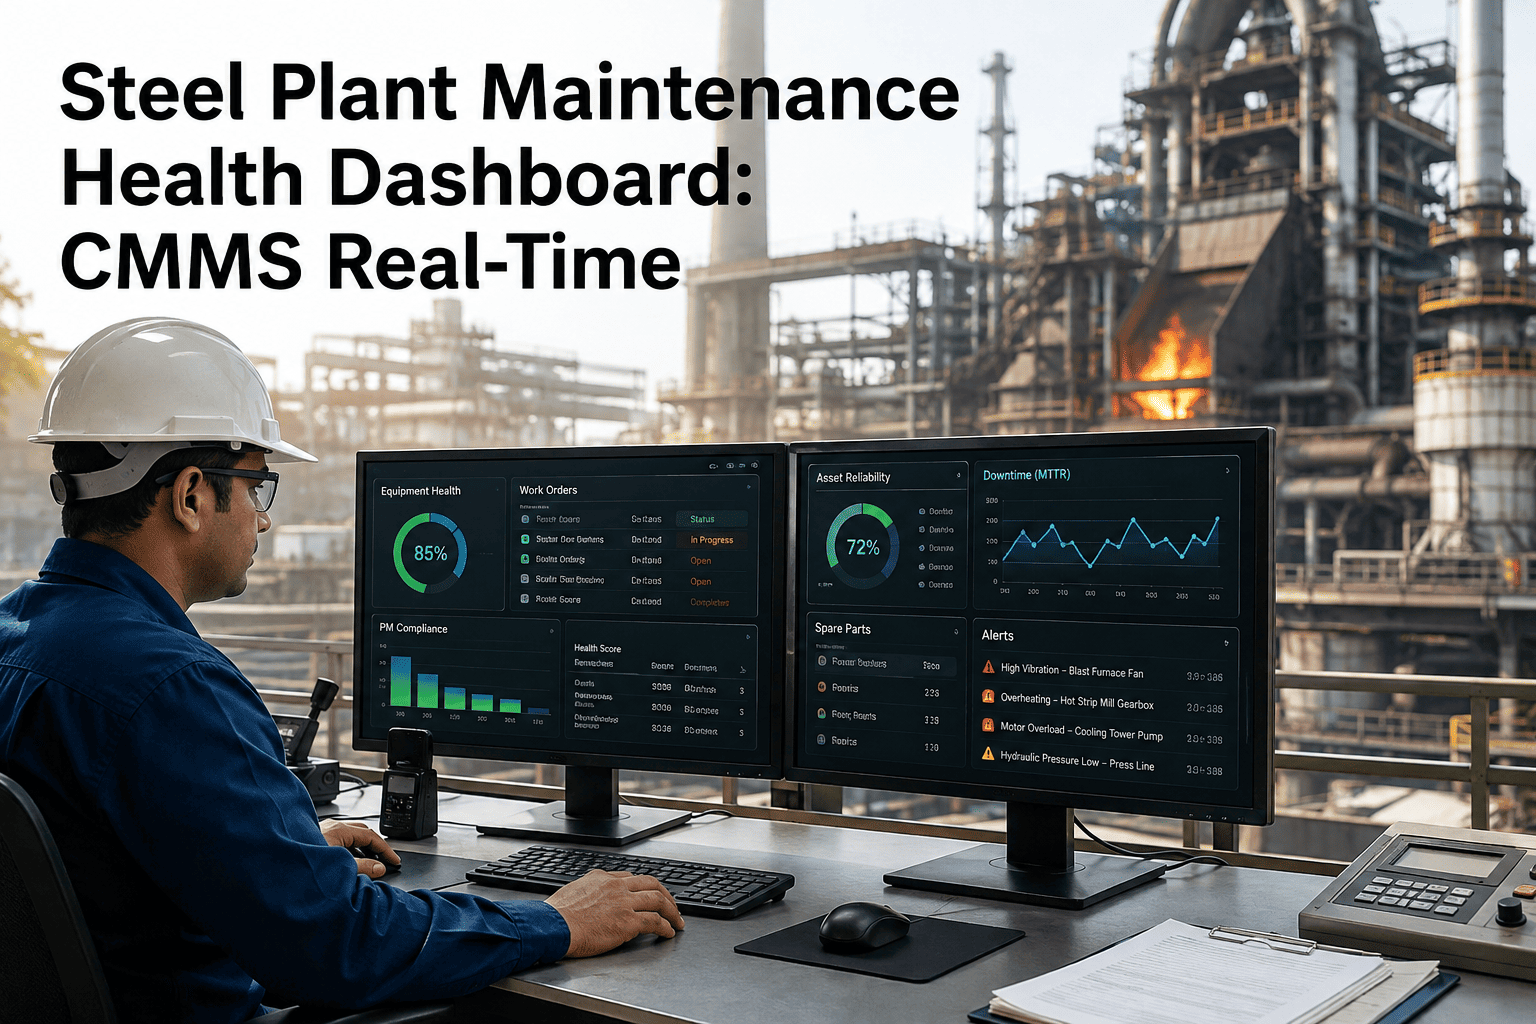
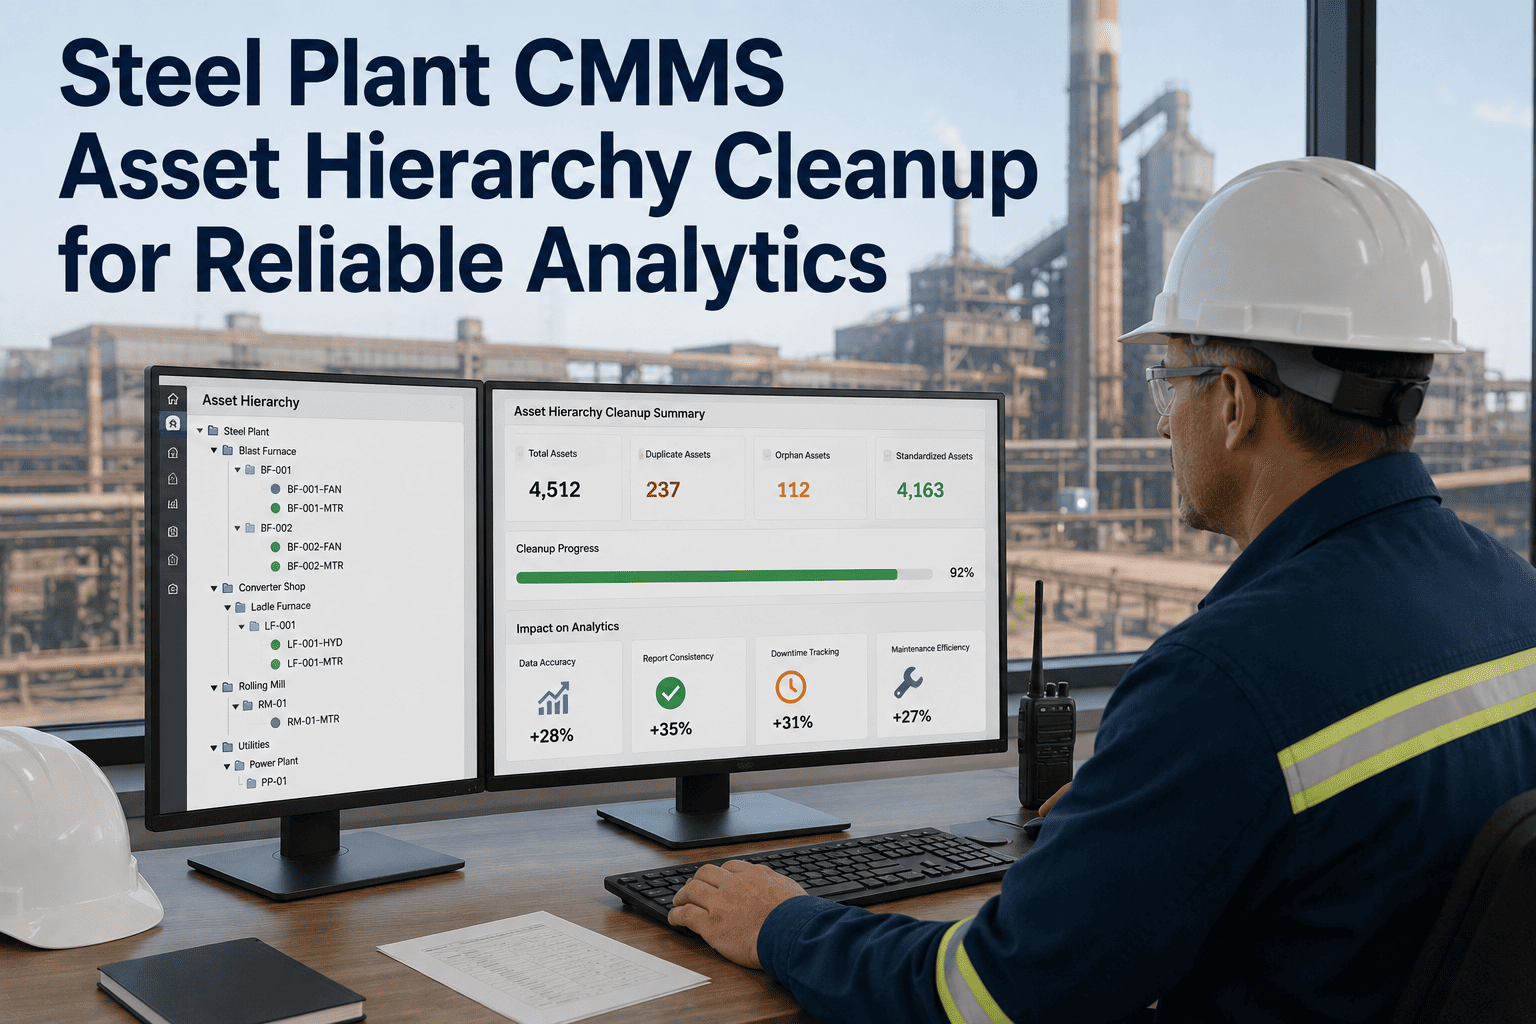
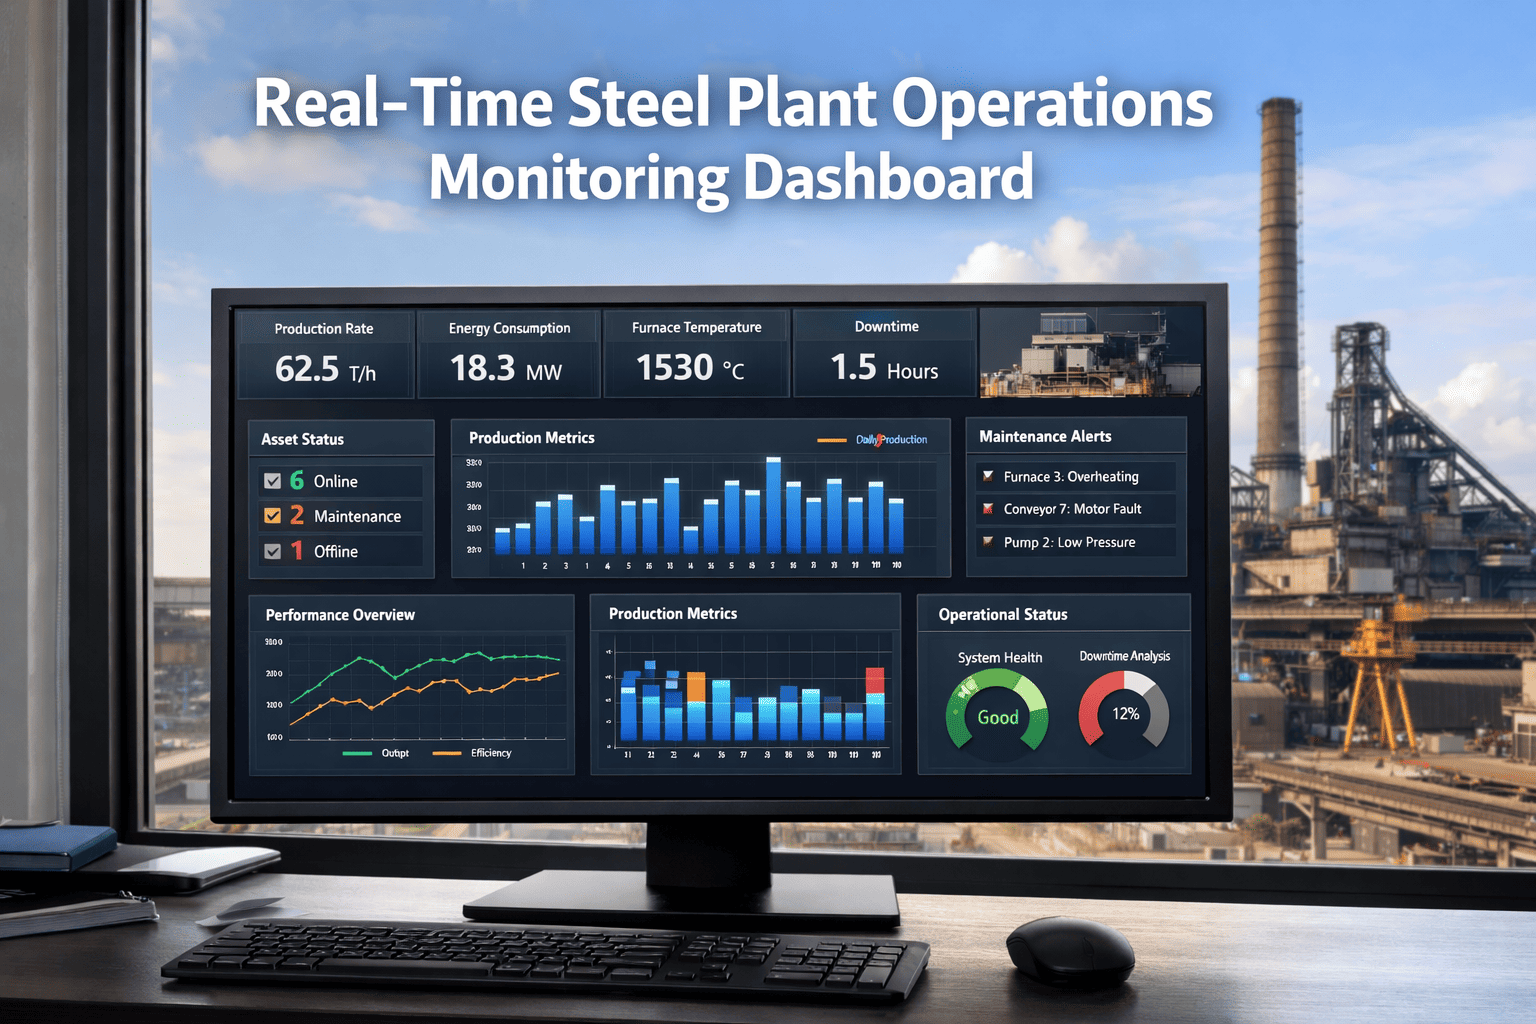
Most steel plant maintenance decisions still run on last month's data. MTBF calculations assembled in spreadsheets. OEE figures that arrive 10 days after the period they measure. Downtime reports that identify the problem after the shift that caused it has already gone home. McKinsey's 2024 operations research found that companies using standardised maintenance metric dashboards outperform peers by 25% in asset uptime and 20% in cost efficiency — but the gap is not about the metrics themselves. It is about whether those metrics are calculated automatically from live work order data, visible to the right people in real time, and connected to the action that changes them. OxMaint's asset analytics dashboard calculates OEE, MTBF, MTTR, PM compliance, planned maintenance percentage, and maintenance cost per tonne automatically from every work order your team closes — no manual entry, no spreadsheet consolidation, no 10-day reporting lag.
Analytics · Steel Industry
Steel Plant Asset Performance Analytics
Live OEE · MTBF · MTTR · PM Compliance · Cost per Tonne — Calculated Automatically
78.4%
OEE
↑ +2.1% vs last month
312 hrs
MTBF · BF#1
↑ Up from 278 hrs
3.8 hrs
MTTR · All assets
↓ Down from 5.1 hrs
71%
PM Compliance
⚠ Target: 85%
The 7 KPIs OxMaint Calculates Automatically for Every Steel Plant Asset
Overall Equipment Effectiveness
Target: 85%+ world-class
OEE = Availability × Performance × Quality
The single most comprehensive asset performance metric — a 5-point OEE improvement at a steel plant equals one full additional shift of productive capacity without new equipment. OxMaint calculates OEE per asset, per area, and plant-wide from work order and production data in real time.
Average plant: 60–65%World-class: 85%+
Mean Time Between Failures
Rising trend = improving reliability
MTBF = Total Operating Hours ÷ Number of Failures
A declining MTBF trend is the earliest warning that a PM programme needs adjustment before failures escalate. OxMaint calculates MTBF per asset class — ladle cranes, casters, rolling mill drives — giving reliability engineers the trend data that precedes failure escalation by 4–8 weeks.
Track by asset classFlag declining trends immediately
Mean Time To Repair
Target: reduction over time
MTTR = Total Downtime ÷ Number of Repair Events
MTTR reveals whether parts are pre-staged, procedures are clear, and technicians have the right information at the asset. Plants relying on manual time logging underestimate MTTR by 15–30% because technicians log completion time rather than actual start time. OxMaint timestamps both automatically.
90-min MTTR reduction → significant production gain
PM Compliance Rate
Target: 85%+ on critical assets
PMC = Completed PMs ÷ Scheduled PMs × 100
The most predictive leading indicator available. A 1% drop below 85% PMC typically correlates with a measurable MTBF reduction within 60 days — PM compliance slippage is visible 4–8 weeks before the failures it predicts. OxMaint flags compliance drops per asset class before the failure window arrives.
Critical assets: 85%+High-criticality: 94%+
Planned Maintenance Percentage
Target: 70–80%+ planned
PMP = Planned Hours ÷ Total Maintenance Hours × 100
Below 60% PMP means the maintenance team is primarily reactive — more than half of labour hours are responding to failures rather than preventing them. Each shift of reactive work crowds out the PM that would have prevented next week's breakdown. OxMaint tracks PMP live and flags reactive work order accumulation.
World-class: 80%+ plannedReactive spiral: below 55%
Maintenance Cost per Tonne
Normalised to production volume
Cost/t = Total Maintenance Spend ÷ Tonnes Produced
Normalising maintenance cost against production output makes spend comparable across periods with different production volumes. Rising cost per tonne — even when total spend stays flat — is an early warning of asset deterioration before failures become visible. OxMaint calculates this automatically from work order cost data and production throughput.
Track month-over-month trendRising trend = investigate asset condition
Stop Calculating KPIs in Spreadsheets. Start Seeing Them Live from Your Own Work Order Data.
OxMaint pulls MTBF, MTTR, OEE, PMC, PMP, and cost per tonne directly from every work order your team closes — updated in real time, no manual entry required.
Role-Based Views — The Right KPIs for the Right People
Plant Manager
Strategic View — 6 KPIs
OEE vs target — plant-wide and by area
Maintenance cost per tonne — trend 12 months
Asset availability — colour-coded heat map
Unplanned downtime hours — current vs prior period
PM compliance rate — by area
Reactive vs planned maintenance ratio
Maintenance Manager
Operational View — 10+ KPIs
Open work order backlog — by priority and age
MTTR by asset class and failure mode
MTBF trend by critical asset — 6-month view
Technician utilisation and schedule compliance
PM schedule adherence — overdue flagged
Repeat failure rate — same asset within 30 days
Reliability Engineer
Reliability View — Failure Analysis
MTBF per asset — individual trend and class benchmark
Failure mode frequency — Pareto by asset class
Condition score per asset — updated from last inspection
Backlog work order age — risk-scored
Predictive alert confidence vs confirmed saves
Remaining useful life estimates — high-criticality assets
Data Maturity — Where Most Steel Plants Are vs. Where They Need to Be
| Capability |
Spreadsheet / Paper |
OxMaint Dashboard |
| MTBF calculation |
Manual — end of month, error-prone |
Auto-calculated from every closed WO — updates in real time |
| OEE visibility |
Report delivered 10–14 days after period-end |
Live per asset, per area, and plant-wide — shift and daily view |
| PM compliance tracking |
Checked monthly; overdue PMs discovered at audit |
Live compliance rate with overdue flag before MTBF impact |
| Cross-area comparison |
3–5 analyst-days per report period |
Always available — drill from plant to area to asset in one click |
| Maintenance cost per tonne |
Calculated quarterly for board reporting only |
Monthly automatic calculation from WO cost + production data |
| Repeat failure detection |
Noticed when the third work order is raised |
Auto-flagged on second occurrence within 30 days — RCA triggered |
"
When I joined the plant, the monthly OEE report was assembled by a controller from four different spreadsheets and arrived on the manager's desk twelve days after the end of the month. By that point, the team responsible for the underperformance had already moved on mentally. You cannot improve what you measure two weeks late. The shift to a live dashboard calculated automatically from work order closures changed not just the speed of the data — it changed what decisions got made and when. We identified a rolling mill stand that was pulling the entire area's availability below 80% three weeks into the month — something that would have appeared in the next quarterly report as a footnote. We fixed the root cause in time for it to matter in the same period we detected it.
Marcus Eidenschink, B.Eng (Mechanical), CRL
Maintenance Manager — voestalpine Stahl GmbH (Linz) · 21 Years Steel Plant Maintenance Management · Certified Reliability Leader (SMRP) · Specialist in CMMS implementation, KPI dashboard deployment, and reliability-centred maintenance for integrated steelworks
Frequently Asked Questions
How does OxMaint calculate KPIs if my plant doesn't have IoT sensors on every asset?
OxMaint calculates MTBF, MTTR, PM compliance, and planned maintenance percentage directly from work order data — which every team already creates when responding to failures and scheduling PMs. No IoT sensors required to start. Each time a technician closes a work order with a start timestamp, completion timestamp, and failure code, OxMaint updates the relevant KPIs automatically. Sensor data and SCADA integration add the predictive layer on top of the same dashboard when ready, but the core performance analytics are fully operational from day one of work order adoption.
Book a demo to see which KPIs go live immediately with your existing work order data.
Can OxMaint show performance benchmarks for steel plant assets specifically?
Yes. OxMaint's dashboard benchmarks each asset's MTBF, MTTR, and OEE against both the plant's own historical baseline and configurable industry reference values — blast furnace, caster, rolling mill, ladle crane, and EAF each have different reliability expectations that the dashboard accounts for. A rolling mill stand MTBF of 280 hours needs different context than a utility pump MTBF of the same value. The Pareto failure mode view shows which specific failure modes are driving the most downtime per asset class — the diagnostic layer that tells you where to improve, not just what the number currently is.
Start your free trial to see OxMaint's asset benchmarking configured for steel plant asset classes.
How does the dashboard help identify repeat failures and root cause patterns?
OxMaint flags any asset that generates a second unplanned work order within 30 days automatically — a repeat failure indicator that appears on the maintenance manager dashboard and triggers a root cause prompt before the third work order is raised. The failure mode Pareto view shows cumulative frequency and downtime hours per failure code per asset class across any date range — making it visible whether a bearing failure pattern on F3 finishing stands is a systemic issue or isolated events. Plants report that the repeat failure flag alone eliminated 15–25% of their recurring breakdown patterns within the first 12 months of deployment.
Is the dashboard configurable for different roles — plant management vs. maintenance team vs. reliability engineers?
Yes. OxMaint serves three distinct dashboard views from the same data source: a plant management view showing 6–8 strategic KPIs (OEE, cost per tonne, availability heat map, reactive ratio), a maintenance manager view showing 10–15 operational metrics (backlog, MTTR by failure mode, technician utilisation), and a reliability engineer view showing asset-level MTBF trends, condition scores, failure mode Pareto, and backlog age risk scoring. Each view is role-assigned and updates in real time from the same underlying work order data — no separate reports, no manual compilation, no version control issues across the team.
Asset Performance Analytics — OxMaint
Your Steel Plant Already Generates the Data. OxMaint Turns It Into the KPIs That Run Your Plant.
Every work order closed, every PM completed, every failure logged — OxMaint converts that raw activity data into live OEE, MTBF, MTTR, PM compliance, planned maintenance percentage, and cost per tonne on a dashboard your entire team acts on daily.