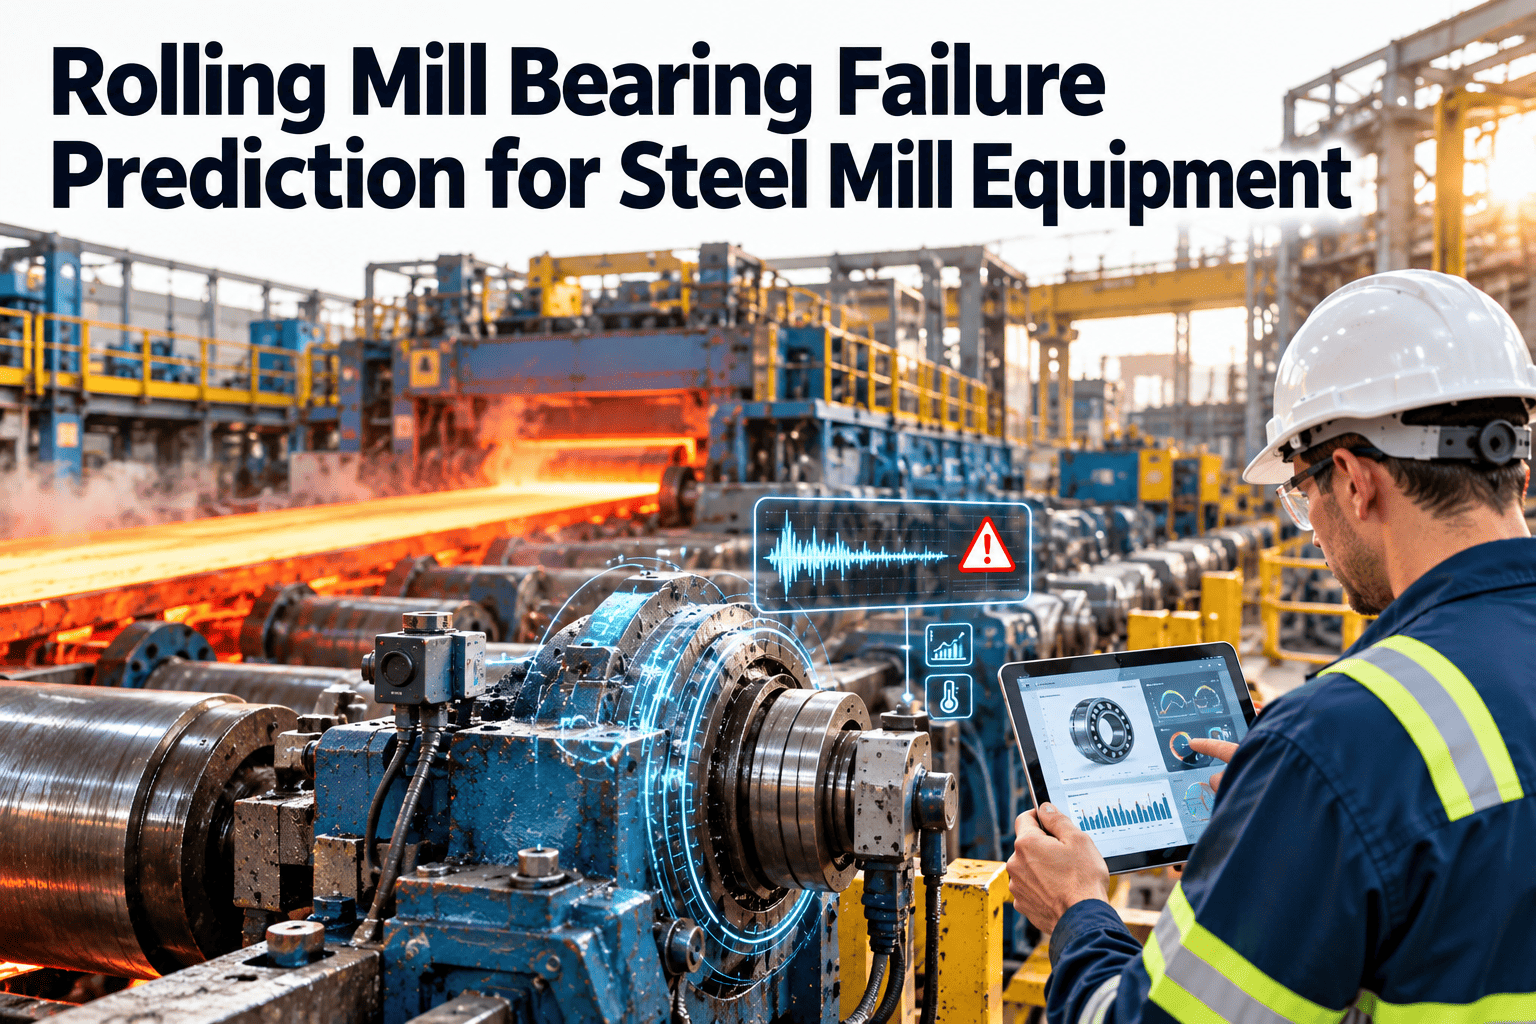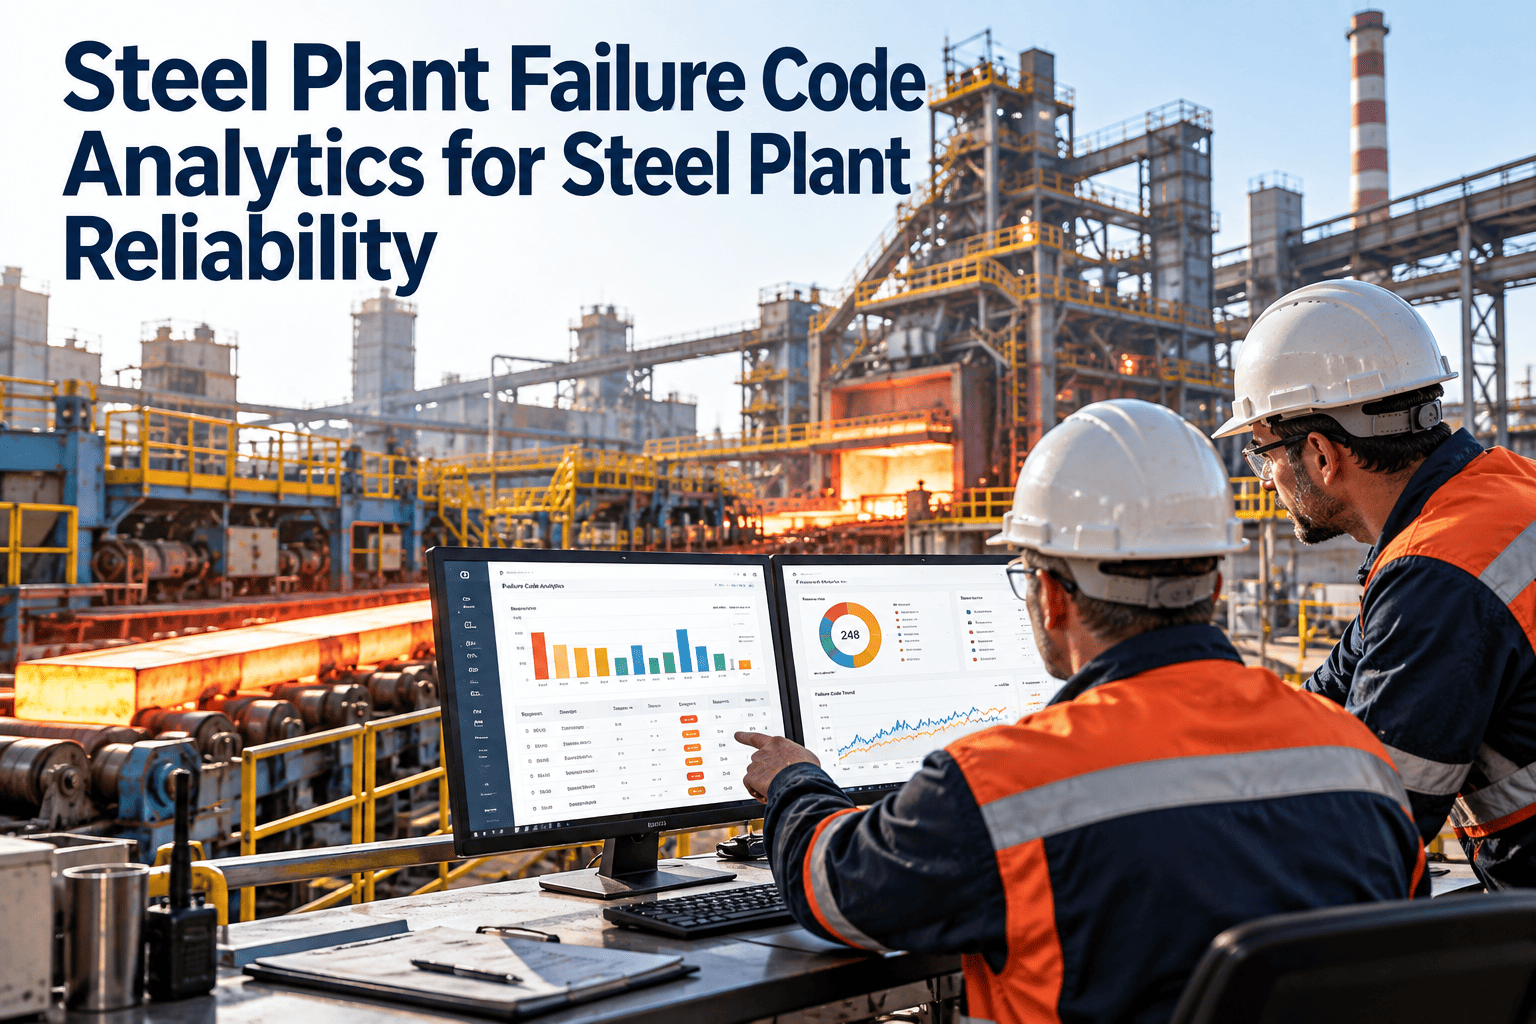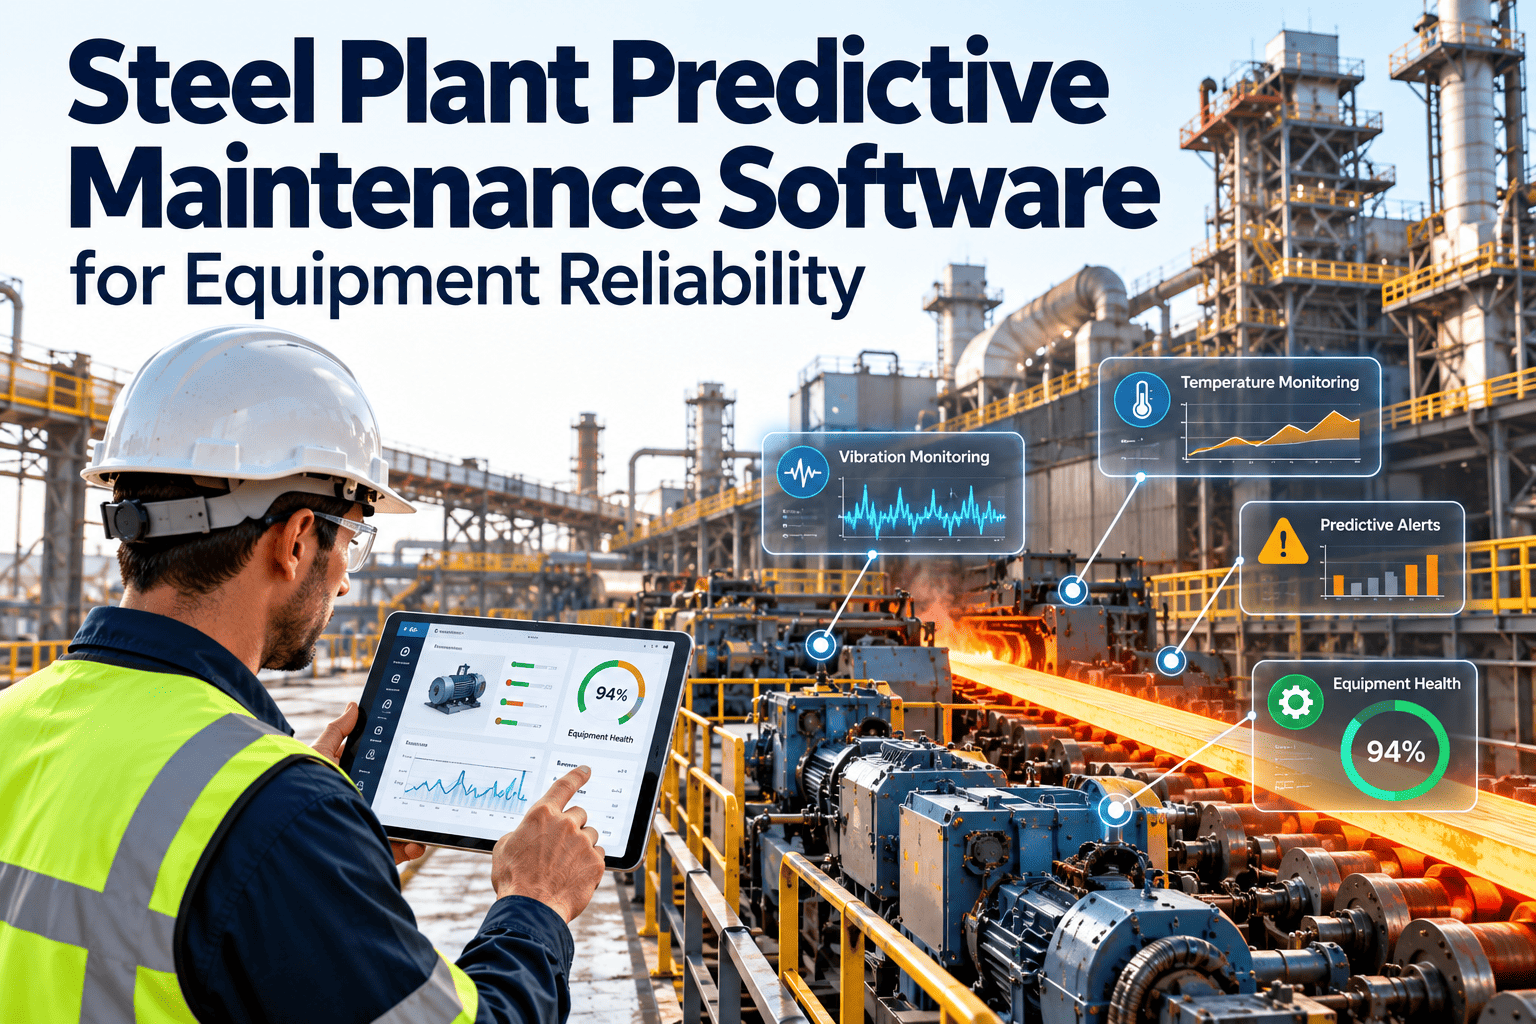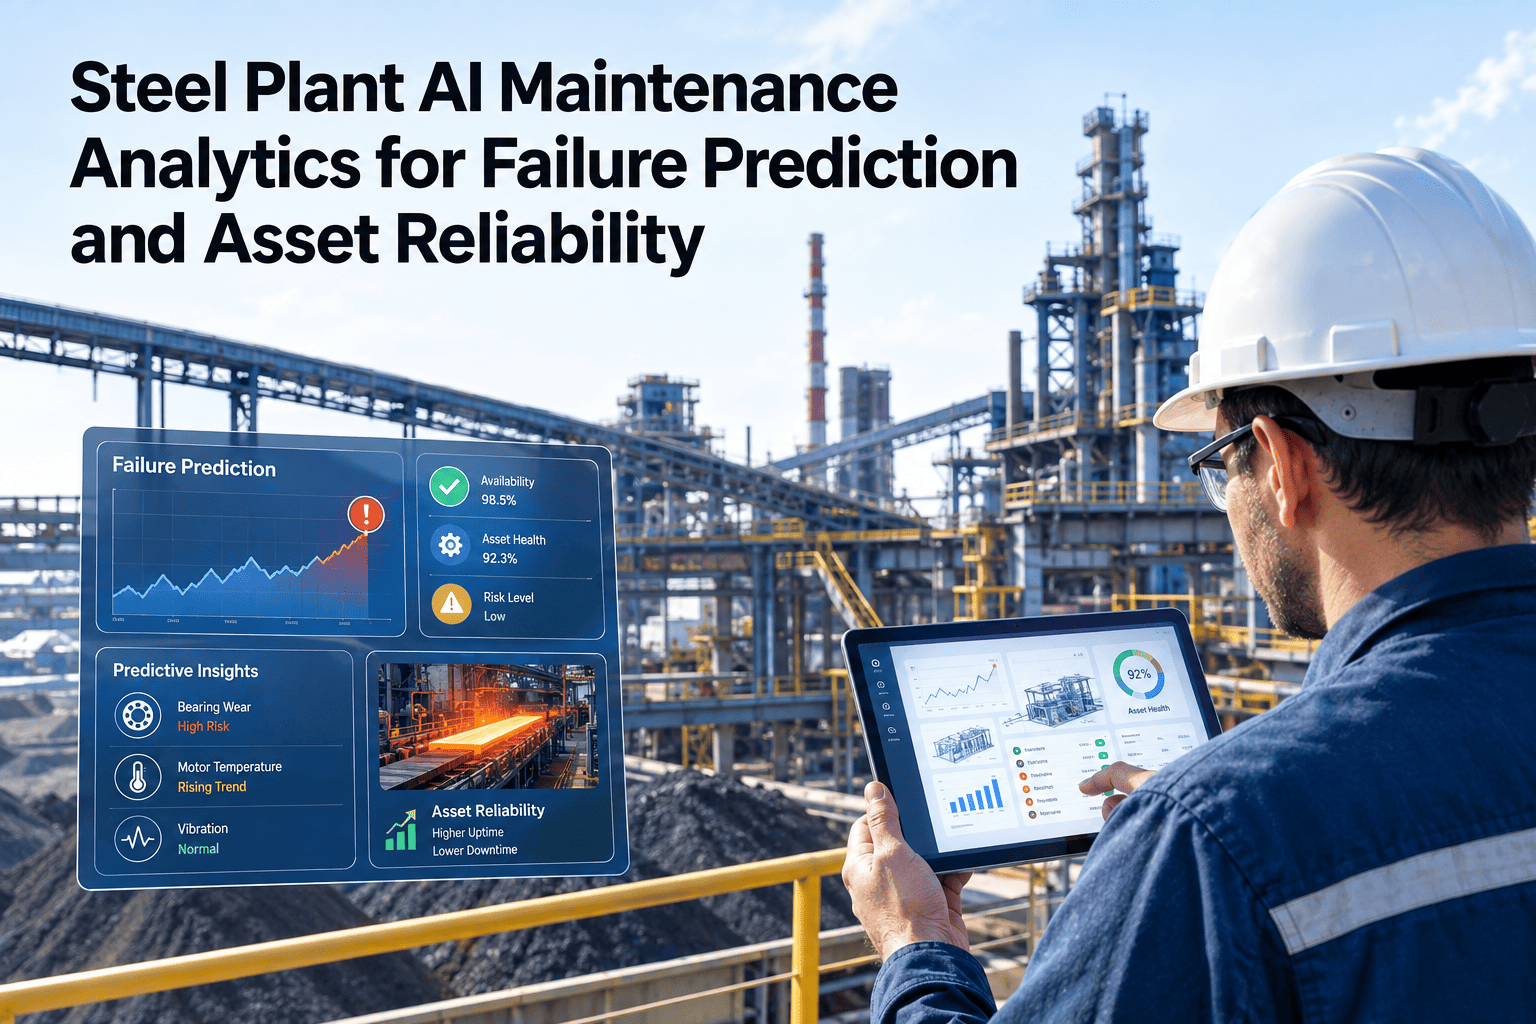
Most steel plants already hold the raw material for failure prediction: years of work orders, a growing stream of sensor readings and detailed production logs. The gap is that these sit in separate systems, recorded in different formats by different teams. AI maintenance analytics joins them, looks for degradation patterns that precede breakdowns and ranks assets by the risk they put on production. Results only matter when they land in the maintenance workflow, so many plants connect insights to Oxmaint work orders, asset records and scheduling where the actual repair gets planned and tracked.
AI and Analytics for Steel Plant Reliability
Steel plant AI maintenance analytics: from failure history to ranked maintenance priorities
Combine failure history, sensor trends, work orders and production data to spot degradation early, then send the right action to the right crew before the line goes down.
Inputs
Analytics layer
Outputs
Start With The Data
What steel plant maintenance data looks like before analytics
Analytics quality is capped by data quality. Before choosing a model, map what each source holds and where it tends to let you down.
| Data source | What it holds | Common weakness | Analytics use |
|---|---|---|---|
| Work order history | Failures, repairs, parts, labor hours | Free-text descriptions, vague cause codes | Failure frequency, repeat failures, repair time |
| Condition sensors | Vibration, temperature, motor current, oil and pressure readings | Gaps, drift, uncalibrated channels | Trend detection, anomaly alerts |
| Process and production data | Tonnage, heat counts, line speed, cycle times | Kept in separate automation systems | Load-adjusted wear, cost of downtime |
| Asset register | Hierarchy, criticality, installation dates | Missing parent-child links, duplicate tags | Grouping similar assets, benchmarking |
| Inspection rounds | Operator and technician observations | Inconsistent wording, paper capture | Early warning signs, confirmation of alerts |
| Inventory and spares | Consumption, lead times, stock levels | Parts not tied to assets | Spare planning against predicted need |
Why steel makes this harder
Steel assets work under heat, dust, scale, water and shock loading, and their wear depends on what is being produced, not only on running hours. A caster segment roll or mill gearbox may see very different stress from one grade or campaign to the next.
- Running hours alone are a weak wear proxy when load swings widely
- Sensors in hot, dirty zones fail and drift, which can look like asset degradation
- Planned outages reset condition, so trends must be read across repair events
Reading Degradation
The path from healthy asset to functional failure
Most failures do not arrive without warning. They pass through stages, and each stage leaves different evidence. Analytics is about catching the earliest stage that produces a reliable signal.
Stable
Readings sit inside the normal band for the current load. This stage defines your baseline.
Early change
Small shifts appear in high-frequency vibration, oil condition or motor current signature.
Developing fault
Trends steepen and temperature or noise changes become visible to inspection rounds.
Advanced fault
Alarms trigger and repair becomes urgent, with fewer scheduling options.
Functional failure
The asset stops or produces off-spec output, and the repair is unplanned.
The P-F interval decides your options
The time between the first detectable warning (P) and functional failure (F) sets how much notice you get. If that window is shorter than your planning lead time, monitoring alone cannot prevent the failure, and design or spares strategy has to change.
Analytics Maturity
Four levels of maintenance analytics, and what each answers
You do not need machine learning on day one. Each level builds on cleaner data from the one before it.
Where machine learning helps and where it does not
Machine learning suits assets with plenty of history and consistent failure modes. For rare, high-impact events, engineering rules, physics-based limits and expert judgment often outperform a model trained on a handful of examples.
- Good fit: fans, pumps, motors, gearboxes and conveyors with repeated failures
- Weaker fit: one-off refractory or structural failures with little history
- Always keep a simple rule-based baseline to test whether a model adds value
Turn Insight Into Action
Route every analytics alert into a planned, tracked work order
Oxmaint connects asset history, condition-based triggers and scheduling so predictions become repairs, not dashboards nobody opens.
Steel Asset Families
Analytics approaches matched to common steel plant assets
Different equipment shows failure in different ways. Match the signal and the method to the asset instead of applying one model everywhere.
| Asset family | Typical degradation signal | Data to combine | Suggested approach |
|---|---|---|---|
| Rolling mill gearboxes and drives | Bearing and gear mesh vibration, oil debris, temperature | Vibration, oil analysis, rolled tonnage | Trend detection with load normalization |
| Continuous caster rolls and segments | Bearing temperature, rotation resistance, alignment drift | Temperature, cast length, inspection findings | Life tracking by campaign and roll position |
| Process fans and blowers | Imbalance, looseness, buildup, bearing wear | Vibration, motor current, damper position | Anomaly detection against operating state |
| Hydraulic systems | Pressure loss, valve response change, contaminated oil | Pressure, temperature, oil cleanliness | Threshold plus drift analysis |
| Cooling water pumps | Flow reduction, seal leakage, cavitation | Flow, current, vibration, work orders | Failure history modeling and condition triggers |
| Overhead cranes | Brake wear, hoist motor loading, rope condition | Duty cycles, inspection results, work orders | Usage-based scheduling plus inspection trends |
| Conveyors and material handling | Idler noise, belt misalignment, motor overload | Current, temperature, inspection rounds | Zone-based monitoring and repeat failure analysis |
Prioritization
How a risk score turns predictions into a maintenance queue
A prediction alone does not say what to fix first. Multiply how likely a failure is by what it costs the plant, and the queue sorts itself.
Three tiers of response
Act in the next window
High likelihood on a bottleneck asset. Plan the repair at the next scheduled stop, with parts and crew reserved.
Monitor closely
Rising trend on a moderate-impact asset. Increase inspection frequency and set a review date.
Keep routine PM
Stable condition or low consequence. Leave the preventive schedule in place and revisit at review.
Data Readiness
Fixing the data problems that quietly break maintenance AI
Models trained on inconsistent records produce inconsistent advice. These fixes usually pay off before any advanced algorithm does.
Standardize failure coding
Use a consistent failure mode, cause and effect structure, such as the taxonomy in ISO 14224, so similar failures group together.
Close work orders properly
Require the failure code, the action taken and the parts used before a work order can close.
Clean the asset hierarchy
Every asset needs a unique tag and a parent, so a bearing failure rolls up to its gearbox, mill and line.
Align timestamps across systems
Sensor, process and maintenance records must share time references, or events cannot be matched to causes.
Record what was not a failure
False alarms and successful interventions teach the model as much as breakdowns do.
Workflow Shift
Analytics in a spreadsheet versus analytics tied to work orders
Many teams already analyze downtime, but the analysis stays disconnected from execution. Linking the two changes what happens after the insight.
Disconnected analysis
- Monthly reports assembled by hand from several exports
- Insights shared in slides, actions lost after the meeting
- Alerts emailed with no owner or due date
- PM intervals unchanged for years
Connected to maintenance execution
- Asset history and failure codes feed analysis directly
- Alerts create work orders with an owner and due date
- Completed repairs return findings to the asset record
- PM intervals reviewed against actual failure evidence
Common Pitfalls
Why steel plant analytics projects stall, and how to avoid it
Most stalled projects fail on process, not mathematics. These are the patterns that show up most often.
Starting with the model instead of the question
Pick a specific failure that hurts, such as repeated fan bearing failures, and build toward that decision first.
Alert fatigue
Too many low-value alerts teach crews to ignore all of them. Tune thresholds against confirmed findings.
Ignoring operating context
A vibration rise during a heavy campaign may be normal. Compare readings against load and product state.
No owner for the result
Assign each alert type to a planner or reliability engineer who decides and records the outcome.
Using predictions in shutdown planning
Planned outages are where failure predictions earn their value. Assets with rising risk can be added to the work scope, and healthy assets can be deferred.
- Compare risk rankings with the outage work list before scope freeze
- Reserve parts and specialist labor for assets flagged as developing faults
- Review completed outage findings against earlier predictions to improve them
- Extend PM intervals only where condition and failure history support it
Roadmap
A staged path from clean records to condition-driven maintenance
Progress comes from proving value on a small set of critical assets, then widening the scope with what you learned.
Clean the base
Fix asset tags, hierarchy and failure codes for one production area.
Report the facts
Publish MTBF, MTTR and repeat failures so the team trusts the numbers.
Add condition data
Link sensor trends to critical assets and set first alert rules.
Trial predictions
Test models on historical failures before using them for decisions.
Scale and review
Extend to more areas and review alert precision every quarter.
Measure The Result
Reliability measures that show whether analytics is working
Track a small set of measures and review them against the same assets over time. Improvement should show up in the work, not only in the models.
Where Oxmaint fits
Oxmaint supplies the maintenance workflow around analytics: asset management, preventive and corrective work orders, inspections, scheduling, inventory and dashboards.
- Structured failure history that analysis can trust
- Condition-based and predictive workflows that trigger planned work
- Mobile inspections that confirm or dismiss alerts in the field
- Reporting on MTBF, MTTR, backlog and PM compliance
Trust and Adoption
Making analytics results believable to maintenance crews
A prediction that nobody trusts is just another alarm. Crews accept analytics when they can see why an asset was flagged and when the outcome is fed back to them.
What builds trust
- Showing the trend and the baseline behind each alert
- Letting technicians confirm or dismiss an alert with a reason
- Sharing results after each repair, including when the alert was wrong
- Starting with assets the crew already worries about
What erodes trust
- Scores with no explanation of the underlying signal
- Alerts that arrive after the repair window has closed
- Recommendations that ignore spares and crew availability
- Dashboards owned by a team that does not do the repairs
Keep the human decision in the loop
Analytics ranks and recommends, while planners and reliability engineers decide. Recording each decision and its outcome creates the feedback that improves thresholds and models over time.
- Store the alert, the decision, the action taken and the confirmed finding together
- Review false alarms and missed failures in a monthly reliability meeting
- Version any model or rule change so earlier alerts remain explainable
- Document which data each alert used, so an engineer can reproduce the reasoning during a failure review
- Compare predicted risk with actual outcomes each quarter and retire rules that no longer earn their place
- Agree who can change alert thresholds, and log every change against the affected asset
- Share short case notes after major repairs so operators see how their observations improved the result
FAQ
Steel plant AI maintenance analytics: common questions
What is AI maintenance analytics for a steel plant?
It applies statistical and machine learning methods to maintenance, sensor and production data to detect degradation and rank assets by risk.
How much data is needed to predict failures?
It depends on the asset and failure mode. Frequent failures with clean coding need less than rare events, which often rely on engineering rules.
Do we need sensors on every asset?
No. Start with critical assets and combine sensors with inspections and work order history. Book a demo to review your priority list.
Can analytics work without a CMMS?
It can run, but insights stall without work orders and asset history. Oxmaint provides that execution layer.
Which standards guide condition monitoring data?
ISO 14224 covers reliability data, ISO 17359 condition monitoring, and ISO 13374 data processing. ISO 55000 frames asset management.
Reliability Starts With Better Decisions
Put failure prediction and asset reliability into one maintenance workflow
See how your failure history, inspections and work orders can support ranked priorities across the plant.