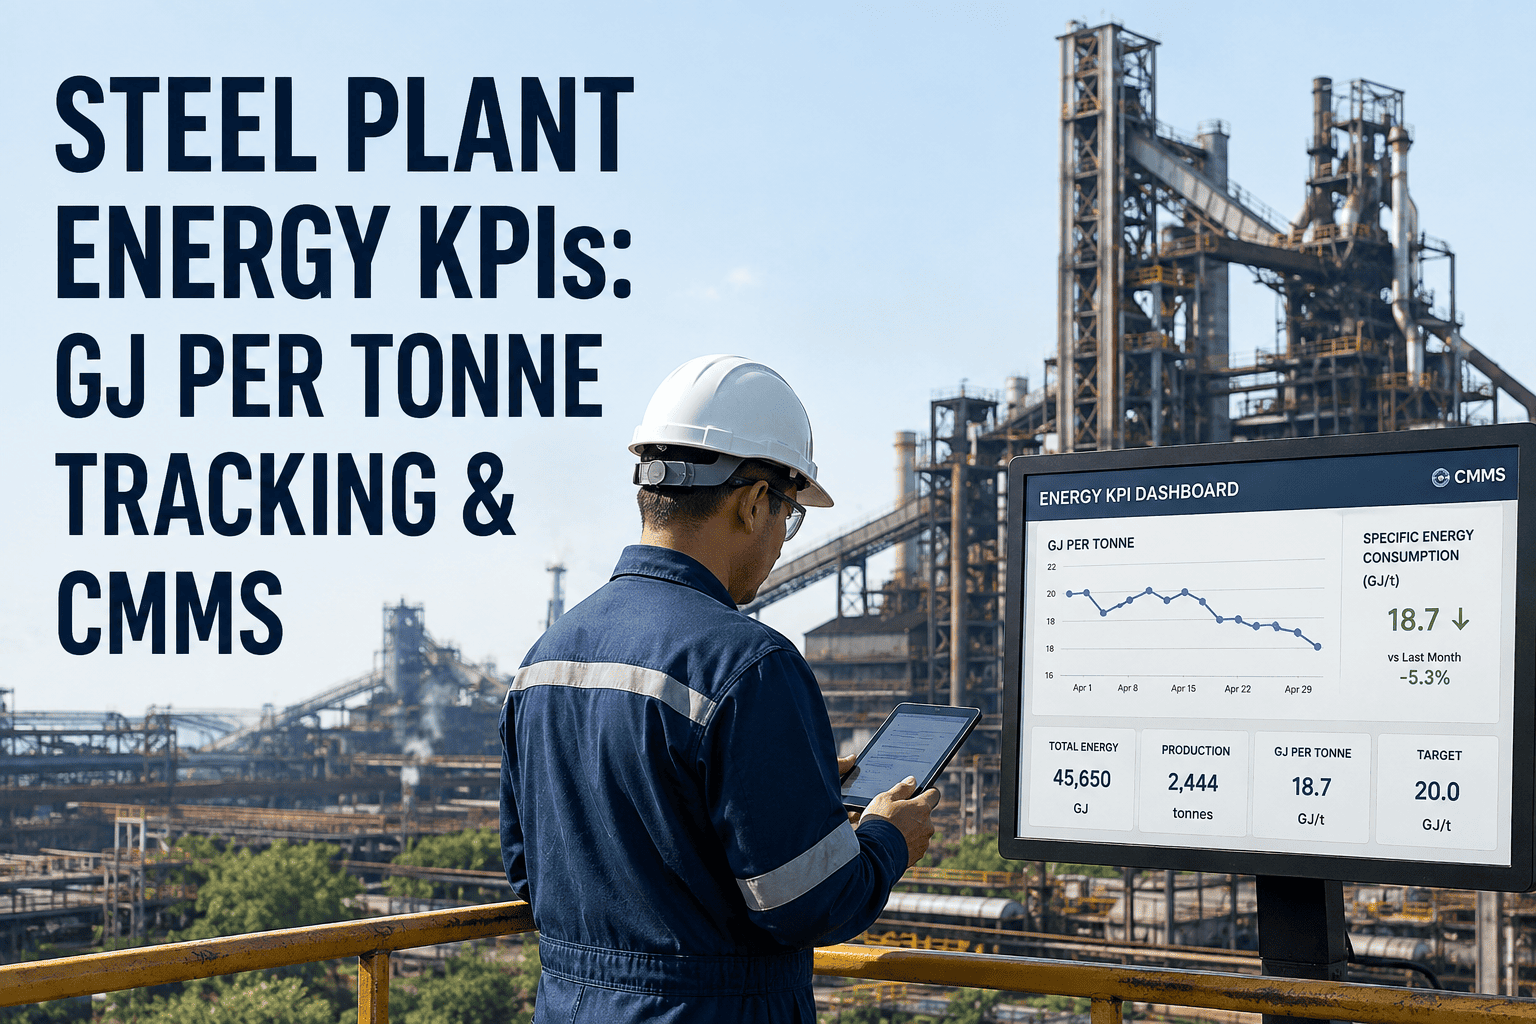
Energy intensity — measured in gigajoules per tonne of crude steel — is the single number that decides whether a mill is competitive or bleeding margin. Global steelmaking averaged 20.95 GJ per tonne of crude steel in 2024, down from roughly 50 GJ/t in the 1960s, but the gap between best-in-class BF-BOF plants at 17 GJ/t and laggards at 23 GJ/t translates to millions of dollars in annual fuel and power spend on a mid-size mill. The mills that consistently sit in the lower quartile are not running fundamentally different equipment — they are running tighter KPI hierarchies, submetering every major consumer, and linking every energy anomaly to a maintenance work order. When a reheating furnace burner drifts 3% rich, when a compressor develops a 0.5 bar suction leak, when a rolling mill motor slips into higher slip under load — energy KPIs catch it first, and CMMS closes the loop. Track energy KPIs at plant, area, and asset level inside OxMaint's energy-linked CMMS to make maintenance's contribution to GJ/tonne performance measurable and defensible.
Steel Plant Energy KPIs: GJ per Tonne Tracking Through CMMS
Build a KPI hierarchy that connects plant-level GJ/tonne to blast furnace coke rate, EAF kWh/tonne, rolling mill specific power, and compressed air kWh/Nm³ — so every energy deviation triggers a maintenance response before it compounds.
The Energy KPI Hierarchy: From Plant Gate to Asset Level
A working energy KPI system is a pyramid, not a flat scorecard. At the top sits the plant-gate metric — total GJ per tonne of crude steel — that boards and regulators care about. One level down, each major process area owns a sub-KPI that rolls up to it: coke rate (kg/tHM) and blast furnace gas recovery for the ironmaking area, kWh/tonne liquid steel and electrode consumption for the EAF area, specific fuel consumption (Sm³/tonne) for the reheating furnace, and kWh/tonne rolled for the hot and cold mills. Below that, every major consumer — each fan, each compressor, each pump train — carries a asset-level energy signature that maintenance owns. When the plant-gate number drifts, the hierarchy tells you exactly which area, and then which asset, is responsible. Without this structure, energy improvement projects chase the loudest complaint instead of the biggest leak.
Benchmark Ranges by Process Route
The single biggest determinant of a mill's GJ/tonne number is route mix — how much steel comes from the blast furnace–basic oxygen route versus scrap-fed electric arc furnaces versus gas-based direct reduced iron. Each route has a fundamentally different energy floor. Comparing a BF-BOF integrated mill's 21 GJ/t to a scrap EAF minimill's 10 GJ/t is meaningless without route context. The right comparison is against best-in-class within your own route, adjusted for product mix. Below are the working ranges that engineering teams should hold themselves against when setting KPI targets and building the improvement roadmap inside OxMaint's energy tracking dashboards.
| Production Route | Energy Intensity Range | Best-in-Class | Dominant Energy Vector | Where Maintenance Moves the Number |
|---|---|---|---|---|
| BF-BOF Integrated | 17–23 GJ/tCS | ~17 GJ/tCS | Coking coal, BF gas, coke oven gas | Coke rate, stove efficiency, BF gas recovery, blower reliability |
| Scrap-Based EAF | 9.1–12.5 GJ/tCS | ~9 GJ/tCS | Grid electricity, natural gas burners | Transformer losses, electrode positioning, off-gas system, oxy-fuel tuning |
| DRI-EAF (Gas-based) | 17–21 GJ/tCS | ~17 GJ/tCS | Natural gas reformer, electricity | Reformer tube integrity, heat recovery, EAF power-on time |
| DRI-EAF (Coal-based) | 28.3–30.9 GJ/tCS | ~28 GJ/tCS | Thermal coal, electricity | Rotary kiln refractory life, waste heat recovery, ID fan efficiency |
| Hot Rolling (add-on) | 1.8–2.6 GJ/t rolled | ~1.8 GJ/t | Reheat furnace fuel, mill drive power | Burner tuning, skid cooling losses, mill stand alignment, descaler pressure |
| Cold Rolling & Finishing | 0.9–1.6 GJ/t rolled | ~0.9 GJ/t | Electricity, annealing gas | Annealing furnace seals, roll cooling pumps, motor load matching |
Submetering Strategy: You Cannot Improve What You Do Not Measure
The biggest reason mills fail to move their GJ/tonne number is not indifference — it is that the plant-gate meter is the only meter. When a single utility bill covers 200,000 tonnes of crude steel and 40 major consumers, no one can attribute a 2% jump to a specific asset. A workable submetering plan installs class-1 electrical meters on every drive above 200 kW, thermal-mass fuel meters on every burner circuit above 5 GJ/hr, ultrasonic flow meters on every compressed air header, and steam flow meters on every process branch. Each meter feeds a tag into the CMMS asset record, and the CMMS calculates energy-per-production for each asset every shift.
Linking Energy KPIs to Maintenance: The Closed Loop
Energy KPIs without maintenance actions are dashboards that decorate management meetings. The lower-quartile mills are the ones that treat every KPI breach as a work-order trigger. A reheating furnace's specific fuel consumption drifts 4% above baseline over two weeks — the CMMS raises an inspection ticket for burner combustion tuning, refractory hot-spot survey, and stack O₂ calibration. A rolling mill's kWh/tonne rises with no product mix change — the CMMS opens tickets for mill stand bearing vibration analysis, gearbox oil sampling, and hydraulic pressure verification. This closed loop is what turns energy KPIs from a reporting exercise into a margin-recovery mechanism.
Make Every Kilojoule Traceable to an Asset and a Work Order
OxMaint ingests submeter data, holds asset-level baselines, and raises energy-linked work orders automatically — turning your GJ/tonne KPI from a lagging report into an operating control.
Maintenance-Linked Energy Metrics That Actually Move GJ/Tonne
Not every energy KPI is worth the effort of measuring. The metrics below are the ones where maintenance work directly and repeatably shifts the number — and where the return on tracking effort is highest for a mid-sized integrated or EAF plant. Each is expressed in a form that can be pulled straight into the OxMaint asset record and compared shift over shift.
Frequently Asked Questions
What is a good GJ per tonne target for a modern integrated steel plant?
How does scrap-based EAF compare to BF-BOF on energy intensity?
Which submeters should we install first if budget is limited?
How does a CMMS link energy KPIs to maintenance work orders?
What are the highest-leverage maintenance actions for reducing GJ/tonne?
Turn GJ/Tonne Into an Asset-Level Operating Metric
Stop treating energy intensity as a monthly report line. OxMaint connects every submeter to every asset, holds baselines by product mix, and closes the loop from KPI deviation to maintenance action — so the number moves because your work moved it.