The integrated steel mill was hitting production targets—shipping 2.4 million tons annually—but the CFO couldn't explain the $18 million variance in energy costs year over year. The blast furnace operators insisted nothing had changed. When AI-powered energy monitoring finally correlated production data with energy consumption at 15-second intervals, the pattern emerged: subtle changes in raw material quality were forcing longer heating cycles, and shift-to-shift variations in practice were costing 340 kWh per ton above benchmark. Within six months of implementing correlation-based optimization, energy intensity dropped 12%—saving $2.1 million monthly while increasing throughput 4%. That's the power of understanding the energy-production relationship in steel manufacturing.
Steel production is the world's most energy-intensive manufacturing process, consuming 20-25 GJ per ton and accounting for 7-8% of global CO₂ emissions. Yet most steel plants operate with surprisingly primitive energy management—monthly utility bills compared against tonnage shipped, with no visibility into the complex dynamics driving consumption. AI-powered correlation analysis changes this equation fundamentally, revealing the hidden relationships between production parameters, equipment efficiency, and energy consumption that determine actual costs. Schedule a consultation to discover how energy-production correlation can transform your steel plant's efficiency.
Why Energy-Production Correlation Matters
Steel plants have always tracked energy consumption and production volumes separately. The revolutionary insight is correlating them at granular levels—understanding not just how much energy was used, but why, when, and how production variables drove that consumption. This correlation unlocks optimization opportunities that aggregate metrics hide.
Energy Consumption by Production Stage
Steel production involves multiple energy-intensive processes, each with distinct consumption patterns and optimization opportunities. Understanding the baseline energy distribution is essential before correlation analysis can identify anomalies and improvement potential.
Key Correlation Variables
Energy consumption in steel plants correlates with dozens of measurable variables. AI systems continuously analyze these relationships, identifying which factors most influence energy use and detecting when correlations shift—signaling equipment degradation or process drift.
Correlation Analysis Methods
Moving beyond simple energy-per-ton metrics requires sophisticated analytical approaches. AI systems employ multiple correlation techniques to untangle the complex web of factors driving energy consumption in steel production.
| Method | Application | Insight Generated | Update Frequency |
|---|---|---|---|
| Multivariate Regression | Baseline modeling | Expected energy consumption given current production conditions | Daily recalibration |
| Principal Component Analysis | Variable reduction | Identifies which factors have strongest influence on energy | Weekly analysis |
| Time-Series Correlation | Lag analysis | Reveals delayed effects—how today's decisions impact tomorrow's energy | Continuous |
| Anomaly Detection | Variance identification | Flags when actual consumption deviates from expected correlation | Real-time (15-second) |
| Causal Inference | Root cause analysis | Distinguishes correlation from causation for actionable recommendations | On-demand |
| Cluster Analysis | Operating mode identification | Groups similar production states to compare energy performance | Shift-by-shift |
Traditional vs. AI-Powered Energy Management
The contrast between traditional energy accounting and AI-powered correlation analysis represents a fundamental shift in how steel plants understand and optimize their energy consumption.
- Monthly utility bills divided by total tonnage
- No visibility into energy drivers
- Variance explained by "production mix"
- Energy viewed as fixed overhead cost
- Reactive response to cost overruns
- Real-time correlation across 47+ variables
- Root cause identification within minutes
- Predicted vs. actual energy comparison
- Energy as optimizable production input
- Proactive optimization recommendations
Process-Specific Correlation Insights
Each major process area in steel production has unique energy-production relationships. AI correlation analysis reveals process-specific optimization opportunities that aggregate monitoring misses entirely.
| Process | Key Correlations | Typical Findings | Optimization Potential |
|---|---|---|---|
| Blast Furnace | Fuel rate vs. burden permeability, blast moisture, hot blast temperature | Burden distribution irregularities cause 5-8% excess fuel consumption | 8-12% fuel rate reduction |
| BOF Steelmaking | Oxygen consumption vs. hot metal Si, tap-to-tap time, scrap ratio | Sub-optimal hot metal chemistry extends blow times significantly | 15-20% oxygen reduction |
| EAF Steelmaking | kWh/ton vs. scrap mix, bucket sequence, foamy slag practice | Scrap density and chemistry drive 40-60 kWh/ton variance | 10-15% electricity reduction |
| Reheating Furnace | Fuel consumption vs. charging temperature, slab sequence, residence time | Cold charging costs 150-200 kWh/ton versus hot direct rolling | 20-30% fuel reduction |
| Rolling Mills | Motor load vs. reduction schedule, lubrication, roll wear | Worn rolls and sub-optimal passes increase motor load 8-12% | 5-8% electricity reduction |
| Utilities | Compressed air/oxygen vs. production load, leak rate, ambient conditions | 50-60% of compressed air capacity runs at partial load inefficiently | 25-35% utility energy reduction |
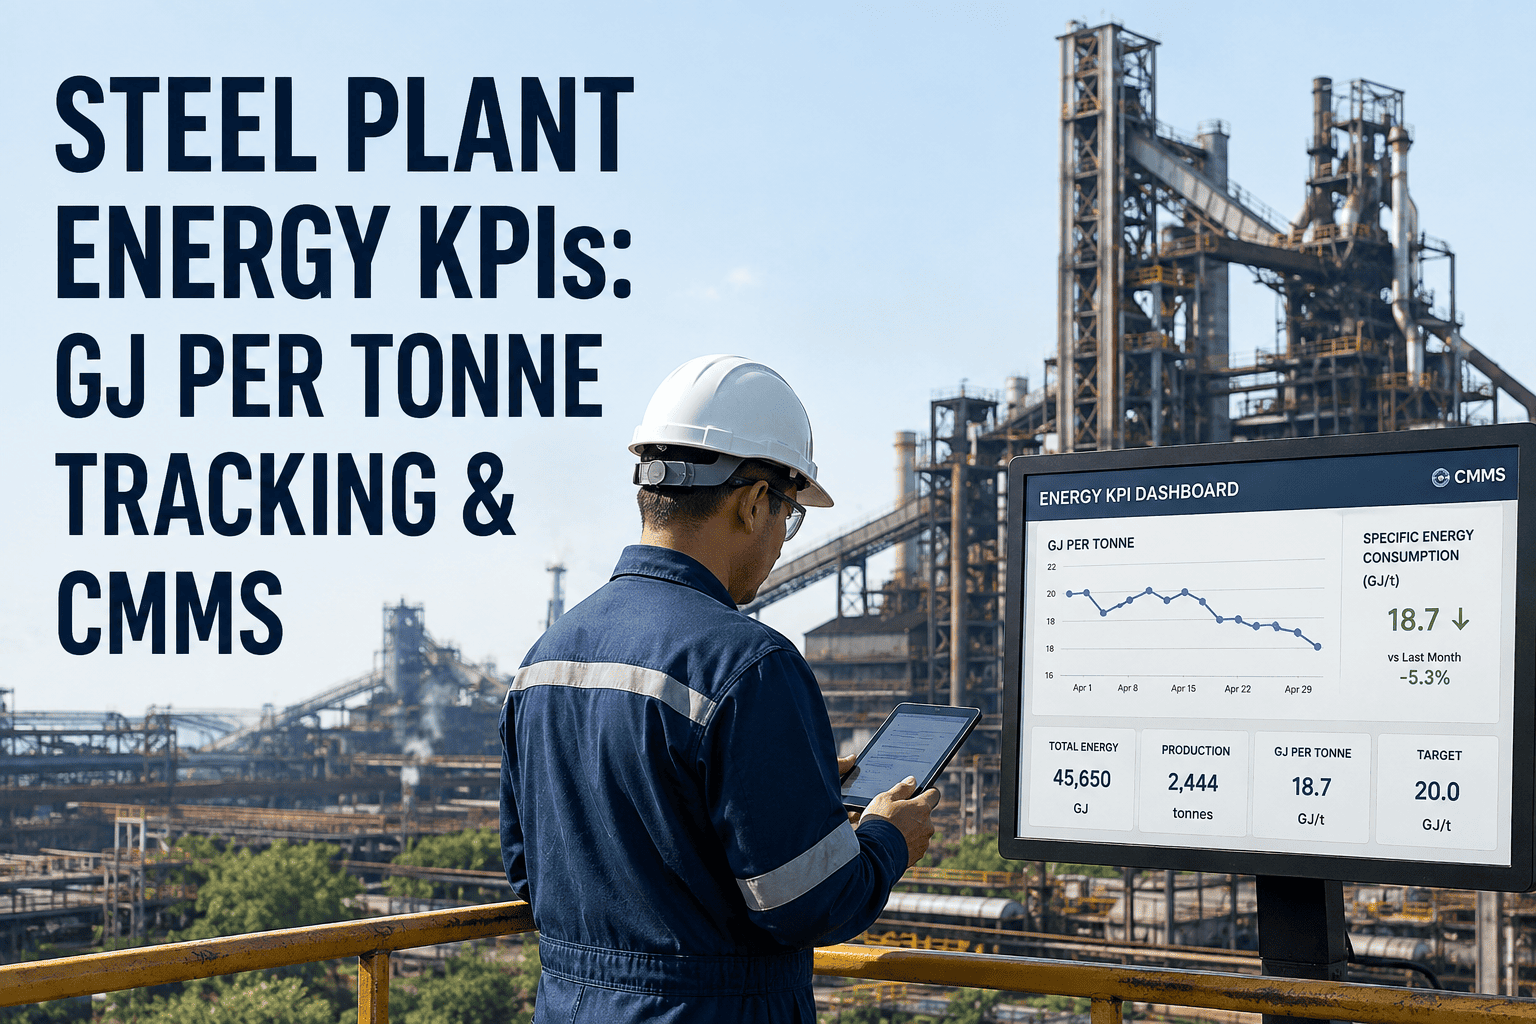
Real-Time Monitoring Dashboard
Effective energy-production correlation requires visualization that makes complex relationships intuitive and actionable. Modern AI platforms present correlation insights through purpose-built dashboards for operators, engineers, and management.
ROI of Energy-Production Correlation
Steel plants implementing AI-powered energy correlation analysis consistently achieve measurable returns across multiple value streams—from direct energy savings to improved production reliability and reduced carbon compliance costs.
Implementation Architecture
Deploying AI-powered energy-production correlation requires integration with existing plant systems to collect the data streams that make correlation analysis possible. Modern platforms are designed for non-invasive deployment alongside existing infrastructure.
| Data Source | Integration Method | Typical Parameters | Update Frequency |
|---|---|---|---|
| Power Meters | Modbus/OPC-UA | kW, kWh, power factor, demand by area | 1-15 seconds |
| Gas Flow Meters | OPC-UA/Historian | Natural gas, BF gas, coke oven gas flows | 1-15 seconds |
| Process Control (Level 1/2) | OPC-UA/API | Temperatures, pressures, flows, weights | 1-5 seconds |
| MES/Level 3 Systems | Database/API | Production orders, grades, chemistry targets | Event-driven |
| Lab Systems (LIMS) | Database/API | Raw material analysis, product chemistry | Per sample |
| Weather Services | REST API | Temperature, humidity, barometric pressure | 15 minutes |
Implementation Roadmap
Successful deployment of energy-production correlation analysis follows a structured approach—establishing baselines, training AI models, and progressively expanding coverage across the plant.
Carbon Compliance Integration
Energy-production correlation directly supports carbon compliance requirements. As steel producers face increasing emissions regulations and carbon pricing mechanisms, understanding the relationship between production decisions and carbon intensity becomes essential.
| Requirement | Correlation Contribution | Compliance Value |
|---|---|---|
| Scope 1 Emissions | Real-time correlation of fuel consumption with production variables | Accurate, auditable emissions data by product and process |
| Scope 2 Emissions | Electricity consumption tracking correlated with grid carbon intensity | Hourly carbon intensity reporting for time-of-use optimization |
| Product Carbon Footprint | Energy allocation by grade, order, and customer | Product-level carbon intensity for customer certifications |
| Reduction Verification | Before/after correlation analysis proving optimization impact | Documented evidence for carbon credit applications |
| CBAM Compliance | Embedded emissions calculation by production route | EU border adjustment documentation for exports |
Common Challenges & Solutions
Implementing energy-production correlation in steel plants involves navigating unique challenges related to data quality, organizational change, and the complexity of integrated operations.
| Challenge | Impact | Solution |
|---|---|---|
| Data silos between departments | Incomplete correlation picture, missing key variables | Central data platform with automated collection from all sources; no manual data entry required |
| Legacy equipment without sensors | Gaps in energy measurement granularity | Non-invasive clamp-on meters and IoT sensors; AI inference from available data points |
| Resistance to transparency | Operators concerned about performance visibility | Position as optimization tool, not surveillance; involve operators in dashboard design |
| Complex product mix | Difficult to establish fair energy baselines | AI models that normalize for product family, automatically adjusting expectations |
| Multiple energy sources | BF gas, COG, natural gas, electricity hard to compare | Common energy units (GJ) and carbon intensity metrics for unified analysis |