Your steel plant generates thousands of maintenance data points every day — work orders opened and closed, parts consumed, equipment running and stopping, technicians responding and repairing. But if that data sits in spreadsheets reviewed monthly, it's archaeology — interesting but useless for preventing tomorrow's breakdown. The plants that consistently outperform their competitors have one thing in common: they track the right maintenance KPIs in real time and connect every metric to production outcomes. Not 50 metrics that nobody reads. Not 3 metrics that tell you nothing actionable. The specific 15 KPIs on this page — covering work management, equipment reliability, cost efficiency, and predictive performance — are what separate world-class steel plant maintenance from the industry average. OXmaint's dashboard calculates all 15 automatically, giving every role in your organization the visibility they need to make better decisions every shift.
Live Dashboard · Steel Plant Maintenance · 2026
The 15 Maintenance KPIs That Separate World-Class Steel Plants From Everyone Else
Most steel plants track maintenance spending — and almost nothing else. World-class operations track 12–15 KPIs in real time, review them every shift, and tie every metric directly to production outcomes. The result: 40–60% less unplanned downtime, 25% lower total maintenance cost, and 2–5× return on every maintenance dollar invested. Here's what to measure, what good looks like, and how OXmaint turns raw data into the dashboard your plant actually needs.
Why Most Steel Plants Measure the Wrong Things
The average steel plant maintenance department tracks 2–3 metrics: total maintenance spend, headcount, and maybe a crude availability number. These are lagging indicators — they tell you what already happened. By the time monthly cost reports show a problem, the damage was done weeks ago. World-class plants track leading indicators that predict problems before they materialize. OXmaint's real-time KPI dashboard provides both — and connects every metric to the production outcomes that leadership cares about.
What Average Plants Track
Total maintenance budget spent
Number of work orders completed
Headcount / overtime hours
Lagging indicators. Tells you what happened. Can't change anything.
What World-Class Plants Track
Planned vs reactive work ratio
Schedule compliance & execution quality
MTBF / MTTR per equipment class
Predictive alert conversion rate
Maintenance cost as % of replacement asset value
OEE impact per maintenance event
Leading + lagging indicators. See problems forming. Fix them early.
The 15 Essential Maintenance KPIs
These 15 metrics — organized into four categories — give complete visibility into maintenance effectiveness. Each one has a clear benchmark, a specific improvement action, and a direct connection to production value. OXmaint calculates all 15 automatically from work order data, sensor inputs, and production system integration.
Work Management KPIs
How well you plan, schedule, and execute maintenance work
Planned work orders ÷ total work orders
Average:40–50%
World-class:80–90%
The single most important maintenance KPI. Every 10-point increase in planned work ratio reduces total maintenance cost by 8–12% because planned work costs 3–5× less than reactive work.
Scheduled jobs completed on time ÷ total scheduled jobs
Average:55–65%
World-class:≥90%
Low schedule compliance means your planning process isn't working — jobs get bumped by emergencies, parts aren't available, or crews are pulled to reactive work. OXmaint tracks every schedule break with a reason code.
PMs completed within window ÷ PMs due
Average:70–80%
World-class:≥95%
Missed PMs are the number one source of "unexpected" failures. If your PM compliance is 75%, you're systematically skipping maintenance on 25% of your critical equipment.
04
Work Order Backlog (Weeks)
Open work order hours ÷ available weekly crew hours
Average:6–12 weeks
World-class:2–4 weeks
A growing backlog means you're falling behind. Over 6 weeks signals systemic understaffing or poor prioritization. Under 2 weeks may mean you're not identifying enough work.
Equipment Reliability KPIs
How well your equipment performs — the outcome of maintenance quality
05
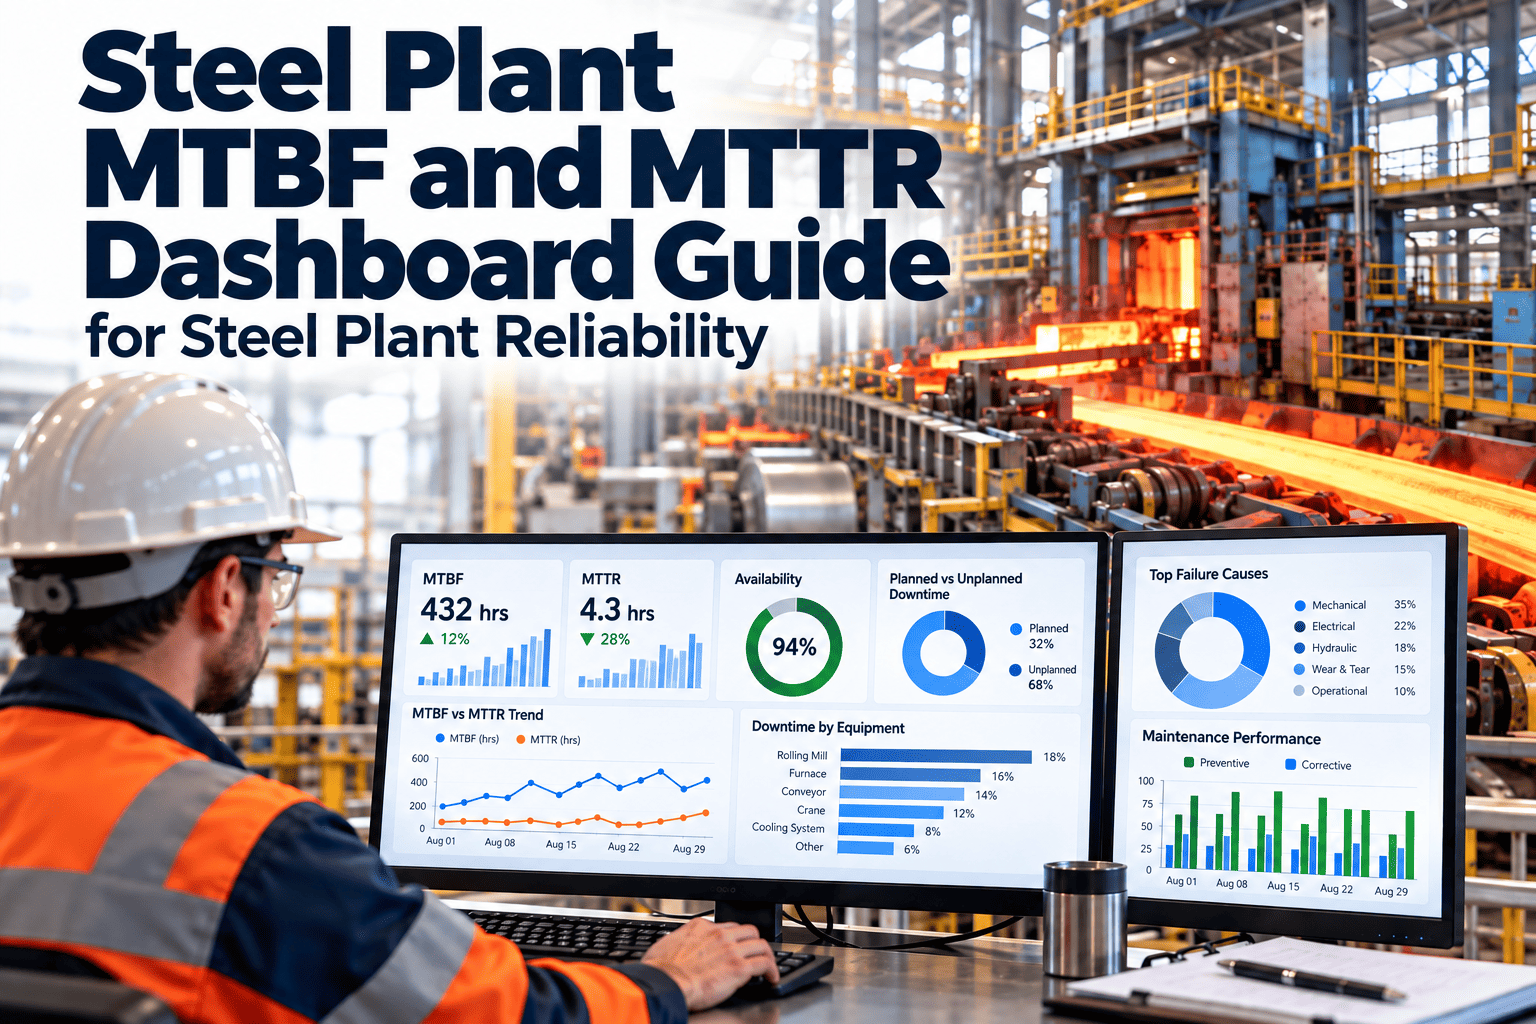
MTBF (Mean Time Between Failures)
Total operating time ÷ number of failures
Average (critical):200–400 hrs
World-class:800–1,500 hrs
Track per equipment class, not plant-wide. A rising MTBF on your hot strip mill drives means your maintenance program is working. A falling MTBF on caster hydraulics tells you where to focus next.
06
MTTR (Mean Time to Repair)
Total repair time ÷ number of repairs
Average:6–12 hrs
World-class:2–4 hrs
MTTR drops when you pre-plan repairs, pre-stage parts, and document procedures. A 50% MTTR reduction doubles the value of every maintenance intervention by halving the production impact.
07
Equipment Availability
Uptime ÷ (uptime + downtime)
Average:82–87%
World-class:93–96%
The KPI that leadership watches most closely. But availability alone is insufficient — a plant can show 90% availability while running 15% below rated speed. Always pair with OEE for the complete picture.
08
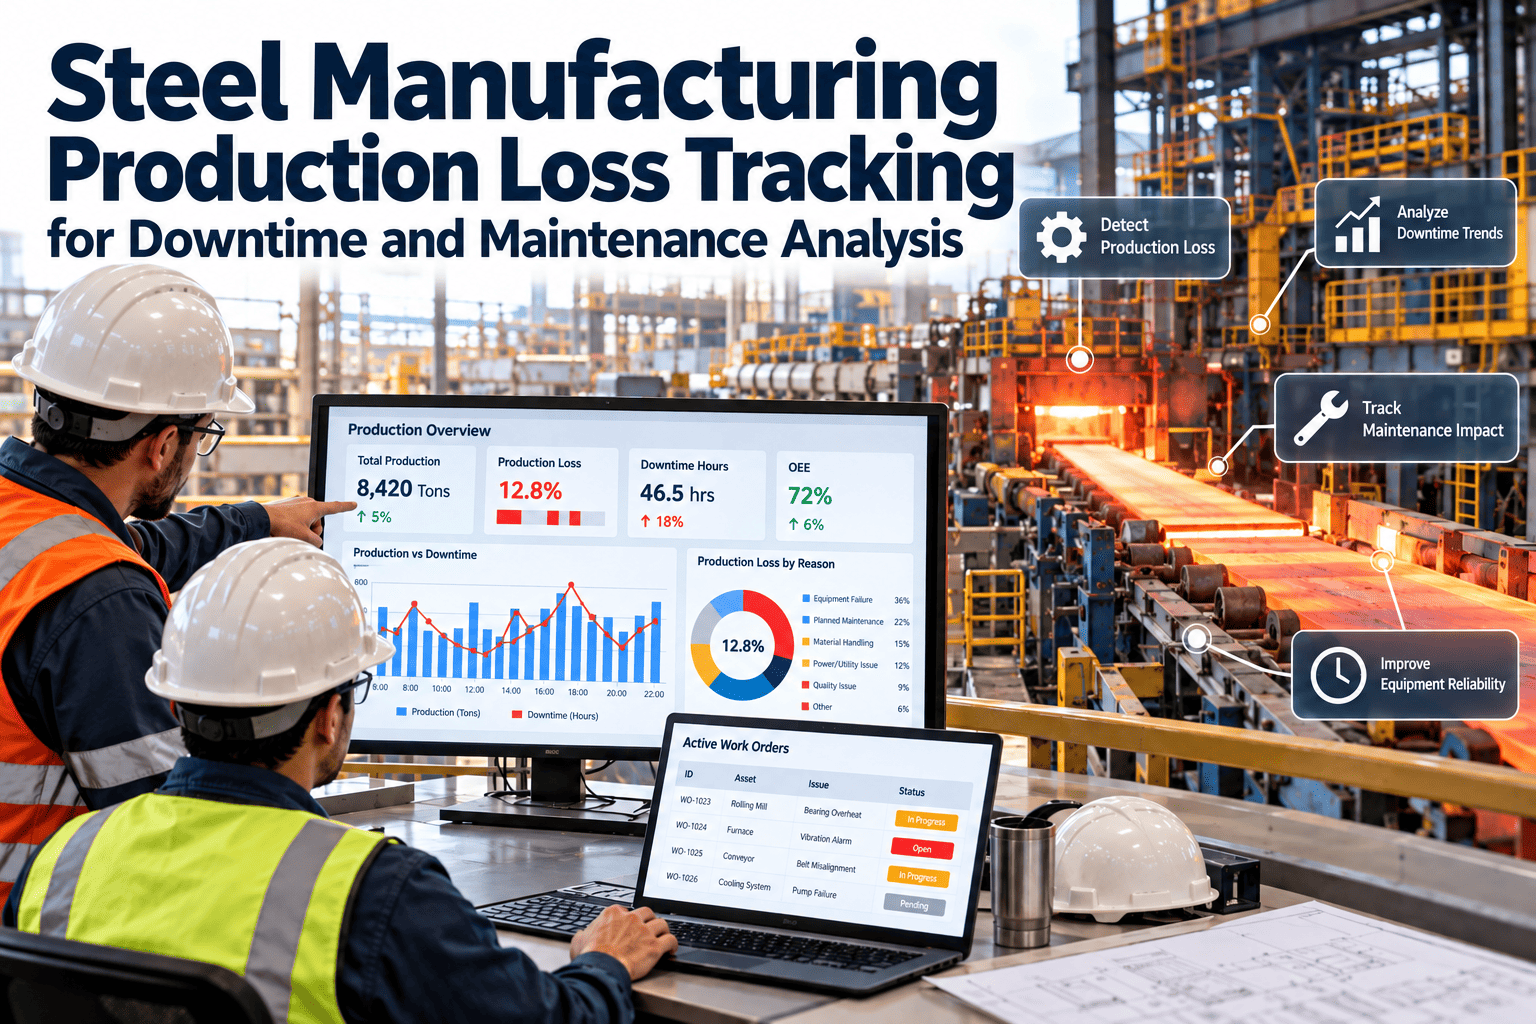
Overall Equipment Effectiveness
Availability × Performance × Quality
Average:52–58%
World-class:78–85%
The master metric. Every other KPI on this dashboard feeds into OEE.
OXmaint's OEE module breaks losses into the specific maintenance categories your team can act on — connecting every work order to its production impact.
Track All 15 KPIs From Day One
OXmaint calculates every KPI on this page automatically from work order data, sensor inputs, and production system integration. No spreadsheets. No manual calculation. Real-time visibility for every role.
Cost & Efficiency KPIs
How efficiently you convert maintenance spending into equipment reliability
09
Maintenance Cost / Replacement Asset Value
Annual maintenance cost ÷ current replacement value of assets
Average:5–8%
World-class:2.5–4%
The only cost KPI that matters when benchmarking across plants. Absolute dollar comparisons are meaningless — a plant with $2B in assets should spend more than a plant with $500M. RAV normalizes the comparison.
10
Reactive Maintenance Cost %
Emergency/breakdown repair cost ÷ total maintenance cost
Average:35–55%
World-class:<15%
Reactive work costs 3–5× more than planned work (overtime, expedited parts, collateral damage, production loss). Reducing this percentage is the fastest way to cut total maintenance cost without reducing reliability.
11
Spare Parts Inventory Turns
Annual parts consumption ÷ average inventory value
Average:0.8–1.2 turns
World-class:2.0–3.0 turns
Low turns mean you're carrying too much dead stock. High turns with stockouts mean you're carrying too little.
OXmaint's parts management balances availability with inventory cost using consumption-based forecasting.
12
Maintenance Cost Per Ton of Steel
Total maintenance cost ÷ tons produced
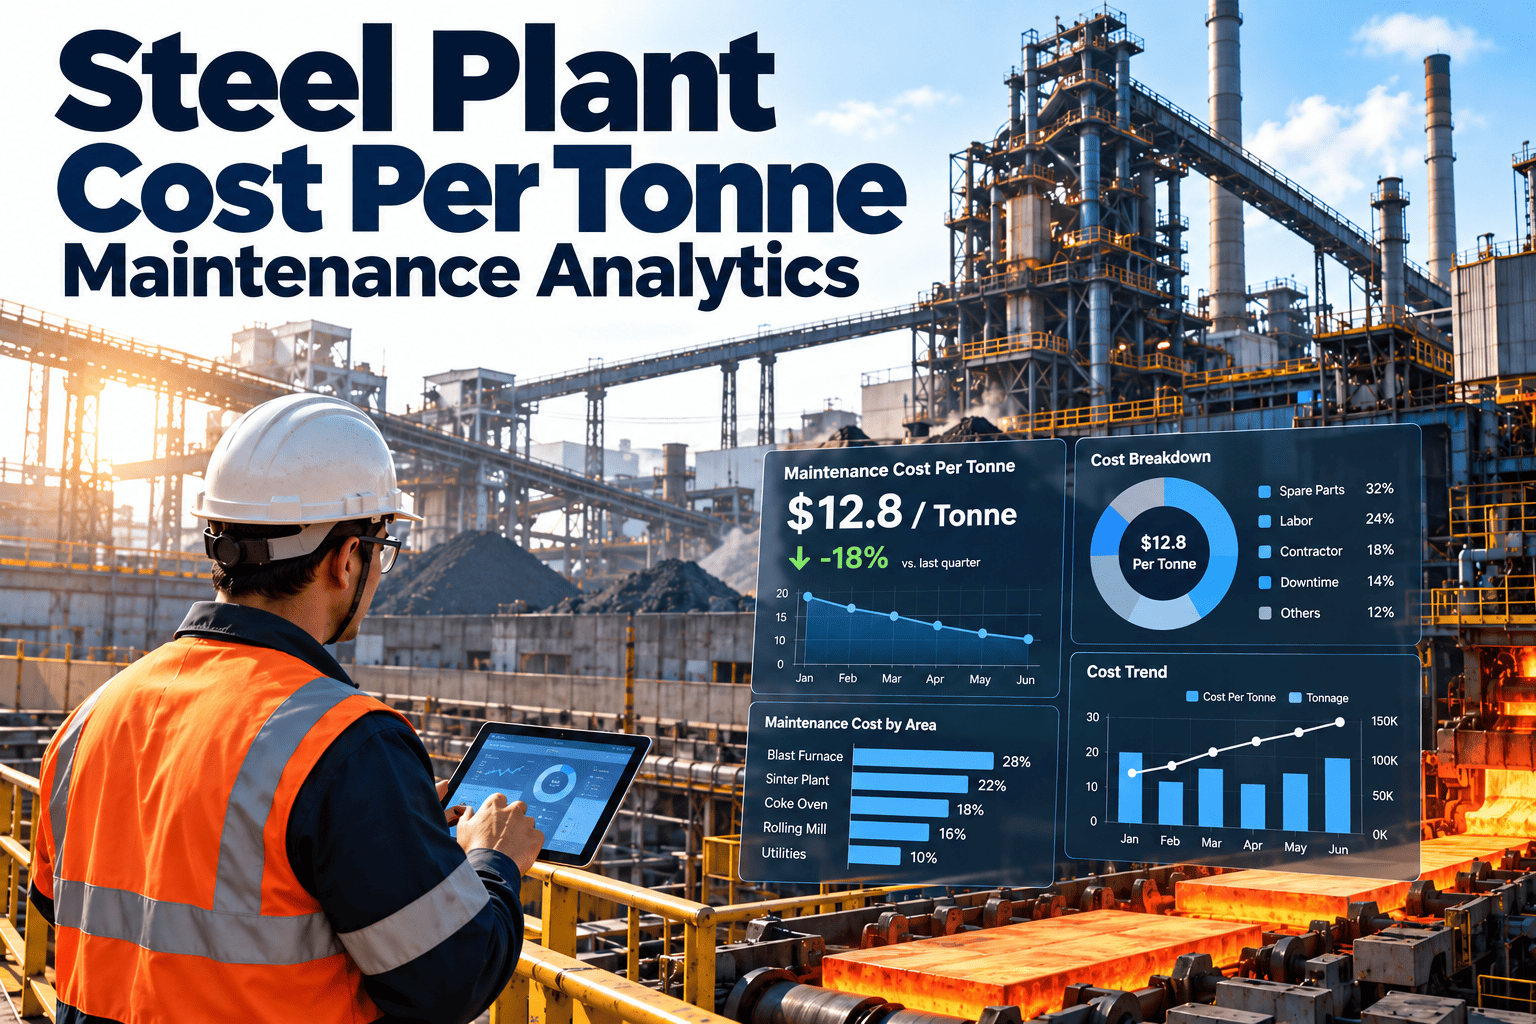
Average (integrated):$18–28/ton
World-class:$10–15/ton
The CFO's metric. Simple, comparable, and directly tied to profitability. A $10/ton improvement on 2M tons = $20M annual savings. Track monthly and decompose by process area to find where cost concentrates.
Predictive & Advanced KPIs
Forward-looking metrics that indicate where you're headed, not where you've been
13
Predictive Alert Conversion Rate
Alerts that resulted in confirmed action ÷ total alerts issued
Initial (months 1–3):60–75%
Mature (6+ months):≥88%
Measures AI accuracy and team trust. If alerts aren't being acted on, either the AI is generating too many false positives or the team doesn't trust the system. Both are fixable — and this KPI tells you which problem to solve.
14
Failures Prevented (Monthly)
Confirmed failure events avoided through predictive action
Target:3–8/month
Dollar value:$500K–$3M/month saved
The ultimate ROI metric for predictive maintenance. Each prevented failure has a calculated cost avoidance — emergency repair cost + production loss + collateral damage that didn't happen. This is the number that justifies the entire investment.
15
Maintenance-Driven OEE Impact
OEE points lost to maintenance-related causes
Average:12–20 OEE points lost
World-class:<5 points lost
This connects maintenance directly to production in a language everyone understands. When the plant manager asks "what's maintenance costing us?" — this KPI gives the answer in OEE points, not dollars.
OXmaint's real-time OEE module tags every loss with its maintenance root cause.
The Maturity Ladder: Where Is Your Plant?
Steel plant maintenance operations fall into five maturity levels. Most sit at Level 2. World-class operates at Level 4–5. The jump from each level to the next is worth $3–8M annually for a typical integrated mill — and each level builds on the one below it.
Level 5
Prescriptive
AI recommends optimal actions and timing. System learns from every outcome. Maintenance scheduling auto-adjusts based on production, market, and condition data simultaneously.
KPIs: All 15 tracked in real time. Planned ratio >90%. OEE loss from maintenance <3 points.
Level 4
Predictive
AI monitors 80–120 critical assets. Condition-based scheduling replaces fixed intervals. Work orders generated from sensor data, not calendar dates.
KPIs: 12–15 tracked. Planned ratio 75–85%. Predictive alerts converting at >85%.
Level 3
Proactive
Digital CMMS fully deployed. PM compliance >90%. Root cause analysis on every significant failure. Shift handovers digitized. Parts management data-driven.
KPIs: 8–12 tracked. Planned ratio 60–75%. MTBF trending upward. Backlog <6 weeks.
Level 2
Planned (Most Steel Plants)
PM programs exist but compliance is inconsistent. Work orders tracked but not analyzed. Paper and spreadsheets still dominate daily workflow.
KPIs: 3–5 tracked, mostly lagging. Planned ratio 40–55%. Reactive work >40% of cost.
Level 1
Reactive
Fix it when it breaks. No systematic PM. Maintenance knowledge lives in people's heads. Spare parts managed by experience, not data.
KPIs: Budget only. No visibility into reliability, planning quality, or equipment health.
Jump Two Levels in 12 Months
Most steel plants go from Level 2 to Level 4 within 12–18 months with OXmaint. The platform provides the digital foundation, predictive intelligence, and KPI visibility to skip the years of incremental improvement that traditional approaches require.
Building Your Dashboard: What Each Role Needs
OEE by process area · Equipment availability · Maintenance cost/ton · Unplanned downtime trend · Failures prevented ($ saved)
Why these: Connects maintenance performance to production and financial outcomes. Answers "is maintenance helping or hurting our business results?"
Planned work ratio · Schedule compliance · PM compliance · MTBF/MTTR · Backlog · Reactive cost % · Predictive alert conversion · Work order aging
Why these: Shows whether the maintenance process is improving. Leading indicators that predict next month's availability and cost — not lagging indicators that confirm last month's problems.
MTBF by equipment class · Failure mode Pareto · Repeat failure rate · Asset health scores · RUL estimates · Root cause completion rate
Why these: Identifies which specific equipment and failure modes to attack next. Data-driven prioritization of reliability improvement projects with quantified ROI for each.
Proven Results
Planned Work Ratio
40% → 82%
12 months
Equipment Availability
84% → 93%
18 months
Maintenance Cost/Ton
$24 → $14
24 months
OEE (Plant-Wide)
55% → 76%
18 months
MTBF (Critical)
280 → 840 hrs
12 months
Annual Savings
$18M+
Per integrated mill
Every improvement above started with measurement. You can't improve what you can't see — and you can't see anything useful with monthly spreadsheet reports. OXmaint's KPI dashboard makes every metric on this page visible in real time, connecting maintenance work to the production outcomes that fund the operation. Learn how AI failure detection drives the predictive KPIs, how real-time OEE monitoring connects maintenance to production, how EAF digital maintenance applies these KPIs to electric steelmaking, and how caster AI scheduling improves caster-specific reliability metrics.
Stop Guessing. Start Measuring. Start Improving.
OXmaint calculates all 15 KPIs automatically from day one — giving maintenance managers, reliability engineers, and plant leadership the real-time visibility that world-class steel operations require.
Frequently Asked Questions
How quickly can we start tracking these KPIs with OXmaint?
Basic KPIs (planned ratio, schedule compliance, PM compliance, backlog) are available within 2–4 weeks of deployment as work order data flows in. Advanced KPIs (MTBF/MTTR by equipment class, predictive conversion rate, OEE impact) require 30–60 days of accumulated data. Most plants have meaningful dashboards within 45 days.
What if our current data quality is poor?
Every plant starts with imperfect data — this is normal. OXmaint's implementation includes data quality improvement as a core workstream: standardizing downtime codes, configuring equipment hierarchies, and building work order discipline. KPI accuracy improves steadily as data quality improves. Don't wait for perfect data to start — start tracking and let the system drive data quality improvement.
Should we track all 15 KPIs from the start?
Start with 5–6 core KPIs: planned work ratio, schedule compliance, PM compliance, equipment availability, and maintenance cost/ton. Add MTBF/MTTR and backlog at 3 months. Add predictive and OEE-linked KPIs at 6 months when AI monitoring is deployed. Trying to track everything from day one overwhelms the team.
How do we benchmark our KPIs against other steel plants?
OXmaint provides industry benchmark ranges for every KPI based on plant type (integrated, mini-mill, specialty), size, and geography. The benchmarks on this page are representative — your specific targets should account for equipment age, product mix, and market conditions. The goal isn't to match a benchmark — it's to improve consistently from wherever you start.
What's the relationship between KPI tracking and actual cost reduction?
Plants that track and actively manage 10+ maintenance KPIs consistently achieve 20–35% lower total maintenance cost than plants tracking 3 or fewer. The KPIs don't reduce cost directly — they make the problems visible so your team can act. Every dollar of savings starts with a metric that showed where the waste was hiding.