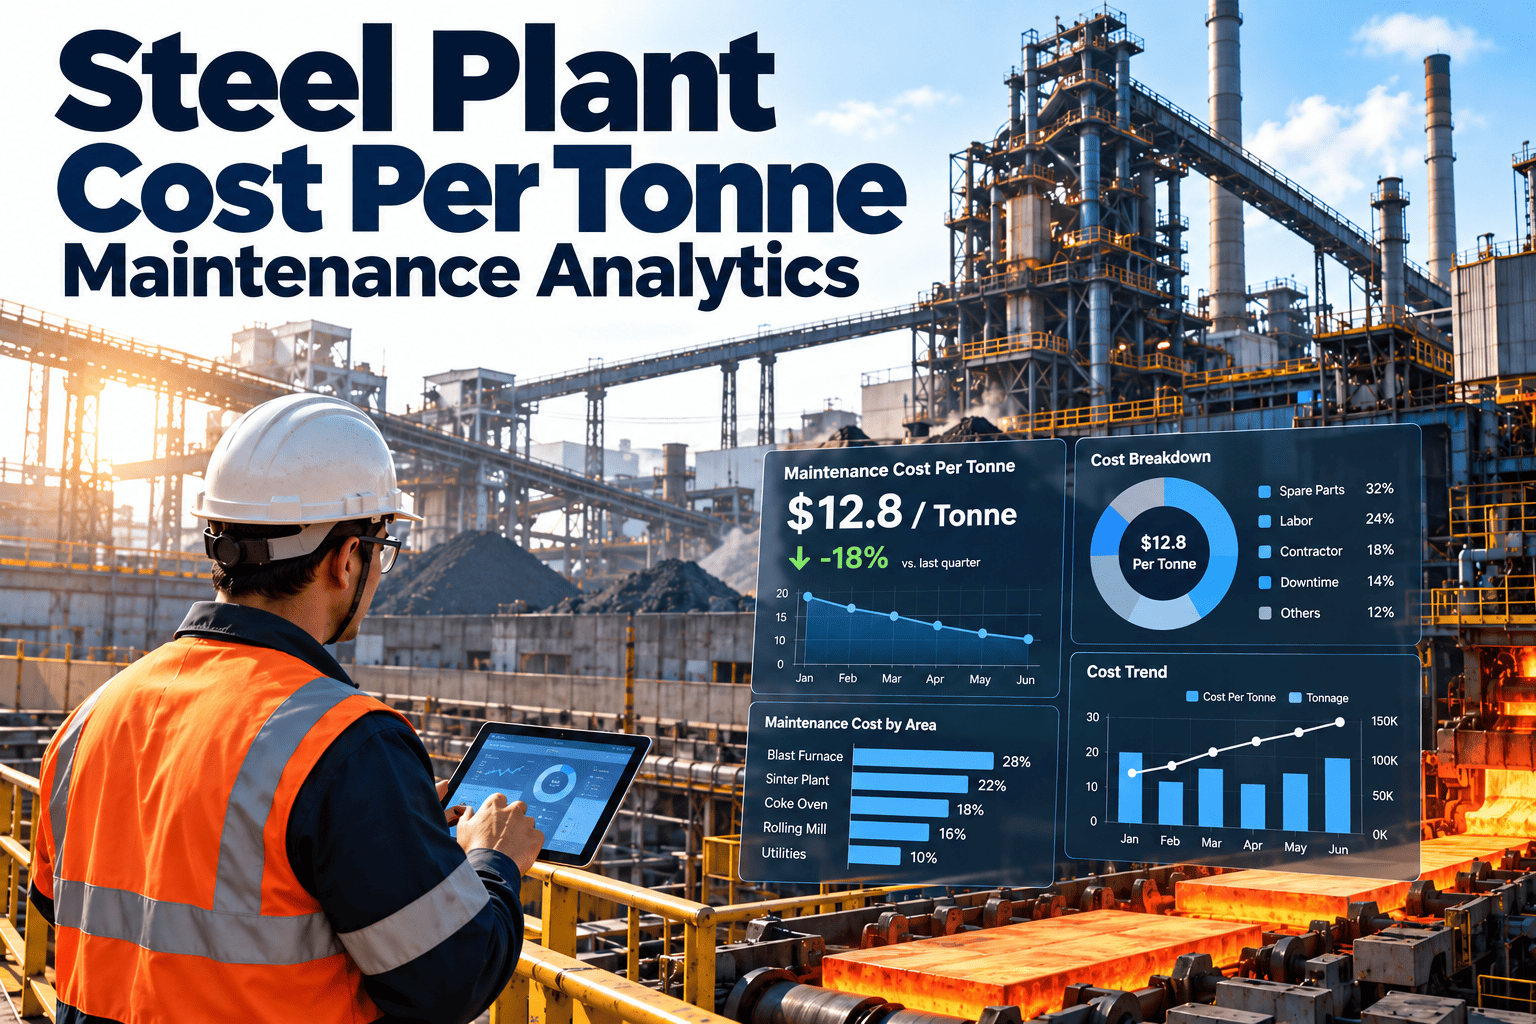
Maintenance cost per tonne is one of the few numbers that both the plant manager and the finance team already understand. The trouble is that a single plant-wide figure hides almost everything useful: which area is expensive, which assets keep consuming parts, which failure modes repeat, and whether a rising number comes from spend or from lower output. This guide shows how to build cost per tonne analytics by area, asset, failure mode, spare part and production output, with a steel plant CMMS as the source of the maintenance side of the ratio.
Steel Plant Cost Per Tonne Maintenance Analytics
Divide maintenance cost by tonnes produced, then keep dividing it: by area, by asset, by failure mode and by part. Oxmaint records labor, parts and contractor cost on every work order so the numerator is accurate enough to act on.
Why One Plant-Wide Number Misleads
A blended figure moves for many reasons at once. Output dips, a planned outage lands in the month, a large spare is capitalized or expensed differently, or one failure consumes the budget. Without a breakdown, the number invites arguments instead of decisions.
Choose the Right Tonne for Each Area
Steel production passes through several stages, and each reports its own output. Use the denominator that matches where the cost is incurred, and say which one you used.
| Area | Natural output measure | Typical cost drivers |
|---|---|---|
| Raw materials and sinter | Tonnes of sinter or material handled | Conveyor belts, idlers, crushers, screens, fans |
| Blast furnace and stoves | Tonnes of hot metal | Cooling systems, stove valves, blowers, casthouse equipment, refractory |
| Steelmaking | Tonnes of crude steel | Converter or furnace equipment, cranes, off-gas systems, ladle handling |
| Casting | Tonnes cast | Moulds, segments, rolls, hydraulics, cooling spray systems |
| Rolling and finishing | Tonnes rolled or shipped | Rolls and chocks, drives, gearboxes, coil handling, grinding |
| Utilities | Allocated to areas by consumption or output | Compressors, pumps, water treatment, oxygen and gas plants |
- Report cost per tonne for each stage, then show a plant-level figure on tonnes of crude steel or shipped product, clearly labelled.
- Agree allocation rules for shared utilities and service departments once, and write them down.
- Keep production data and maintenance data on the same calendar so periods match.
Build the Cost Stack Behind the Number
Before you look at tonnes, make sure every cost line reaches a work order and an asset. Most analytics problems start with missing cost, not missing analysis.
Illustrative Example: Reading Cost Per Tonne by Area
The figures below are made up for illustration only. They show how a breakdown changes the conversation compared with one blended average.
- The plant average hides that one area carries most of the excess cost.
- Drilling into that area by asset class shows whether the issue is a few assets or a general pattern.
- Drilling by failure mode shows whether the money goes to wear, lubrication, electrical faults or operating damage.
Capture Every Rupee, Dollar or Euro on the Right Asset
Cost analytics are only as good as the work order data. Oxmaint records labor, parts and contractor cost against the asset and area where it was spent.
Find the High-Cost Losses With a Pareto Drill-Down
Costing Failure Modes Properly
A failure has a direct cost and a production cost. Both belong in the analysis, but keep them in separate columns so they are never confused.
| Cost element | Where the data comes from | Watch out for |
|---|---|---|
| Direct repair cost | Labor, parts and contractor cost on the work order | Costs booked later to a general account |
| Secondary damage | Linked work orders on related assets | Failures recorded as separate, unrelated jobs |
| Lost production | Downtime hours from the production system | Using one rate for all products and periods |
| Expediting premiums | Rush purchasing, freight and overtime | Not coded as breakdown-related |
| Quality or yield impact | Quality system, downgrade or scrap records | Attributing without evidence |
Where an assumption is needed, such as the value of an hour of downtime, state it, get finance to agree it and apply it consistently.
Spare Parts Analytics
Planned Versus Reactive Work
Reactive work usually costs more per task than planned work because of overtime, expediting and secondary damage. Tracking the split alongside cost per tonne shows whether the number is falling for the right reason.
Reactive pattern
- High share of breakdown and emergency orders
- Overtime and rush purchases are routine
- Cost per tonne swings with every failure
- Budget explained after the fact
Planned pattern
- Most work scheduled with parts and permits ready
- Inspections catch defects before they fail
- Cost per tonne trends smoothly
- Budget built from asset and failure history
A common benchmark is annual maintenance cost as a share of replacement asset value, often quoted at roughly 2 to 5 percent. Treat it as a cross-check, since very low spend can signal deferred maintenance instead of efficiency.
Separate Volume Effects From Spending Effects
When cost per tonne moves, ask first whether spending changed, output changed or both. A simple decomposition keeps reviews honest.
- In month 2 the ratio rose with no extra spend, so the question is about output and fixed cost, not maintenance behaviour.
- In month 3 the ratio rose because spend rose, so the review should look at which assets and failure modes took the money.
- Show both cost and tonnes beside the ratio on every chart so readers can tell the difference.
Improvement Levers and Where They Show Up
| Lever | What changes in the data | Typical first step |
|---|---|---|
| Fix repeat failures | Fewer corrective orders on the same asset and failure code | Root cause review of the top five repeat failures |
| Shift reactive work to planned work | Higher planned share, lower overtime and expediting | Plan and kit parts for the next week's jobs |
| Condition-based maintenance | Defects found before failure, fewer secondary damages | Add inspection and monitoring on critical rotating equipment |
| Better stocking policy | Fewer emergency purchases, less idle inventory | Review stock levels against criticality and lead time |
| Contractor control | Clear scope, rates and completion records per order | Require orders for every outsourced job |
| Standard job plans | Shorter, more consistent jobs | Document the most frequent repairs |
Set Targets Without Starving the Plant
A cost per tonne target set from the top can push teams to defer work. Build targets from asset and failure data instead, and keep a reliability measure beside every cost measure.
Who Needs Which View
The same data serves different decisions. Give each role the cut it can act on, and avoid sending everyone the same plant-wide report.
| Role | Primary view | Decision it supports |
|---|---|---|
| Maintenance planner | Open backlog, planned share, job cost against estimate | What to schedule and kit next week |
| Area maintenance manager | Cost per tonne for the area, top assets, repeat failures | Where to focus improvement effort |
| Reliability engineer | Failure modes, MTBF, cost by cause and part | Which designs, intervals or parts to change |
| Plant or operations manager | Cost per tonne by stage with downtime impact | Where to invest and what trade-offs to accept |
| Finance and procurement | Spend by category, contractor and part, emergency purchases | Budget, contracts and stocking policy |
Reporting Errors That Undermine Trust
A Monthly Review Rhythm
Using the Numbers in Budget Planning
Once cost per tonne is reliable at asset level, it can feed next year's budget with far more credibility than last year's total plus a percentage.
- Start from recurring planned work, using job plans and intervals already in the system.
- Add expected corrective work from failure history, by asset class and failure mode.
- Add known outages and projects separately so they can be challenged on their own merits.
- Hold a contingency based on past breakdown cost, not a flat guess.
- Compare the result with cost per tonne at expected output, and explain any gap.
When the budget is built bottom-up from asset data, variances can be traced to a cause instead of argued over in general terms.
Data Quality Checklist Before You Trust the Dashboard
- Every work order has an asset, an area, a work type and a failure code.
- Labor hours and rates are recorded, including contractors.
- Parts are issued against orders, with unit cost from stores.
- Shutdown work is tagged separately from routine work.
- Production tonnes are available by the same area and period.
- Asset hierarchy matches the way the plant reports its areas.
- Closed orders are reviewed before month-end cost reports are issued.
Dashboard Layout That People Will Use
How Oxmaint Supports Cost Per Tonne Analytics
Frequently Asked Questions
Turn Cost Per Tonne Into a Management Tool
Move from one average to a drill-down your teams can act on. Oxmaint ties every cost to an asset, a failure and a tonne of output.