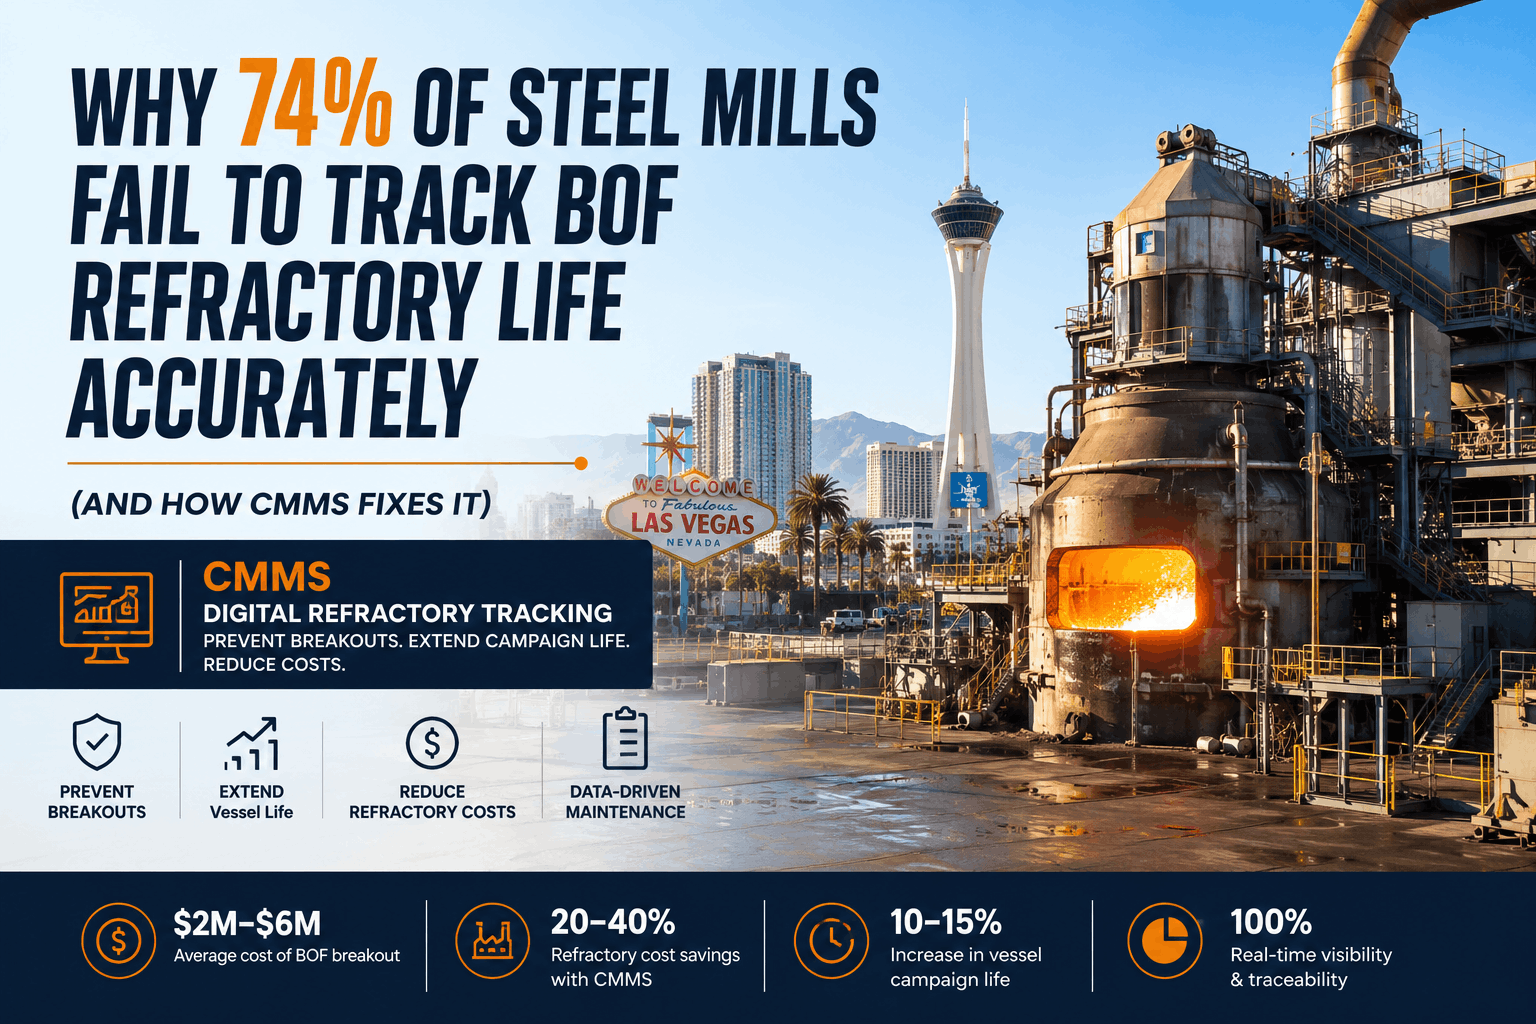
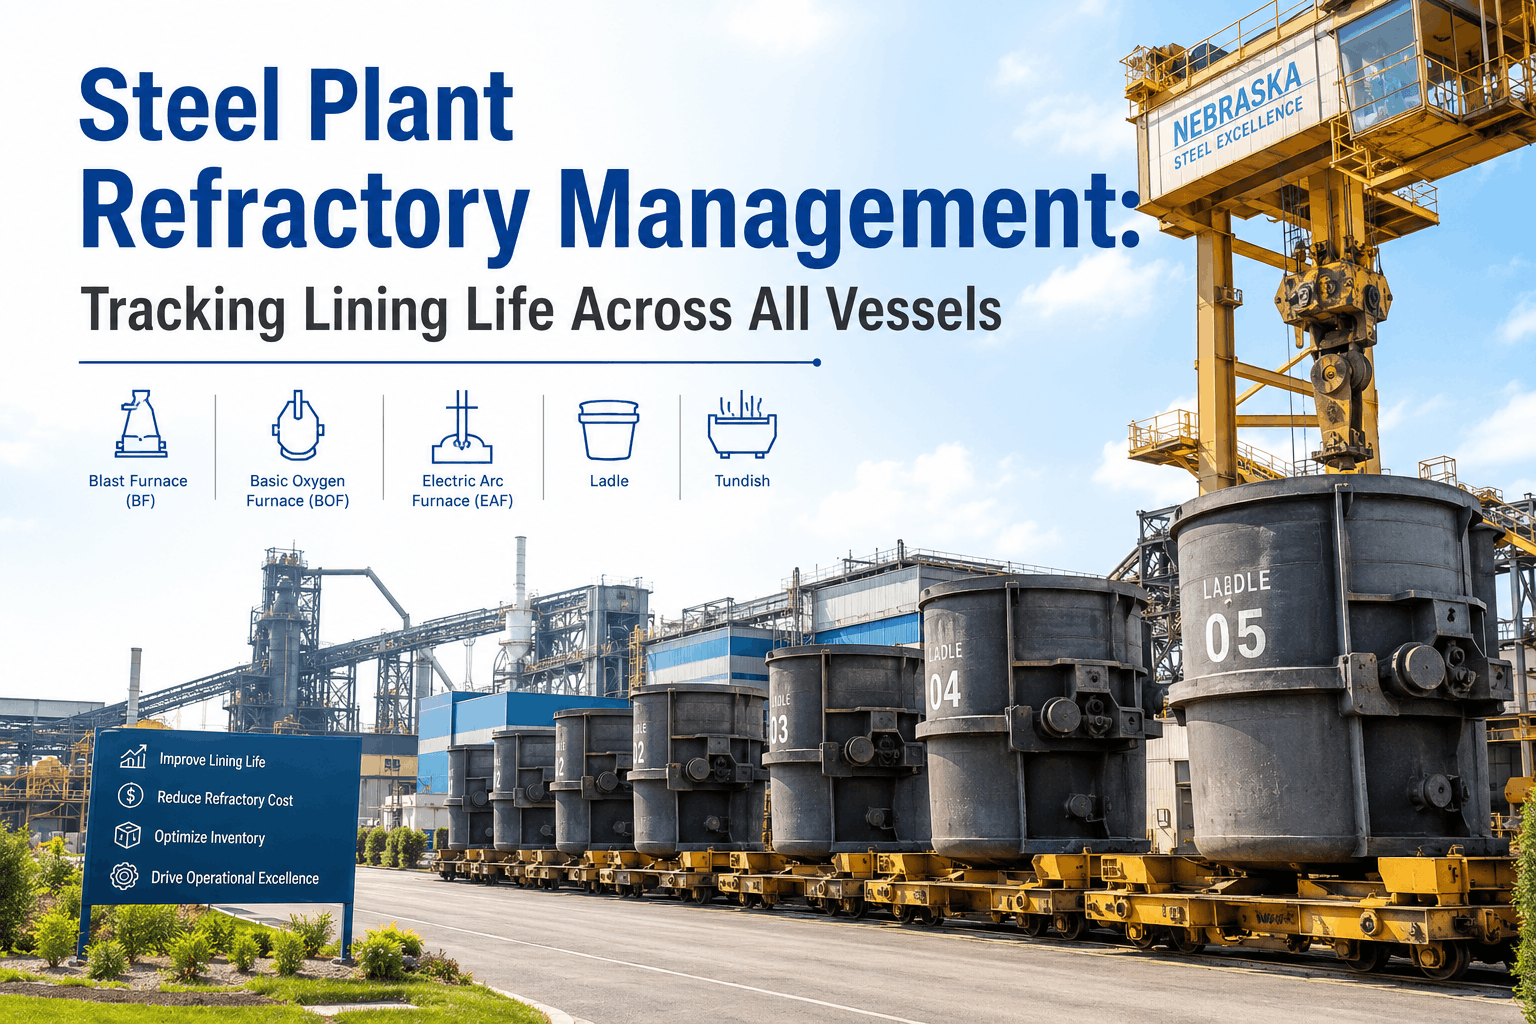
Refractory is the second-largest consumable cost in steelmaking after raw materials — and the least systematically managed. A typical integrated steel plant consumes 8–15 kg of refractory per ton of steel produced, spending $15M–$60M annually on refractory materials alone. That figure doesn't include the $20M–$100M+ in production losses from unplanned shutdowns caused by refractory failures: ladle breakouts from eroded working linings, BOF reline delays from poorly tracked lining campaigns, tundish failures from unexpected wear-through, EAF hot spots from deteriorated sidewall patches, and torpedo car leaks from missed inspection intervals. Yet most steel plants manage this enormous cost center with spreadsheets, paper logs, and tribal knowledge. The melt shop superintendent knows that Ladle 7 "usually gets about 80 heats" before relining. The BOF crew tracks lining thickness on a clipboard that sometimes gets filed and sometimes doesn't. The tundish preparation team replaces linings on a fixed schedule that's either too early (wasting refractory and preparation labor) or too late (risking breakout). The refractory warehouse orders material based on last year's consumption plus a safety margin, carrying $2M–$8M in inventory with frequent stockouts on critical items and excess stock on others. A refractory management system built on a CMMS platform replaces this fragmented approach with integrated tracking of every refractory-lined vessel in the plant: every lining installation, every thickness measurement, every repair event, every heat or cycle accumulated, every material consumed, and every cost incurred — creating the data infrastructure that transforms refractory from an uncontrolled cost to a managed, optimized, and predictable operation.
Steel Plant Refractory: The Cost Nobody Manages Properly
$15M–$60M
Annual refractory material cost at a typical integrated mill
8–15 kg/ton
Refractory consumption per ton of steel — every kilogram trackable
50–200+
Refractory-lined vessels across an integrated plant — each with unique lining life
$20M–$100M+
Annual production loss from refractory-related unplanned shutdowns
The Vessel Map: Where Refractory Lives in the Steel Plant
Refractory isn't one material in one location — it's dozens of material grades across 50–200+ vessels spanning every stage of steelmaking. Each vessel operates at different temperatures, chemical environments, mechanical stresses, and cycle frequencies, requiring different refractory types with different wear rates and different management strategies. A refractory management system must track them all. OxMaint provides the unified platform to manage every vessel across the entire plant.
Campaign tracking by zone (hearth, bosh, belly, shaft, throat). Thermocouple-driven wear estimation. Hearth erosion modeling critical for campaign-end decisions worth $50M–$200M in reline cost.
Torpedo Cars / Hot Metal Ladles
Lining life: 300–1,500 tripsMaterials: alumina-SiC-carbon, high aluminaTemp: 1,350–1,500°C
Track trips per car, slag line wear rate, gunning frequency and material consumption. Fleet rotation scheduling to balance wear across all cars and prevent simultaneous reline requirements.
Zone-specific thickness tracking (charge pad, trunnion, barrel, bottom, tap hole). Slag splashing effectiveness monitoring. Gunning schedule optimization based on measured wear, not fixed intervals. Campaign-end prediction driving $2M–$5M reline timing decisions.
EAF (Electric Arc Furnace)
Lining life: 400–2,500 heatsMaterials: MgO-C, dolomite, high aluminaTemp: 1,600–1,800°C (arc zone 3,000°C+)
Hot spot monitoring at electrode zones, slag line, tap hole. Gunning and patching material consumption per heat. Delta lining pattern tracking — wear concentrated at hot spots requires targeted repair scheduling separate from full reline.
Per-ladle heat count tracking. Slag line, bottom, and barrel zone wear differentiation. Ladle fleet rotation scheduling to even out wear and coordinate reline schedules. Working lining vs. safety lining thickness monitoring. Slide gate and porous plug life tracking as sub-components.
Secondary Metallurgy & Casting
Ladle Furnace / Degasser
Lining life: shared with ladle (60–150 heats)Materials: MgO-C, spinelAdditional: arc exposure zone on LF ladles
Ladles used in LF service experience higher slag line wear from longer holding times and arc heating. Track which ladles are routed through LF versus direct to caster — differentiated wear rates require adjusted campaign life expectations.
Heats per tundish campaign. Spray coating thickness and adhesion quality per application. Wear-through risk assessment at dam/weir areas. Nozzle well block life tracking. Tundish preparation cycle time management — balancing preparation quality with turnaround speed.
Per-heat consumption tracking. SEN life by steel grade (aggressive grades erode nozzles faster). Ladle shroud and tundish shroud condition assessment. Mold powder consumption rate as indicator of casting conditions — abnormal consumption signals mold operation issues.
Five Problems a Refractory Management System Solves
Every steel plant has these problems. Most accept them as unavoidable. They're not — they're the consequence of managing refractory without a system.
01
Reline Timing Decisions Based on Intuition
Without system: The melt shop superintendent decides when to reline based on heat count and experience. "We usually get 100 heats on our ladles" — but Ladle 12 gets 120 heats because it runs cooler grades while Ladle 3 only gets 75 because it's always on the LF route. Fixed-interval relining wastes 15–25% of remaining lining life on some vessels and risks breakout on others.
With system: Every vessel's actual wear rate is tracked by zone, adjusted for service severity (grade mix, holding time, treatment route). Reline scheduling is based on measured or modeled remaining thickness, not average heat counts. Each vessel is relined at its optimal point — maximizing lining utilization while maintaining safety margins. Result: 10–20% more heats per campaign with lower breakout risk.
02
Refractory Inventory Disconnected from Consumption
Without system: Warehouse carries $2M–$8M in refractory inventory ordered based on last year's consumption plus a buffer. Stockouts on critical items (MgO-C bricks for BOF reline) cause 2–5 day reline delays costing $1M+ in lost production. Meanwhile, $500K–$2M in slow-moving material sits on shelves for grades that haven't been used in two years.
With system: Refractory consumption is tracked in real time against every vessel's lining campaign. The system calculates forward consumption based on current campaign status and planned reline schedule — generating purchase orders weeks before material is needed. Inventory turns improve 30–50%. Stockout events drop 80–95%. Carrying cost decreases 20–40%.
03
No Visibility into Refractory Cost per Ton of Steel
Without system: Total refractory spend is known from purchasing records, but cost per ton of steel, cost per vessel type, cost per product grade, and cost per lining campaign are unknown or require manual calculation from scattered records. Without this visibility, cost optimization is impossible — you can't improve what you can't measure.
With system: Every refractory material consumed is linked to a specific vessel, a specific campaign, and the heats produced during that campaign. Cost per ton of steel is calculated automatically, broken down by vessel type, zone, material grade, and supplier. Variance analysis identifies which vessels, which materials, and which practices are driving costs above benchmark — making optimization targets specific and actionable.
04
Gunning & Repair Scheduling Disconnected from Wear Data
Without system: Gunning on BOF converters and EAFs is scheduled by heat count interval (e.g., "gun every 300 heats") regardless of actual wear. Some gunning events are premature (wasting $5K–$15K in material and 4–8 hours of converter downtime). Others are late (wear has already progressed past the point where gunning is effective, requiring heavier repair or shortened campaign).
With system: Gunning and intermediate repairs are triggered by measured or modeled lining thickness, not fixed intervals. The system tracks wear rate by zone and flags when specific zones approach gunning thresholds. Material quantity is calculated based on actual repair area and depth, not standard recipes. Result: 15–30% reduction in gunning material consumption with improved lining life because repairs happen at the right time and right place.
05
Fleet Rotation Causing Unbalanced Wear
Without system: Ladle, torpedo, and tundish fleets are rotated based on availability and operator convenience — not lining condition. Result: some vessels are overused (approaching reline while others sit idle with remaining life), multiple vessels reach reline simultaneously (overwhelming the relining crew), and fleet utilization is uneven.
With system: Fleet rotation recommendations based on each vessel's current lining status, accumulated heats/trips, and remaining estimated life. The system balances utilization across the fleet to prevent clustering of reline events and ensures every vessel is used proportionally to its remaining capacity. Reline crew workload smoothed across the year instead of concentrated into peaks.
50–200 Vessels. Dozens of Refractory Grades. Millions in Annual Spend. One System to Track It All.
OxMaint integrates refractory lining lifecycle tracking, consumption management, inventory optimization, and cost analytics into a single platform — connecting every vessel, every campaign, every repair, and every material across the entire plant.
Lining Lifecycle Management: From Installation to Retirement
Every refractory lining has a lifecycle that should be tracked from the moment it's installed to the moment it's demolished and replaced. The data generated across this lifecycle — thickness measurements, wear rates, repair history, material consumption, service conditions — is what drives optimization. Without capturing it systematically, every new campaign starts from zero knowledge.
Phase 1
Lining Installation
Record: date installed, vessel ID, lining design (material by zone, thickness by zone, brick/monolithic/castable specification), supplier and batch for each material, installation crew and contractor, total material consumed, installation time, and any deviations from design (substituted materials, reduced thickness in constrained areas).
Why it matters: Links the specific lining design and materials to subsequent performance. When Campaign A achieves 120 heats and Campaign B only gets 85, the installation record reveals the difference — different brick supplier, different installation crew, or different design in a critical zone.
Phase 2
Break-In & Baseline
First 5–15% of campaign life. Controlled heat-up to cure refractory and establish protective slag coating. Initial thickness measurements establish the campaign baseline. First wear rate data points calibrate the campaign life prediction model. Any early-life anomalies (spalling, cracking, poor coating adhesion) are flagged as risk factors.
Why it matters: Early campaign behavior predicts total campaign life. A lining showing 15% faster initial wear than the baseline for that design will likely underperform the full campaign — triggering adjusted scheduling and earlier reline planning.
Phase 3
Stable Production
Peak productivity period — 50–70% of campaign life. Wear rates stabilized and predictable. Periodic thickness measurements (frequency based on vessel type: every heat for tundish via laser, every 100–200 heats for BOF, every reline cycle for ladles). Intermediate repairs (gunning, patching, slide gate changes, porous plug replacements) tracked with material consumed and area repaired.
Why it matters: Stable-phase data drives gunning optimization — scheduling repairs when zone-specific wear rates indicate need, not on fixed intervals. Material consumption during this phase is the largest cost component and the greatest optimization opportunity.
Phase 4
End-of-Campaign Decision
Critical period — final 15–25% of campaign life. Thickness measurements increase in frequency. Wear rate models project remaining life by zone. The system balances the economic value of extracting additional heats (avoiding reline cost per heat) against the increasing risk of lining failure (breakout cost, safety risk, unplanned downtime). Reline scheduling coordinated with production planning, contractor availability, and material procurement lead times.
Why it matters: The reline decision is worth $500K–$5M depending on vessel type. Too early wastes 10–20% of lining life. Too late risks $1M–$20M breakout events. Data-driven timing optimizes this decision systematically instead of relying on individual judgment.
Phase 5
Reline Execution & Campaign Review
Old lining demolished, vessel inspected (shell condition, permanent lining assessment), new lining installed. Post-campaign review: actual heats achieved vs. predicted, actual wear by zone vs. modeled, material consumption vs. budget, repair frequency and effectiveness, any incidents or anomalies. Lessons learned feed into the next campaign's design and scheduling.
Why it matters: Campaign review is where continuous improvement happens. Comparing 10–50 campaigns on similar vessels reveals which designs, materials, suppliers, and operating practices produce the best lining life at the lowest cost — knowledge that compounds over years into millions in savings.
The system calculates when each vessel will need relining based on current campaign status and wear rate, then aggregates material requirements across all vessels to produce a rolling 3–12 month consumption forecast. Purchase orders are generated automatically when forward demand exceeds available inventory, accounting for supplier lead times (2–12 weeks for specialty refractories). Result: material arrives when needed, not too early (carrying cost) or too late (stockout delay).
Batch & Supplier Traceability
Every refractory material batch is tracked from receipt through installation to campaign performance. When a lining campaign underperforms, the system traces back to the specific material batches used — identifying whether the issue is supplier quality, installation practice, or service conditions. This traceability drives data-based supplier qualification decisions: which suppliers' materials consistently produce the longest campaigns, the lowest cost per heat, and the fewest mid-campaign repairs.
Cost per Ton Dashboarding
Total refractory cost per ton of steel — the KPI that connects refractory management to plant economics — calculated automatically from material consumption, labor costs, and production data. Broken down by vessel type (ladle, BOF, tundish, EAF), by zone within each vessel (slag line, bottom, barrel, tap hole), and by material grade. Trend analysis reveals whether refractory cost is improving, stable, or deteriorating — and which specific areas are driving the change.
Gunning Material Optimization
Gunning and patching consume 20–40% of total refractory material budget on BOF and EAF operations. The system tracks material consumed per gunning event, correlates it with the lining condition before and after, and identifies the optimal gunning timing and material quantity. Over-gunning wastes $5K–$15K per event; under-gunning allows wear to progress past the point of effective repair. Data-driven gunning typically reduces material consumption 15–25% while improving repair effectiveness.
ROI: Refractory Management System for Steel Plants
Annual ROI — Integrated Steel Plant (2–3M tons/year)
10–20% more heats per campaign across ladle, BOF, tundish, and EAF through data-driven reline timing — each additional heat avoids $300–$600 in prorated reline cost
$3.2M
Prevented Unplanned Shutdowns
60–80% reduction in refractory-related unplanned stops through lining condition tracking, wear rate monitoring, and proactive reline scheduling
$2.1M
Gunning & Repair Material Optimization
15–25% reduction in gunning material consumption through condition-based scheduling, optimized material quantities, and targeted zone-specific repairs
$1.5M
Inventory Carrying Cost Reduction
20–40% lower refractory inventory value through forward consumption forecasting and demand-linked ordering — while eliminating stockout events on critical materials
$900K
Supplier & Material Optimization
Campaign performance data by material batch and supplier drives evidence-based procurement — switching to consistently top-performing suppliers saves 5–15% on material cost at equivalent or better lining life
Expert Perspective: Building a Refractory Management Culture
"
I spent 16 years managing refractory operations at three integrated steel plants. The transformation from spreadsheet-based tracking to a CMMS-integrated refractory management system was the single most impactful change in my career — not because the technology was revolutionary, but because it made visible what had always been invisible. At my first plant, we knew our total refractory spend was $28 million per year. What we didn't know was that 35% of that cost was concentrated in steel ladle linings, that three specific ladles in our fleet of 24 were consuming 22% of the total ladle refractory budget (because they were always assigned to the LF route with the most aggressive slag chemistry), that our BOF gunning material consumption varied by 40% between shifts (because one crew gunned heavier than necessary "just in case"), and that one refractory supplier's MgO-C bricks consistently achieved 12% longer campaign life than the other's at the same price point. None of this was knowable from our spreadsheet system. When we implemented the CMMS with refractory tracking, all of it became visible within the first six months of data collection. We redirected the three worst-performing ladles to less aggressive service, retrained the heavy-gunning crew with data showing their excess consumption, consolidated purchasing to the consistently better-performing supplier, and adjusted our ladle reline schedule from a fixed 90-heat cycle to a condition-based approach ranging from 70 to 130 heats depending on each ladle's actual wear rate. First-year savings: $3.4 million on a $28 million spend — a 12% reduction. And that was just the beginning. By year three, our refractory cost per ton of steel had dropped from $11.20 to $8.60, a 23% reduction that sustained through continuous optimization driven by the data the system collected every day. The hardest part wasn't technology — it was getting the relining crews to record data consistently. We succeeded by making it easy (mobile entry on tablets at the relining station) and making it meaningful (showing crews how their data directly influenced scheduling decisions that affected their workload).
Track by vessel and by zone — plant-level averages hide the specific vessels and zones driving disproportionate cost
Link refractory performance to supplier and batch — procurement decisions should be data-driven, not relationship-driven
Condition-based relining beats fixed intervals — some vessels need early reline, others have life to spare
Make data entry easy and meaningful — mobile tablets at relining stations with visible impact on scheduling decisions drive adoption
Refractory management is where maintenance management, materials science, production scheduling, procurement, and cost control converge into one of the highest-value optimization opportunities in steelmaking. The plant that knows the exact condition of every lining in every vessel, predicts reline timing weeks in advance, optimizes repair scheduling by measured wear instead of fixed intervals, and connects every kilogram of material consumed to the campaign performance it produced is the plant that controls its $15M–$60M refractory budget instead of being controlled by it. If you're ready to build that system, book a free demo to see how refractory management works on OxMaint.
Every Vessel. Every Lining. Every Campaign. Every Kilogram. One System.
OxMaint delivers integrated refractory management — vessel lifecycle tracking, zone-specific wear monitoring, campaign performance analytics, condition-based reline scheduling, gunning optimization, inventory forecasting, supplier traceability, and cost-per-ton dashboarding. One platform for your entire refractory operation.
How does the system track lining thickness when direct measurement is only possible during shutdowns?
Lining thickness management uses a combination of direct measurement and modeled estimation between measurements. Direct measurement methods depend on the vessel type: laser scanning (available during short stops on BOF, ladle, and tundish — provides full-surface thickness map in minutes), ultrasonic testing (contact measurement during shutdowns — high accuracy at specific points), dip-rod or physical measurement through the vessel mouth (traditional method, limited to accessible points), and embedded thermocouple-based estimation (for blast furnace hearths and other vessels with permanent thermocouple arrays — temperature profile math models calculate remaining lining thickness continuously). Between direct measurements, the system estimates current thickness using wear rate models calibrated from historical measurement data: the model takes the last measured thickness, applies the calculated wear rate for each zone (adjusted for operating conditions — slag chemistry, temperature, cycle count, repair history), and projects current thickness. This modeled thickness updates with every heat or cycle and is validated against the next direct measurement. When the modeled thickness approaches minimum safe limits, the system flags the vessel for measurement verification — ensuring no vessel operates past safe limits even if the measurement schedule hasn't caught up. The accuracy of the model improves over time as more measurement points calibrate it. After 3–5 campaigns of tracked data on a vessel type, the wear rate model typically predicts campaign life within ±10% accuracy.
How does the system handle steel ladle fleet rotation and reline scheduling?
Ladle fleet management is one of the most complex and highest-value functions of the refractory management system because it coordinates individual vessel condition with fleet-level production requirements. A typical BOF shop operates 15–30 steel ladles, each cycling through: filling at the BOF or EAF, transport to secondary metallurgy (ladle furnace, degasser, alloy station), transport to the caster, emptying, turnaround preparation (skull removal, visual inspection, slide gate change if needed), and return to service. The system tracks each ladle's current status in this cycle and its lining condition: accumulated heats since last reline, estimated remaining lining thickness by zone (slag line, bottom, barrel), service severity factor (ladles used for aggressive grades or extended LF treatment accumulate wear faster), and sub-component status (slide gate plates, porous plugs, nozzle wells — each with independent life tracking). Fleet rotation optimization balances multiple objectives simultaneously: ensure enough ladles are available for production at all times (no production delays from ladle shortage), distribute heats across the fleet to prevent clustering of reline events (which would overwhelm the relining crew and create fleet shortages), route ladles with more remaining life to more aggressive service and protect ladles approaching reline from the most damaging routes, and schedule relines to align with planned production maintenance windows where possible. The system provides a fleet dashboard showing every ladle's position (in service, turnaround, reline) and estimated remaining life, with automated alerts when reline scheduling requires attention.
Can the system track refractory performance by steel grade and process route?
Yes, and this is one of the most powerful analytical capabilities. Different steel grades create dramatically different refractory wear environments. Ultra-low carbon grades requiring aggressive degassing attack ladle refractory through intense stirring and extended exposure. High-manganese grades produce chemically aggressive slag. Calcium-treated grades for inclusion modification create calcium aluminate deposits that penetrate refractory pores. Stainless steel grades with high chromium content create different slag chemistry than carbon steel grades. The system links every heat processed in every vessel to the steel grade, treatment route (which secondary metallurgy stations the ladle visited), holding time (longer holding = more thermal and chemical attack), and treatment intensity (stirring rate, arc heating duration). Over multiple campaigns, this data reveals the actual wear contribution of each grade and route. A ladle that processes 40% demanding grades might get 75 heats per campaign while a ladle processing primarily standard carbon grades achieves 120 heats — and the appropriate reline schedule should reflect this difference. The analytics enable: grade-adjusted campaign life prediction (accounting for the planned grade mix in the next campaign), identification of specific grades or process steps that disproportionately consume lining life (enabling process optimization or material selection changes), and accurate cost allocation of refractory expense to product grades (supporting accurate product costing).
How does the system integrate with existing refractory measurement and monitoring equipment?
The system is designed to accept data from any measurement technology currently used in the plant, typically through a combination of automated data feeds and manual entry. Automated integration sources include: laser scanner systems (specialty cameras or LiDAR systems that produce 3D thickness maps — data imported directly via file transfer or API), embedded thermocouple systems (particularly blast furnace hearth monitoring — real-time temperature data fed to the wear model continuously), production tracking systems (MES or Level 2 systems providing heat count, grade, treatment route, and timing data per vessel per heat — essential for linking lining wear to service conditions), and warehouse management systems (material receipt, issuance, and inventory data feeding the consumption tracking and forecasting modules). Manual entry interfaces include: mobile tablet applications for relining crews to record installation details (material type, batch, thickness, crew), post-campaign inspection results (residual thickness measurements, visual observations, photos), gunning and repair records (date, zones repaired, material consumed, estimated repair thickness), and sub-component changes (slide gate plates, porous plugs, nozzle wells). The system normalizes data from all sources into a unified vessel history — so regardless of whether a thickness measurement came from a laser scanner, an ultrasonic probe, or a manual dip-rod reading, it's recorded against the same vessel timeline and feeds the same wear rate model.
What is a realistic implementation timeline for a refractory management system at an integrated steel plant?
A phased implementation at a 2–3M ton integrated plant typically follows this timeline. Phase 1 (months 1–3): Asset registry and baseline — catalog every refractory-lined vessel in the plant with current lining status, establish the CMMS asset hierarchy (plant → area → vessel → lining zones → sub-components), import available historical campaign data from existing records, and configure the measurement and inspection workflows. Phase 1 deliverables: complete vessel inventory with current campaign status, digital inspection checklists deployed, and manual data entry workflows operational. Phase 2 (months 3–6): Campaign tracking goes live — every new lining installation is recorded in the system, heat counts accumulate automatically (from MES integration or manual entry), first thickness measurements are recorded digitally, and gunning/repair events are tracked with material consumption. Inventory module connects refractory consumption to vessel campaigns. Phase 2 deliverables: active campaign tracking on all vessels, first forward consumption forecasts, initial cost-per-ton calculations. Phase 3 (months 6–12): Analytics and optimization — enough campaign data has accumulated to establish vessel-specific wear rate baselines, condition-based reline scheduling begins replacing fixed-interval scheduling, fleet rotation recommendations are generated, supplier performance comparison becomes data-driven, and the first full annual refractory cost analysis is produced. Phase 3 deliverables: data-driven reline scheduling, optimized gunning intervals, inventory forecast accuracy validation, ROI measurement against baseline. Phase 4 (year 2+): Continuous improvement — wear rate models refined with additional campaign data, advanced analytics (grade-adjusted predictions, cross-vessel optimization), integration with process control for real-time wear impact estimation, and benchmarking across multiple plant sites if applicable. Full system maturity typically reached by month 18–24 with measurable ROI from month 6 onward.